Atmospheric acid deposition is an environmental concern worldwide, and the determination of its impacts in remote areas can be problematic [1]. Acidification is primarily related to the emissions of SO2 and NOx, since these gases are the precursors of major acids like H2SO4 and HNO3. On the other hand, the neutralization of acidity in rainwater can be achieved either by CaCO3 in airborne dust [2,3] and or by ammonia released from industrial, agricultural, and other natural sources [4].
The chemical composition of rainfall depends strongly on the atmosphere. The concentrations of chemical species in precipitation vary widely in relation to a multiplicity of factors, such as the type and distribution of aerosol sources, transport of aerosols, chemical species, and the scavenging processes of species. Meteorological factors are often considered to be the predominant factor [5-7] in relation to rainfall; the two main processes [8, 9] are described. The first process refers to the washout of the below-cloud atmosphere during precipitation events by raindrops which scavenge and dissolve particles and gases as they fall; the washout components are mainly of local/regional origin. The second process, called "rainout," corresponds to the condensation of water vapor on aerosol particles during the formation of cloud droplets and incorporation of gases surrounding the droplets by aqueous-phase reactions. This process corresponds mainly to the incorporation of long-range transported components which may be traced back to their origins by air masses trajectories.
The chemical composition of rainfall depends strongly on the atmosphere. The concentrations of chemical species in precipitation vary widely in relation to a multiplicity of factors, such as the type and distribution of aerosol sources, transport of aerosols, chemical species, and the scavenging processes of species. Meteorological factors are often considered to be the predominant factor [5-7] in relation to rainfall; the two main processes [8, 9] are described. The first process refers to the washout of the below-cloud atmosphere during precipitation events by raindrops which scavenge and dissolve particles and gases as they fall; the washout components are mainly of local/regional origin. The second process, called "rainout," corresponds to the condensation of water vapor on aerosol particles during the formation of cloud droplets and incorporation of gases surrounding the droplets by aqueous-phase reactions. This process corresponds mainly to the incorporation of long-range transported components which may be traced back to their origins by air masses trajectories.
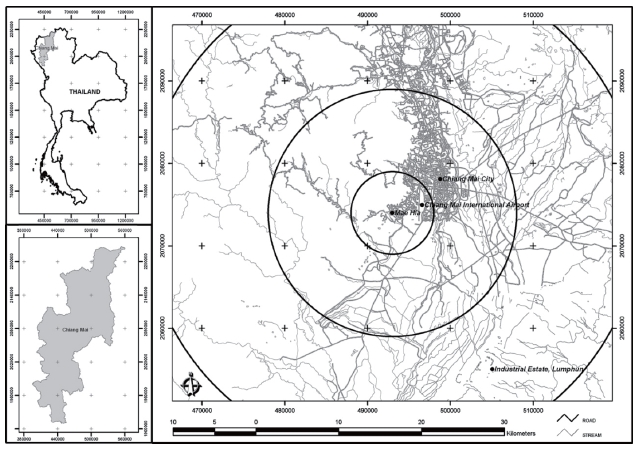
2.1. Sampling Site
2.2. Sample Collection and Analysis
Rainwater samples were collected on a daily basis for one year (January-December 2008) using an automated wet only collector. Samples were collected at 9 AM local time and dispatched to the laboratory for analysis within a week. The sampling bucket was cleaned every day after sample collection using de-ionized water with conductivity <0.15 mS/m.
The rainwater samples were weighed to determine the amount of water and were measured for electro-conductivity (EC) and pH under a controlled temperature of 25.0℃ using conductivity and pH meters, respectively. The samples were filtered through 0.45 μm cellulose acetate filter paper and stored in the dark at 4℃ until ion analysis was performed. Inorganic cations (Na+, NH4+, K+, Ca2+, and Mg2+) and anions (HCOO-, CH3COO-, Cl-, NO3-, and SO42-) in the rainwater samples were analyzed by Ion Chromatograph (Metrohm, Herisau, Switzerland). Hydrogen ion (H+) concentrations were derived from pH values [16].
In this study, principal component analysis (PCA) was used to determine the various sources of ion composition of the wet depositions. A varimax rotation with Kaiser Normalization of Principle Components Analysis by SPSS program (version 14; SPSS Inc., Chicago, IL, USA) was used for the determination of factors underlying the inter-correlations between the measured species. Pearson correlation (
3.1. Relationship Between pH and Rainfall Amount
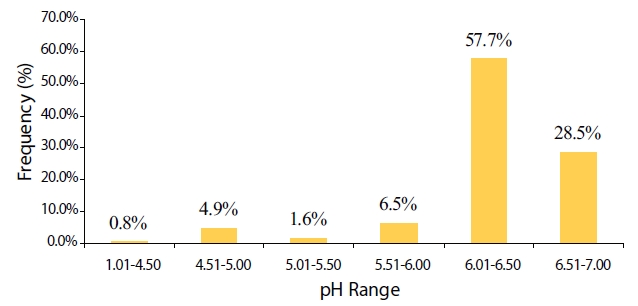
The total number of collected samples was 132 and precipitation volume was 1,286.7 mm. The frequency distribution of the rainwater pH values (n = 123 with precipitation >;4 mm) is illustrated in Fig. 2.
The total number of collected samples was 132 and precipitation volume was 1,286.7 mm. The frequency distribution of the rainwater pH values (n = 123 with precipitation >;4 mm) is illustrated in Fig. 2.
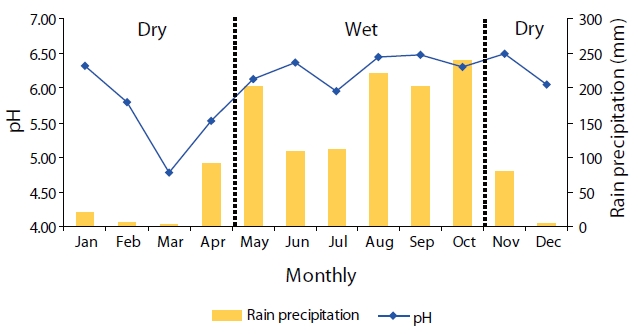
Monthly mean pH values are shown in Fig. 3. Acidic precipitation (pH < 5.6) was found during the months of March to April. Monthly mean pH values were lowest in March (pH = 4.78) and highest in November (pH = 6.50). In the dry season, high amounts of pollutants accumulated in the atmosphere due to lower levels of precipitation. Therefore, rain samples collected during the dry season contain high ionic concentrations, which presented low pH values.
3.2. Relationship Between EC and Rainfall Amount
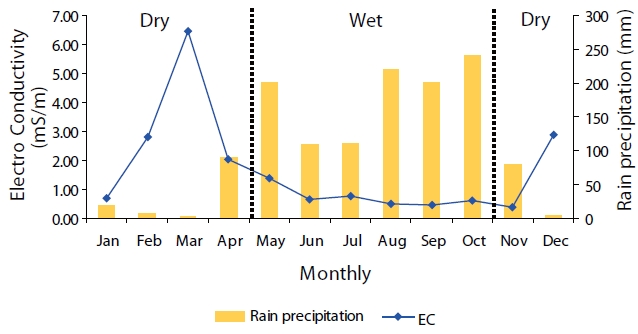
The number of rainwater samples measured for EC was 123. EC values ranged from 0.18 ? 6.82 mS/m and the volume weight mean EC value was 0.62 mS/m. The month with the highest mean EC value was March, whereas the month with the lowest value was November (Fig. 4).
The EC value is positively correlated with the level of ionic contamination in precipitation. Therefore, samples with high EC values contain high ionic concentrations. Based on the dilution effect, the amount of precipitation is inversely related to the EC values.
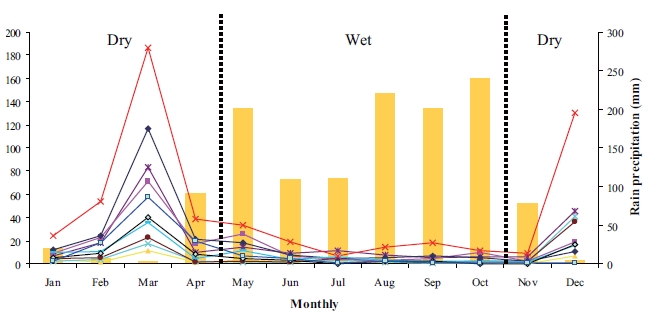
The rainwater shows remarkable seasonal variations. Monthly average anion and cation concentrations, together with precipitation amount, are illustrated in Fig. 5.
The highest ion concentrations were found in March (dry season) due to the low amount of rain precipitation and long period of non-precipitation. On the other hand, low ion concentrations were found in the rainy season.
The order of anion and cation equivalents were NH4+ (28%) >; Ca2+ (18%) >; SO42- (14%) >; NO3- (13%) >; Cl- (6%) >; CH3COO- (5%) = Mg2+ (5%) >; K+ (4%) = Na+ (4%) >; HCOO- (3%). The cation and anion species with the highest percentage of their respective categories were NH4+ and SO42-. The ratio between total anions and total cations was 43:57 with units of μeq/L.
In order to get high precision and correct data, it is necessary to do quality control. Data quality of rainwater samples was checked by ionic balance (R1) and conductivity balance (R2). The data was rejected if it did not meet the quality criteria. R1 and R2 values illustrate the accuracy of ion analysis and EC measurements, respectively. The principle of electro-neutrality in precipitation water requires that total anion equivalents be equal to total cation equivalents. Ion balance in a precipitation samples can be calculated by the following equations [18];

Where C represents anion equivalents, Cci is the concentration of i-th cation in μmol/L, Vi is the valence of the given ion.

Where A represents cation equivalent, CAi is the concentration of i-th anion in μmol/L.

This is a simplified from of the corresponding equation used by the US Environmental Protection Agency where the denominator is the average of the two sums.
For dilution solutions (e.g. below 10-3 M), the total conductivity can be calculated in mS/m from the molar concentrations and molar conductivity (at infinite dilution) of the individual ions. The calculation is as follows:
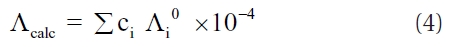
Where λcalc denotes the calculated conductivity of the solution (in mS/m), Ci represents the ionic concentration of the i-th ion (in μmol/L), and λi0 represents the molar conductivity (in S cm2/ mol) at infinite dilution and 25.0℃.
The calculation of conductivity values can then be compared to the observed value for precipitation samples with the relationship described in the equation below;

The total number of precipitation samples with complete measurements was 123 (100%). The number of samples that met the quality control criteria in terms of R1 and R2 were 62 (50.4%) and 96 (78.0%) respectively. Only 58 samples (47.2%) were qualified based on R1 and R2 combination criteria and therefore were used for statistical analysis.
Some base ions found in precipitation (e.g., Ca2+ and NH4+) act as buffers for the acidity of rainwater. To estimate the neutralization capacity of each alkaline compound, the neutralization factor (NF) was calculated by the following equation [19]: NFXi = [Xi]/([SO42-] + [NO3-]), where Xi is the chemical component of interest, with all the ions expressed in μeq/L. The corresponding values for the major cations are given in Table 1. NH4+ was found to have the highest neutralization effect, with Ca2+ having the second highest, while the contribution of Na+ and Mg2+ to the overall neutralization process was very low.
[Table 1.] Neutralization factors (NF) of the major ions in the rainwater samples
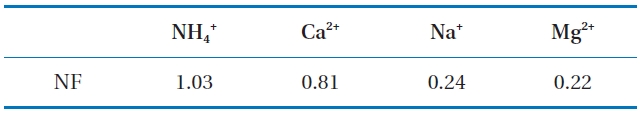
Neutralization factors (NF) of the major ions in the rainwater samples
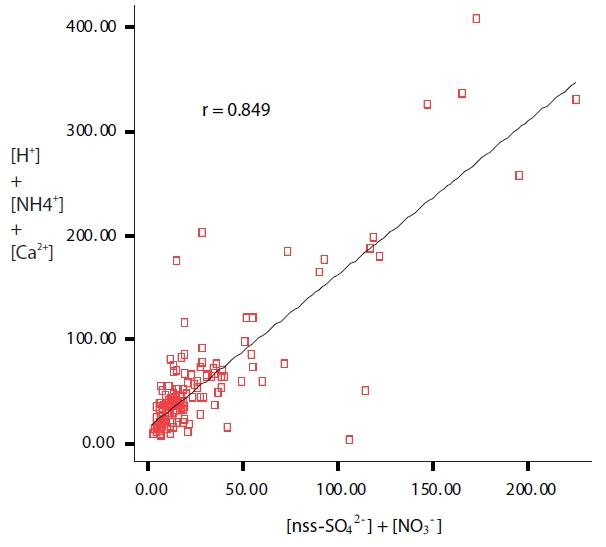
The regression coefficient of the relationship of the sum of the concentrations of the cations to the sum of the concentration of the anions was 0.849 (Fig. 6). From this relatively high correlation, we can estimate that nss-SO42- and NO3- are in neutralized forms. Such neutralization is frequently reported and attributed to NH4+ and/or CaCO3 [20]. It is expected that the sum of the concentrations of the three main cations ([H+] + [NH4+] + [Ca2+]) correlated with sum of the concentrations of the major anions ([nss-SO42-] + [NO3-]) if the acidity of the precipitation is mainly neutralized by typical bases in the atmosphere, i.e. NH3 and soil dust.
3.6.1 Correlation Analysis of Ion Composition
[Table 2.] Binary correlation coefficient between ions
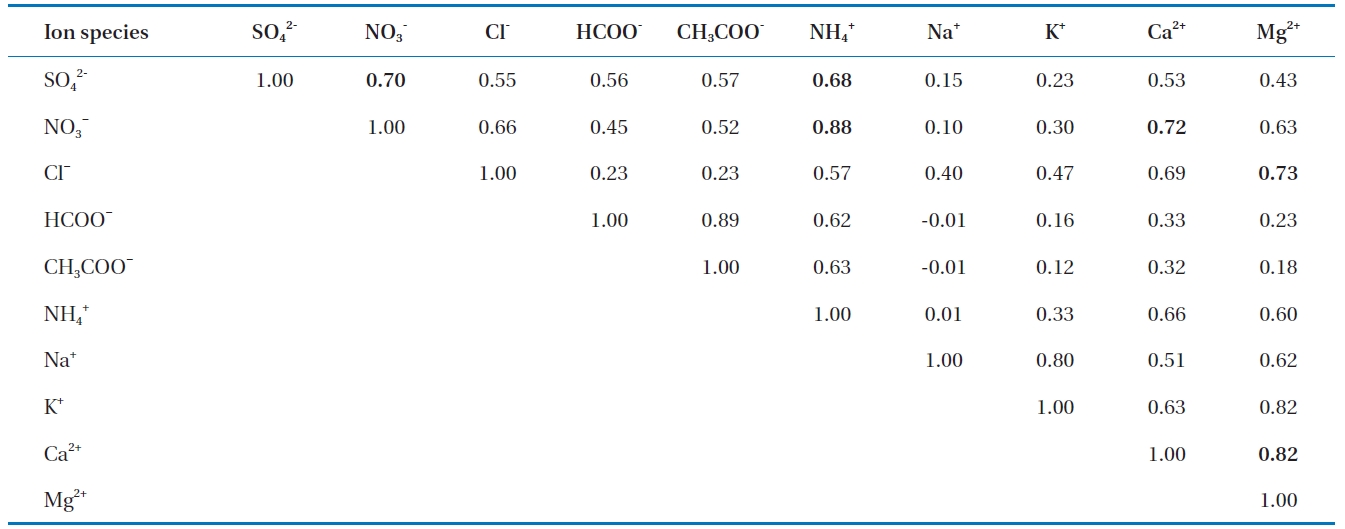
Binary correlation coefficient between ions
Correlation analysis is a useful technique to characterize relationships among the ions present in rainwater. In order to find the associations among ions in precipitation as well as the possible sources of pollutants, correlations among ions in precipitation are calculated and listed in Table 2. A correlation was seen between SO42- and NO3- (R2 = 0.70) indicating they originated from similar sources. This was due to the similarity in their behavior in precipitation and the result of the emissions of their precursors, SO2 and NOx. Similarly, a strong correlation was seen between Ca2+ and Mg2+ (R2 = 0.82), suggesting the common source of these ions was a natural source (e.g. crustal origin). Other relatively good correlations were observed between NH4+ and NO3-, Mg2+ and Cl-, Ca2+ and NO3-, and NH4+ and SO42-.
Most of these well-correlated pairs have common occurrences in precipitation as a result of atmospheric chemical reactions likely from the reaction of the acid in the atmosphere, such as HNO3 and H2SO4, with alkaline compounds rich in carbonate materials, which were carried into the atmosphere by wind-blown dust. This shows that the wind-carried dust and soil play important roles in the chemistry of rainwater. Ammonium was correlated with NO3- (R2 = 0.88). Other relatively good correlations were observed between Mg2+ and Cl-, between Ca2+ and NO3-, and between NH4+ and SO42-, with correlation values of R2 = 0.73, 0.72, and 0.68, respectively. The ammonium compounds applied to soil can escape into the atmosphere by means of gaseous NH3 or as NH4NO3 and (NH4)2SO4 particles. When NH4NO3 and (NH4)2SO4 particles are incorporated into rain, they change the NO3-and SO42- concentrations, but do not affect the pH. However, when ammonium is incorporated into rain, it can neutralize the acidity of rainwater [3].
3.6.2. Source Analysis of Chemical Components
Statistical analysis was performed using SPSS for Windows version 14.0 (SPSS Inc.). Data was log-transformed to achieve a normal distribution. Table 3 shows the varimax rotated principal component patterns for individual precipitation events. Three factors contributed to wet deposition during the sampling. Components 1, 2, and 3 were contributed 64.6%, 12.9 and 7.5%, respectively. Based on observations, only factor loads of higher than 0.5 have been deemed to be statistically significant [21]. The first principal component consists of high loads of SO42-, NO3- and NH4+. SO42- and NO3- were derived from fuel combustion [22] and NH4+ mainly originated from anthropogenic activities such as agricultural activity [23]. The second component shows high loads of Na+, Ca2+, and Mg2+, which indicated that they originated from soil resuspension (Mg2+ and Ca2+) and marine sources (Na+) [24]. The last principal component had a high load of K+ came from biomass burning [25].
[Table 3.] Principal components analysis of wet deposition
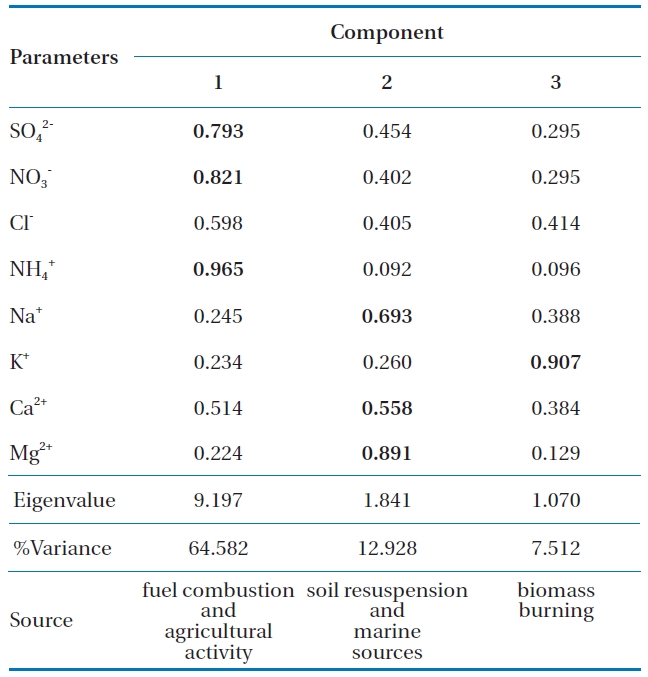
Principal components analysis of wet deposition
This study of the chemical composition of rainwater was carried out in the northern part of Thailand from January to December 2008. NH4+ and SO42- were the dominant cation and anion found in the wet deposition in this area. Ion concentrations were high in the dry season and low in the rainy season.
The PCA illuminated the sources of the pollutants detected in precipitation, including fuel combustion (SO42- and NO3-) and agricultural activity (NH4+) in the first component. The second component suggested the contribution of soil resuspension (Mg2+ and Ca2+) and marine sources (Na+). The third component was associated with biomass burning (K+).
Financial support from the Pollution Control Department (PCD) and the Higher Education Commission of Thailand are gratefully acknowledged.


![Correlation of ([H+] + [NH4+] + [Ca2+]) and ([nss-SO42-] + [NO3-]) (n = 132).](http://oak.go.kr/repository/journal/10078/E1HGBK_2010_v15n2_93_f006.jpg)