Water is a primary necessity for life, but remains a problem in urban and coastal areas in the Philippines. The country is rich in natural resources, including water, which are essential for the country’s economic development. Water resources of the Philippines include inland freshwater (rivers, lakes, and groundwater), and marine (bay, coastal, and oceanic waters). There is sufficient water; but not enough in highly populated areas, especially during the dry season.
One major source of freshwater is the groundwater. The Philippine’s reservoirs cover 50,000 km2. They have a storage capacity of 251,100 MCM. The potential supply from surface water sources is estimated at 126,000 MCM/yr, while that of groundwater is approximately 20,200 MCM/yr or about 14% of total water resources potential. Despite these figures, the Philippines ranks among the lowest in terms of freshwater availability per capita at 1,907 m3, compared with the average of 7,045 m3 worldwide and 3,668 m3 in Asia.
According to the National Water Resources Board (NWRB), the consumption of groundwater was distributed as follows: 49% for domestic sector; 32% for agriculture; 15% for industry; and the remaining 4% for all other sectors.
Surface water is largely used for agriculture (85%), while industry and domestic sectors sharing the rest. Based on a study conducted by the Japan International Cooperation Agency (JICA), water demand in the Philippines was 29,944 MCM/yr in 1996. It is expected to dramatically increase to up to 86,500 MCM/yr in 2025. In fact, water shortages are occuring increasingly nowadays. Due to the constant population growth, the groundwater is used extensively to supplement available surface water to meet the increasing water demand [1].
When fresh water is withdrawn at a faster rate than it can be replenished, a drawdown of the water table occurs with a resulting decrease in the overall hydrostatic pressure. When this happens near an ocean coastal area, salt water from the ocean intrudes into the fresh water aquifer. The result is that fresh water supplies become contaminated with saltwater [2-5]. The coastal areas of Paranaque and Las Pinas City have been experiencing rapid urbanization, leading to extremely high demands for domestic and industrial water sources. According to the National Water Resources Board (NWRB), this has induced saltwater contamination in the aquifer of Paranaque and Las Pinas City [6].
As populations continue to expand in coastal communities, the need for greater groundwater withdrawals is certain to increase. The exploitation and restoration of fresh groundwater in coastal aquifer systems should form part of integrated water management system, comprising surface water and groundwater, in terms of water quantity water quality, and water demand [7]. This study aims to simulate the present condition and extent of saltwater intrusion, as well as the projected extent and degree of salinity concentration in the aquifer bounded by Paranaque River and Manila Bay. The condition of the aquifer will be modeled in terms of salinity. From the model results, the present and future condition of the aquifer will be analyzed and possible remediation procedures will be recommended.
The hydrogeologic system and salinity were linked to the groundwater flow model software and map modeling. The geologic and hydrogeologic information and salinity concentrations were collected and compiled to generate spatial distribution and contamination maps. In line with the study purpose and for consistency with current definitions, freshwater was considered to be water comprising a maximum concentration of 1,500 μs/ cm. The water will no longer be potable once the limit exceeded, therefore additional water treatment is needed or the well must be abandoned or its operation discontinued.
2.1 Mathematical Simulation Code
Saltwater intrusion can be mathematically represented by two equations: the flow and the transport equations. Since the density of a liquid depends on the hydraulic conductivity, which in turn depends on the concentration, to correctly simulate salinity diffusion in coastal aquifers, it is necessary to have coupled flow and density-driven transport that makes the saltwater intrusion problem highly nonlinear. These nonlinear equations need to be solved simultaneously to resolve the saltwater intrusion problem.
FEMWATER, a three-dimensional finite element-based, transient, density-driven flow and transport groundwater model of the United States Environmental Protection Agency (EPA), is incorporated to simulate the coastal aquifer under study mathematically. This simulates the flow and transport in both saturated and unsaturated media. Furthermore, the density-dependent problems such as salinity intrusion can be simulated by the coupled flow and transport motion.
The three-dimensional water flow equation is expressed as [8-10]:
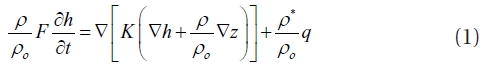
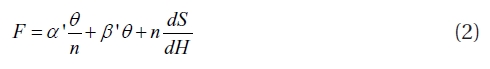
The hydraulic conductivity
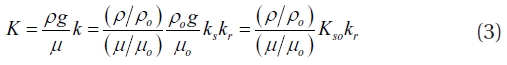
where μ is the dynamic viscosity of water at chemical concentration; μo the dynamic viscosity of water at zero salt concentration;
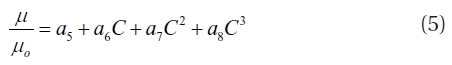
The referenced value is usually taken at zero salt concentration. The density and dynamic viscosity of water are functions of chemical concentration, as shown in Eqs. (4) and (5), respectively [8-10].
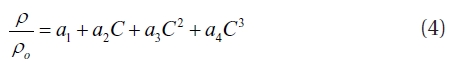
and
where
For saltwater intrusion, the fluid density is taken to be a function of salt concentration as [8-10]:

where c is the salt concentration of the seawater (the actual divided by the maximum one), and ε the dimensionless density reference ratio as defined in Eq. (7) [8-10]:
where ρmax is the maximum density of the seawater, and ρo the freshwater density.
The Darcy velocity is calculated as follows [8-10]:
The governing equations for transport describe the material transport through the groundwater systems. These equations are obtained on the basis of the law of continuity of mass and flux. The major processes involved in this are advection, dispersion or diffusion, adsorption, decay, biodegradation and injection or withdrawal.
The transport equation is [8-10],
The flow and transport equations are coupled by the density-coupling coefficient and by the Darcy velocity terms that render the saltwater intrusion nonlinear.
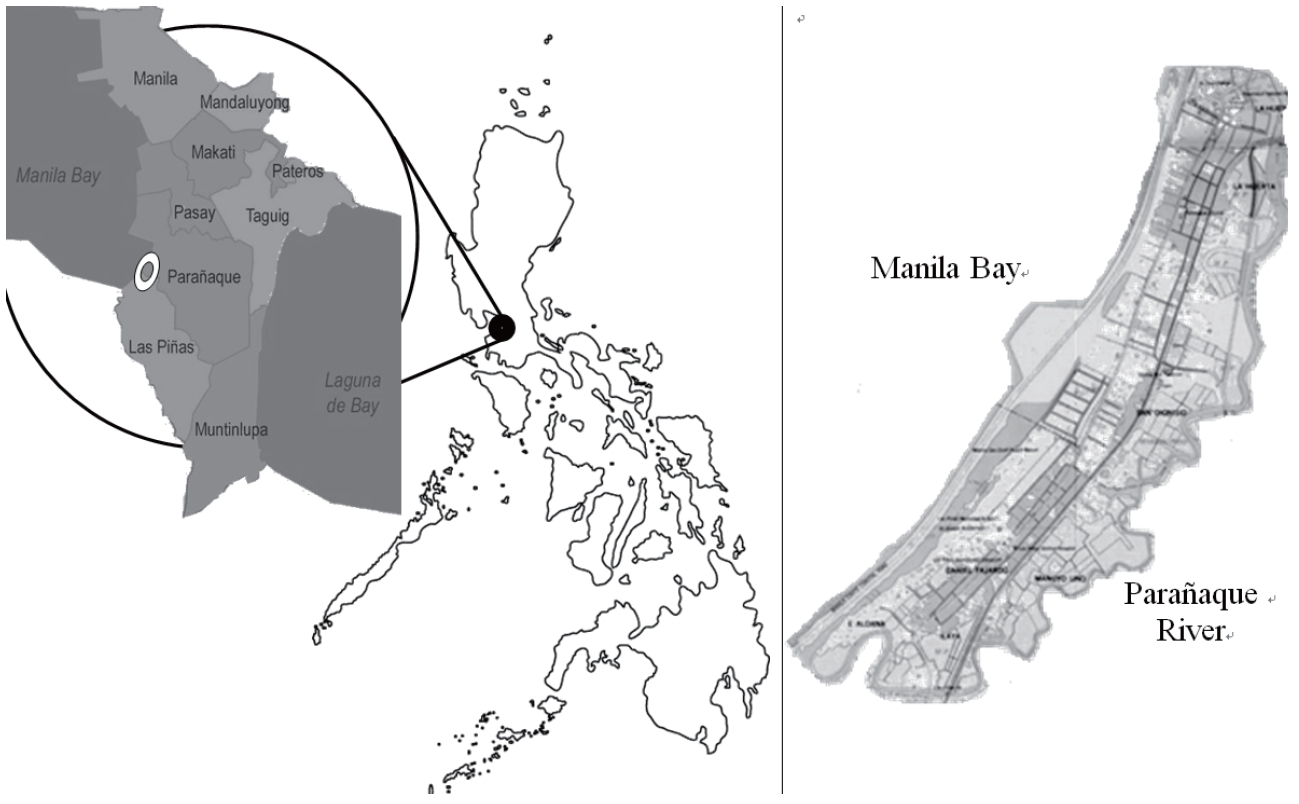
The study area was located along the southern street of Quirino Avenue of Paranaque and Las Pinas City. It is bounded by Paranaque River on its eastern part and the waters of Manila Bay on its western part as shown in Fig. 1. It is situated on a plain with parts lying along the coastline of scenic Manila Bay, has a relatively flat terrain with an average elevation of 2 m above mean sea level, and is mainly composed of alluvial soil that is a combination of tuff and sand.
The months between March and May are considered the hot summer period. The temperature dips following intermittent rains and occasional gustiness from June to October. Cool and fair weather prevails from November to February. The area experiences an annual rainfall of 1.82 mm/min, a temperature range from 23 to 33℃C; a relative humidity of 76% and an average daylight duration of 12 hours.
In the 2000 Census of the National Statistics Office (NSO), the study area had a total population of 88,583. The total household population was 88,370, with 18,548 households [11].
In-situ groundwater testing was conducted from public shallow wells during numerous field visits to the area. The spatial locations (i.e., longitude, latitude) of the surveyed wells were recorded using GPS. The surveyed wells were tested for salinity concentration (electrical conductivity, EC), and water level (hydraulic head). In addition, a wealth of information and data such as maps and drawings, reports, well inventory data, water quality data, and hydrologic data were collected from different agencies including the NWRB, National Mapping and Resource Information Authority (
The groundwater system of interest was approximately 2,000 m2, and was covered with a 3D grid. The model grid contained 820 cells with 1,221 nodes. The flow time step Δt to recalculate the groundwater flow equation was one hour. The groundwater system consisted of tuff and sand. As such, the hydraulic conductivity
The collected data were utilized to develop and implement the 3D finite element simulation model. During the in-situ groundwater testing there was no existing evidence of saltwater intrusion in the study area. However, to predict the response of the aquifer system to future withdrawal scenarios, both the flow and transport processes were subsequently modeled using FEMWATER.
FEMWATER models the density-dependent coupled flow and transport processes in the aquifer. The simulation model was not calibrated due to insufficient available data for satisfactory calibration and validation of the model. The given parameter values and boundary conditions were utilized as representative information for the study area. In addition, the basic study objective was to predict the extent and degree of the salinity concentration in the study area.
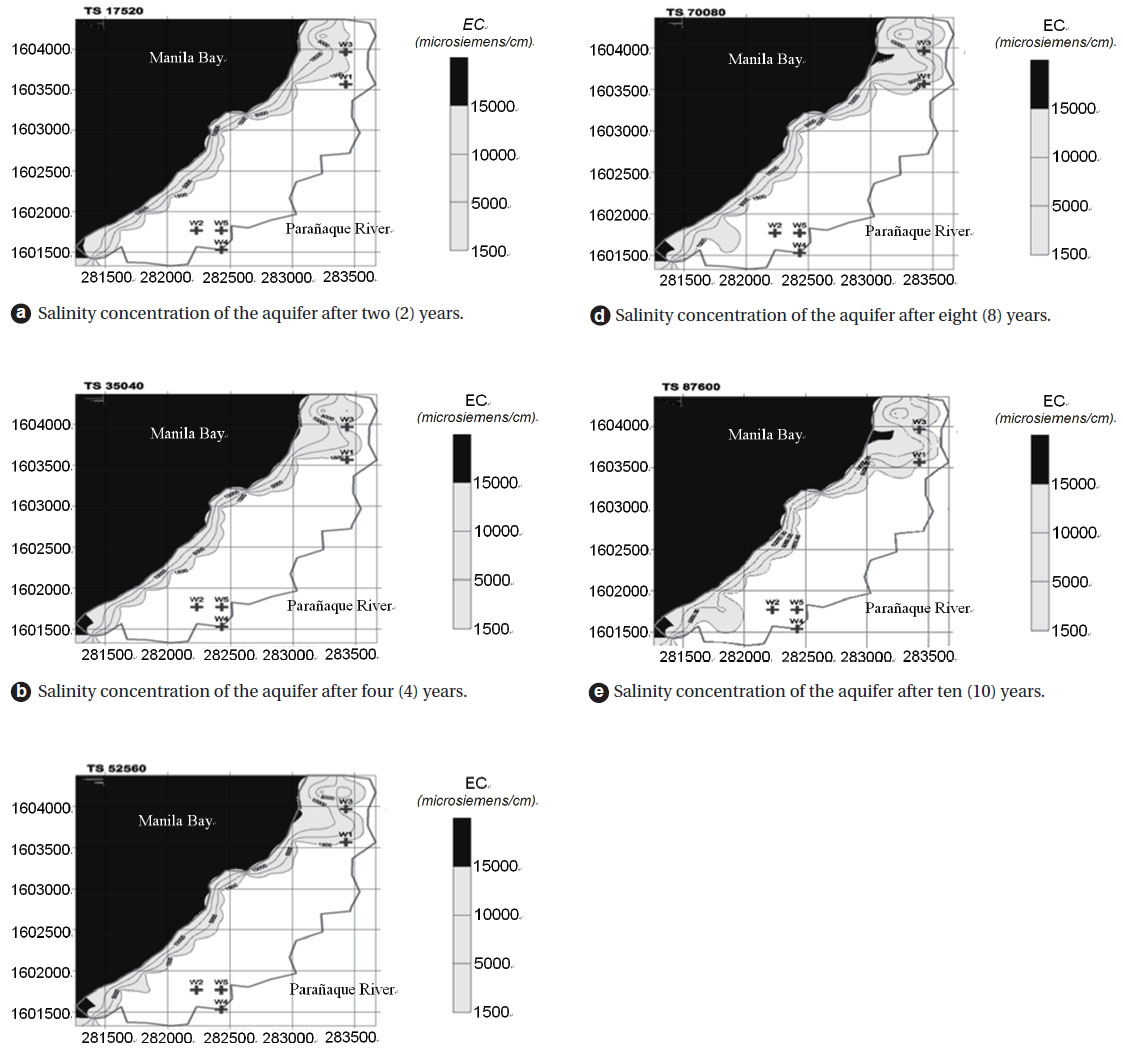
To meet these study objectives, the simulation model was used to simulate the aquifer conditions for the present discharge scenarios, and five other scenarios to forecast the possible condition of the aquifer in ten years.
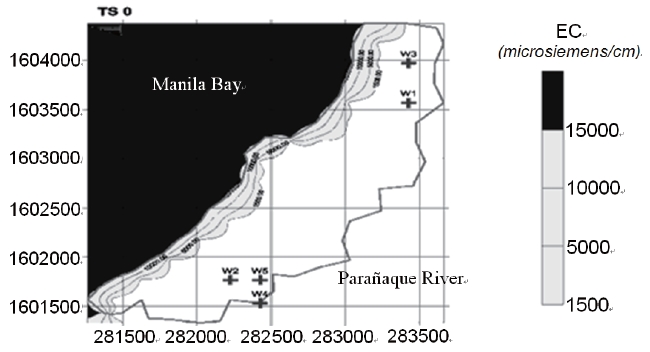
Fig. 2 shows the present salinity concentration of the aquifer based from the actual testing of the groundwater quality of wells, the present salinity concentration of the groundwater ranged from 500-700 μs/cm, and could thereby be classified as fresh and potable water.
Fig. 3 shows the different simulation model scenarios. Areas with EC greater than 1,500 μs/cm, shown as the shaded portion in the study area, were considered areas encroached by landward movement of seawater. The result indicated that areas closer to the sea will be the first affected by the landward movement of seawater flowing into areas of reduced aquifer pressures due to excessive groundwater extraction. More specifically, areas that extract a large volume of groundwater will be severely affected by the saltwater intrusion.
The primary output of this study is the groundwater and salinity contamination model of the coastal aquifer of the study area, which generates simulation results of the present and projected conditions. This pioneering simulation of the aquifer will provide a reference for other researchers. Future researchers studying groundwater management and remediation procedures will have baseline data and a working model capable of visualizing the extent of the aquifer contamination. From this, they will be able to form initial predictions regarding the cause of the problem and how to control and resolve this serious issue.
5. Conclusions and Recommendations
A saltwater intrusion model for the aquifer was generated using 3D finite element method. After determining the salinity concentration of the aquifer, the concentration contour was plotted. The model showed that after 10 years, the aquifer will be subjected to severe saltwater intrusion from the Manila Bay, and that upper portion of the study area will be the most likely affected areas due to their higher discharge rates than the other areas.
The salinity may possibly come to cover the whole aquifer, with the continual slow penetration of saltwater into other portions of the aquifer. It is therefore concluded that this model can be used as a basis to provide reliable data for projecting saltwater contamination for the management and development of groundwater resources.
In future studies on saltwater intrusion modeling, we recommend the following four issues be focused on:
To conduct occasional actual testing of the salinity concentration of the groundwater, sea and the river in order to revalidate the simulated data.
To gather for further study and research any distinctive data that different agencies lack.
To validate the actual discharge of the wells and re-run the model if possible.
To develop guidelines for the cautious management and urgent development of groundwater studies due to the great risk of saltwater contamination in the aquifer.