Dissolved organic carbon (DOC) is an importance substance in aquatic systems, playing an important role in the metabolic pathways of microorganisms and in the attenuation of ultraviolet radiation in freshwater ecosystems.1-3) Dissolved organic carbon originates from the decomposition of organic materials introduced into aquatic systems via leaching and runoff from catchments, which may contain aquatic humic substances, hydrophobic bases, hydrophobic neutrals, hydrophilic acids, and hydrophilic neutrals.4,5) Since DOC is precursor to disinfection (e.g. chlorine) byproducts (DBPs) such as trihalomethanes and haloacetonitriles, the level of DOC is of particular concern in reservoirs for drinking water. There is substantial evidence for DBPs having a negative impact on human health (e.g. mutagen and carcinogen),6-8) which is the basis for regulations on DBP concentrations in drinking water worldwide.9-11)
The Han River located at the center of the Korean Peninsula plays a pivotal role as a source of drinking, industrial, and recreational water for more than 23 million people, including residents of the Seoul metropolitan area. During the last several decades, population growth, coupled with urban and industrial development in the watershed, has resulted in a deterioration of water quality. The increase of wastewater discharged from industrial facilities led to a dramatic decline in the water quality of the river during the 1960s and 1970s. Sequential water quality management policies, including the construction of sewage treatment facilities and other hygienic treatment facilities, have applied and improved the water quality of the Han River. Therefore, it is necessary to examine changes in the water quality, especially DOC, according to application of management policies. Results from a trend analysis can provide important information about DBP precursors throughout the Han River, toward the end of reducing DBP production in the drinking water supply.
This study analyzed long-term trends of DOC concentrations in Han River using non- parametric statistical methods. The monitoring datasets obtained from the Korea Ministry of the Environment were used to analyze the trend of DOC concentrations. Among the monitoring parameters, there was none directly measuring DOC, so adopted allied parameters such as biochemical oxygen demand (BOD) and chemical oxygen demand (COD) as substitutes.
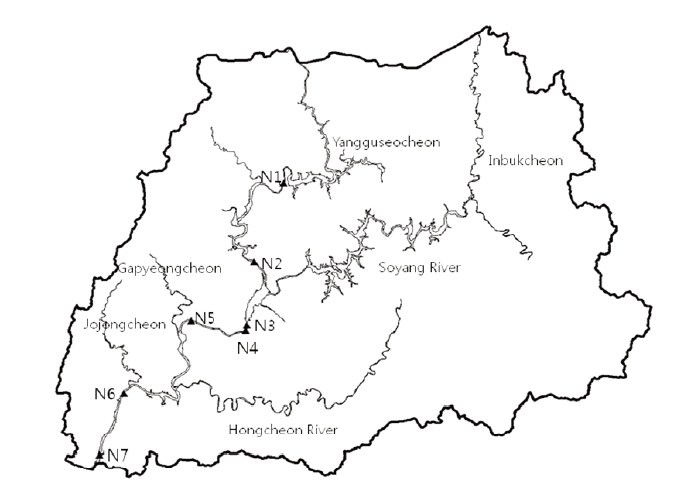
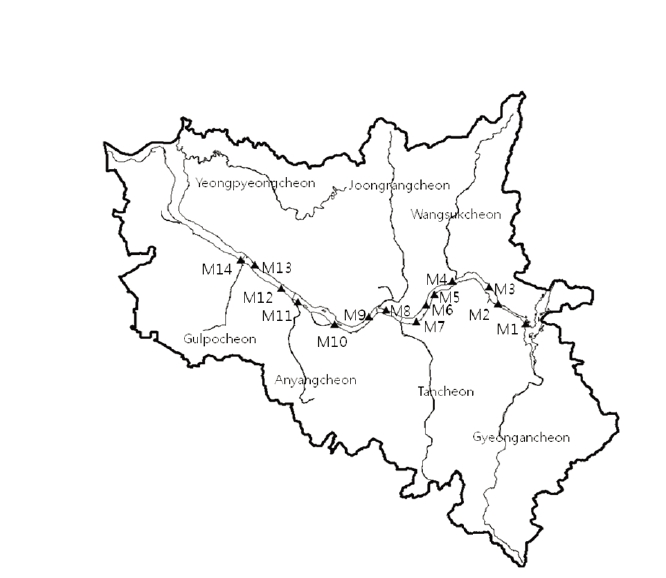
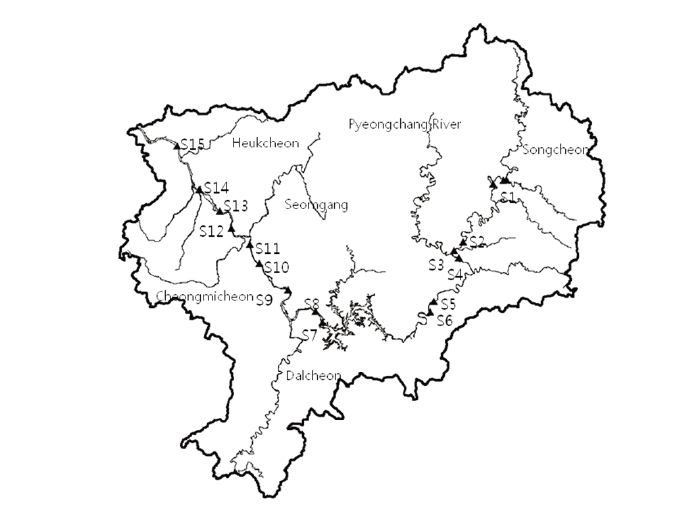
The Han River stems from Mt. Taebaek, passes through the Seoul metropolitan area, and flows westward to the Yellow Sea. The largest river in the central part of Korea, it also has the largest river basin (26,356 km2), occupying approximately a quarter of the country. The river has two main branches, the North Han River (10,698 km2) and the South Han River (12,929 km2), which merge at Paldang Lake located in the central part of Korea (37°29´°, 127°26´°).
The total monthly precipitation in the Han River basin is highly variable by season. It ranges from 22.9 mm per month in December to 353.7 mm per month in August (Korea Meteorological Administration, Korea). Approximately 70% of the annual precipitation is concentrated in the summer season, especially during the summer monsoon period (June-September). River flows reflect the seasonal variations in precipitation. The maximum discharge is observed during the summer monsoon period, while the minimum discharge is observed during the winter drying period.
The Han River has been an important source of drinking, industrial, agricultural, hydropower generation, and recreational water. Especially, the Paldang Lake supplies drinking water to more than 20 million people residing in the downstream Seoul metropolitan area. During the last several decades, population growth, coupled with urban and industrial development in the watershed, has resulted in a deterioration of water quality. Comprehensive water quality measurements have been conducted for more than 15 years at the monitoring stations covering the main stream of the river and several tributaries.12)
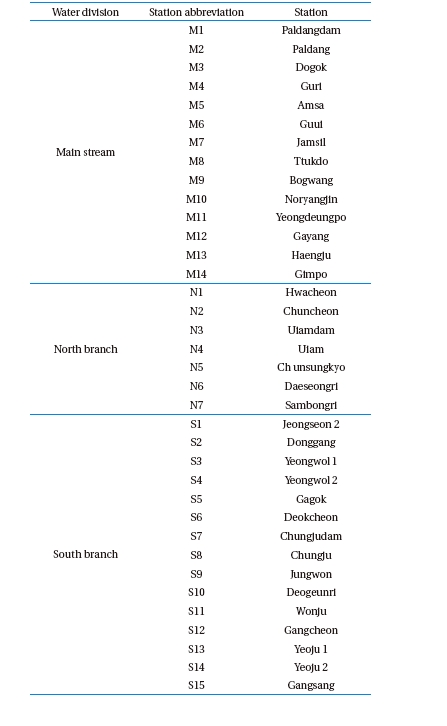
The data used for statistical analysis were obtained from the Korea Ministry of the Environment (http://water.nier.go.kr/weis/). There are 36 monitoring stations in the Han River; 14 stations in the main stream of Han River, 7 stations in the North Han River, and 15 stations in the South Han River (Table 1). Dissolved organic carbon was not measured at the monitoring stations. In addition, water quality parameters pertinent to DOC were not available among the constituents measured at the monitoring stations. Instead, a range of other water quality parameters were used to estimate DOC concentration: water color, BOD, and COD.13) Among the water quality constituents measured at the monitoring stations, two parameters, BOD and COD, were selected to analyze trends in dissolved organic matter in the Han River. All methodologies were the standard methods proposed by the Korean Ministry of Environment for river and lake waters. BOD was determined from decreases in oxygen concentration after 5 -days’ incubation in the dark at 20℃. Chemical oxygen demand was determined after oxidation of organic matter in strong acid medium by K2Cr2O7 for two hours.
A seasonal Mann-Kendall’s test, a nonparametric test, was used to determine the trends in water quality constituent concentrations. Since many environmental variables that are required assumptions for parametric tests are not normally distributed, nonparametric tests are more suitable for environmental data analysis. The seasonal Mann-Kendall’s test has been widely used in identifying water quality trends in previous studies.14-19) The seasonal Kendall’s test is a robust nonparametric procedure in which the Mann-Kendall static, Kendall’s tau, is calculated for each user- defined season. The magnitude of the trend can be determined by the slope estimates, which are the median slope of all ranked seasonal regression slopes.20) Since this estimation method assumes that the trend is constant during the period analyzed, in the case when the trend changes over time, it is not appropriate to determine variations in the trend. To show the patterns in the data, water quality data can be plotted against time with a smoothed, LOcally WEighted scatter plot Smoother (LOWESS) line as an overlay. The LOEWSS technique is a non-parametric smoothing procedure that uses a weighted, least squares regression model to fit observations within a specified window. It is a useful exploratory tool because it fits a regression model through data without making any assumption about what type of mode the data might fit. Using these non- parametric statistical techniques, long-term analyses of water quality parameters related with dissolved organic matter were conducted. All significant tests were tested at a 95% confidence level.
[Table 1.] Water quality monitoring stations in the Han River

Water quality monitoring stations in the Han River
To estimate the amount of DOC, which was not always measured at all monitoring sites, data of the allied parameters, BOD and COD, was used in a number of cases. Dissolved organic carbon may contain biodegradable fraction and recalcitrant organic substances that resist the biological processes. A series of measurements and experiments have shown that the ratio of each fraction is variable and site- specific.21,22) Compared to the BOD determined from the oxygen consumption by biological reactions, COD generally has higher values because it is determined from chemical oxygenation of recalcitrant organic materials such as humic substances. The recalcitrant organic materials derived from plant litter and soils generally contain significant aromatic carbon content.23) Anthropogenic organic material stored in the soils can be discharged into aquatic systems.24)
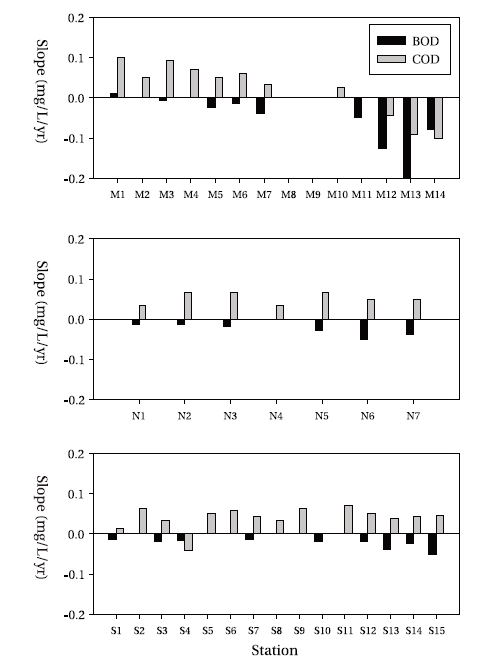
In this study, a seasonal Mann-Kendall test was used to analyze the trend of Han River (main, north and south branches) during the period 1989 - 2007. Figs. 4 and 5 indicated the trend results.
Biochemical oxygen demand concentration of the main stream showed an increasing trend at one station, and decrease trend at 9 stations among 14 stations. The slope of Paldang Dam station is 0.010 mg/L/yr according the discharge of the Paldang Dam. The BOD trend of Paldang and Dogok before Wangsukcheon (stream) is downward, but the BOD concentration of Guri after Wangsukcheon had no trend. The inflow of Wangsukcheon offsets the downward trend of the main stream of the Han River. After the Anyangcheon stream, the BOD downward trend slope becomes higher and shows a peak value at Haengju (0.200 mg/L/yr). This is a positive effect of actions by government and citizens toward saving Anyangcheon. The BOD downward trend of the north branch from upstream to downstream increases because water quality management plans are focused on downstream. The BOD trend of the south branch is downward, especially after Pyeongchang River, Dalcheon Stream, Cheongmichoen Stream, and Seomgang River. Due to careless development at Donggang, its BOD trend is a little upward. The COD concentration of the main stream showed an upward trend from Paldang Dam to Noryangjin, but a downward trend after the inflow of Anyangcheon. The COD trend of the north branch showed upward at all monitoring stations, with a trend slope is from 0.033 ? 0.067 mg/L/yr. The COD trend of south branch showed upward at all monitoring stations except Yeongwol2 and Deogeunri, with a trend slope is from 0.13 ? 0.071 mg/L/yr.
Fig. 4 shows the difference between the trend slopes of the BOD and COD concentrations. The absolute magnitude decrease in the BOD concentration is smaller than the increase in COD concentration. This indicates that the speed of decrease in BOD concentration by the several water quality management plans is slow. From Gayang to Gimpo, both BOD and COD concentrations have a downward trend, and at Haengju the peak value of BOD decrease is especially apparent.
Statistical measurements showed that the COD concentrations gradually increased throughout the analysis period, except some stations of the main branch, although BOD concentrations gradually decreased at most of the monitoring stations in the Han River. The gradual increase in COD is explained by the fact that more refractory organic materials are introduced into aquatic systems via leaching and runoff from the catchment by urban and industrial development in the watershed. Also, it has been known that climate change may significantly affect DOC
concentration in rivers.25,26) The rising temperature may enhance the activity of enzymes regulating carbon storage in land, which in turn stimulates the export of DOC from the terrestrial system.25) As a result, the increased temperature may enhance the transport of DOC from the land into the freshwater environments, which increases DOC concentrations in lakes. In addition, the change of precipitation patterns accompanied by global warming could have increased the DOC concentration in the river and streams the several preceding decades.26) The organic material fully decomposed in the land may discharge into the river by intensified precipitation followed by a long dry period, which could increase DOC concentrations, especially that of refractory organic material.
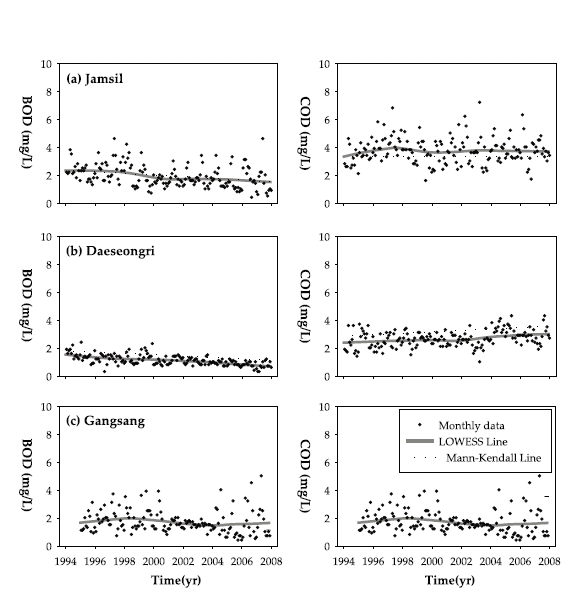
Fig. 5 shows the seasonal Mann-Kendall and LOWESS result of representative stations of each branch. Biochemical oxygen demand graphs have little difference between the Mann-Kendall and LOWESS Line. The BOD concentration of Gangsang (south branch) has increased since 1994, although the overall trend is downward. The BOD trend of Jamsil (main branch) and Daesungri (north branch) station have downward trends, and the concentration has also decreased. On the other hand, COD shows an upward trend, while there is fluctuation in COD concentrations. The COD concentration at Jamsil is higher than other stations of South and North branches, but the trend slope is not high. The COD concentration at Daeseongri gradually increases from 1994 to 2008, and a similar trend between the Mann-Kendall and LOWESS line is observed. The concentration at Gangsang decreased from 2000 to 2003, but has increased since 2004.
This resulted from the rapid development and urbanization of the North and South branch without a proper water quality management plan.
This study used the extensive monitoring datasets of the Korea Ministry of Environment to examine the trend of DOC in Han River raw water. To estimate organic contents of water, we adopted allied parameters such as BOD and COD as substitutes for DOC. Spatial and temporal analyses of monthly data of BOD and COD were performed for 36 monitoring stations (14 for Main Han River, 7 for North Han River and 15 for South Han River) measured from 1989 to 2007.
The results of the trend analysis indicated that, on the whole, the BOD concentration showed a downward trend at more than 67% of the monitoring stations (9 for Main Han River, 6 for North Han River and 9 for South Han River). However, the COD concentration showed an upward trend at more than 78% of monitoring stations (8 for Main Han River, 7 for North Han River and 13 for South Han River).
This supports the conclusion that a water quality management plan for the Han River improves its water quality, especially as indicated by the decrease in BOD concentration caused by dissolved organic matter. The upward trend of COD, contrary to the BOD trend, indicates that there has been increase of recalcitrant organic matter in the Han River water which could not be detected as BOD.