Since water quality has been deteriorated in water supply sources, need for advanced drinking water treatment increases for safe drinking water supply. However, the advanced treatment of water, which requires large capital, would not be effective if the treated water is contaminated in distribution systems. In recent time, internal corrosion in water pipes is one of the major contamination sources of tap water. It causes unpleasant color,1) and metal release that results in public distrust with tap water.2)
Internal corrosion in distribution net works has a close relation with the quality of water flowing through the pipe. There are indexes to evaluate the corrosiveness of water that takes pH and alkalinity into consideration. Hence, chemicals including as CaCO3 are frequently used to increase the level of those parameters for the control of internal corrosion. However, it is also well known that other water parameters, such as acidity, residual chlorine, chloride, sulfate, dissolved oxygen (DO) and water temperature highly influence the corrosion of water pipes.3)
Among them, DO mainly plays a role as an electron acceptor in oxidation and reduction reaction in water pipes. Seo
Considering the above points, this study tried to investigate the effect of DO concentration on the internal corrosion of water pipes in laboratory- and pilot-scale experiments for both flow and stagnant water conditions. In the pilot-scale experiment, de-oxygenation system with a membrane module was used for the continuous supply of de-oxygenated water.
A series of weight loss experiment was carried out in 300 mL of airtight flasks to investigate the effect of water quality parameters, mainly DO on the corrosion of water pipes. Carbon steel pipe (CSP), ductile cast iron pipe (DCIP), and galvanized steel pipe (GSP) were selected for the experiment. Each pipe was cut to 3 cm in length. Then, the specimens were added to the airtight flasks containing 300 mL of water. The DO concentration of the water was controlled at 2±0.5 and 9±0.5 mg/L. Other water parameters, such as hardness, the concentration of chloride ion, and pH level were also controlled as shown in Table 1. The chloride ion and calcium carbonate were used as corrosion enhancing and corrosion prevention agents, respectively.
The specimens were taken out every week, and they were dried in an electric oven at 100 ℃ for 24 h. Then, they were placed at a desiccator until the weights of the specimens became constant. After that, the weight loss of each specimen was measured to estimate the corrosion rate of each pipe for 10 weeks. Duplicative experiments were conducted for all weight loss experiments.
2.2. Configuration of Simulated Loop System
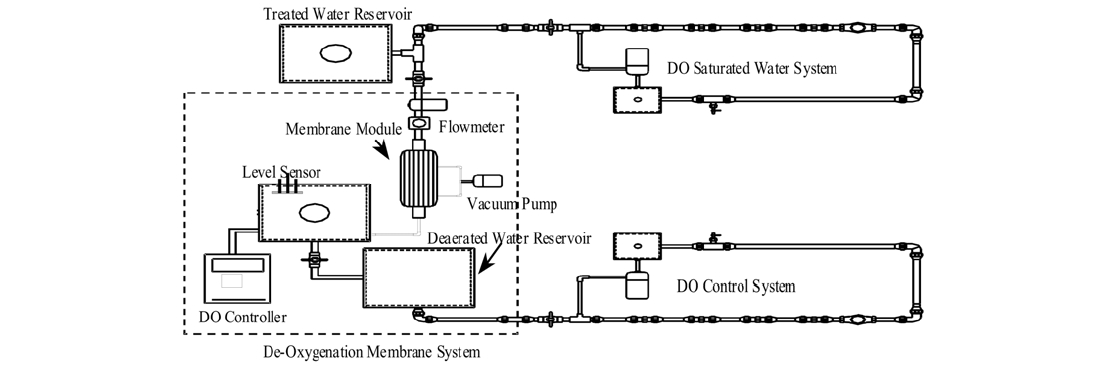
Simulated loop system was installed as a pilot plant in the Bansong water treatment plant of Changwon, Korea. As shown in Fig. 1, this simulated loop system was divided into two lines with and without the control of DO. In addition, each line consists of three different loops in parallel. A de-oxygenation membrane module (Code No. MHF304KM) was used to reduce DO concentration to approximately 2 mg/L in line of DO control. DO concentration in the uncontrolled line was maintained at approximately 9 mg/L. The concentration of DO was reduced using a de-oxygenation membrane module that was utilized under the vacuum pressure of 730 mmHg. The de- oxygenation membrane showed 2.4 m2 of surface area, 1 L/min of passing flow rate, and <3.0 kg/cm2 of operating pressure. In this experiment water temperature was not controlled.
The pipes used for this experiment were GSP, CP, and SSP. Four coupons were installed at each loop system, and one coupon was taken out once a month.
The change of color and scale formation on the inner surface of pipe coupons were monitored. Scale was taken from the inner surface of pipes, and then it was dried immediately. The dried scale was analyzed to identify the components of corrosion byproducts by X-ray diffraction (XRD) method using Philips’ X’Pert System. Sample water for each loop was taken every 48 hours and analyzed to determine metal release rate: Zn for GSP, Cu for CP, and Cr and Fe for SSP using atomic absorption analyzer (Shimadzu; AA-6701F).
The effect of DO on the corrosion of water pipes is clearly shown as summarized in Table 2. With pH 6, and 15 mg/L of chloride ion, the corrosion rate of DCIP for initial one week was estimated to be 6.54±0.53×10⁻¹ mg/cm2/d at DO concentration of 9±0.5 mg/L. It was significantly reduced to 1.81±0.33×10⁻¹ mg/cm2/d when DO was controlled at 2±0.5 mg/L under the same background conditions. Similar results were observed for
[Table 1.] Experimental conditions for weight loss experiment
Experimental conditions for weight loss experiment
[Table 2.] Initial corrosion rate of pipe materials by DO concentration
Initial corrosion rate of pipe materials by DO concentration
CSP and GSP. Corrosion rates for GSP, CSP, and DCIP were decreased to 72%, 75%, and 91% by reducing DO concentration from 9±0.5 mg/L to 2±0.5 mg/L, respectively.
After 10 weeks of experiment, the corrosion rate of DCIP was measured to be 2.05±0.36×10⁻¹∼4.73±0.21×10⁻¹ mg/cm2/d at 9±0.5 mg/L of DO concentration, and it was reduced to 6.26± 0.57×10⁻²∼2.46±0.35×10⁻¹ mg/cm2/d by reducing DO concentration to 2±0.5 mg/L regardless of any other parameters. Similar results were observed for CSP and GSP too. This result clearly implies that DO significantly influence the corrosion properties of water pipes as expected. In DCIP, red rust (ferric oxide) was visually observed on the surface of DCIP in the condition of 9±0.5 mg/L of DO after 10 weeks of experiment.
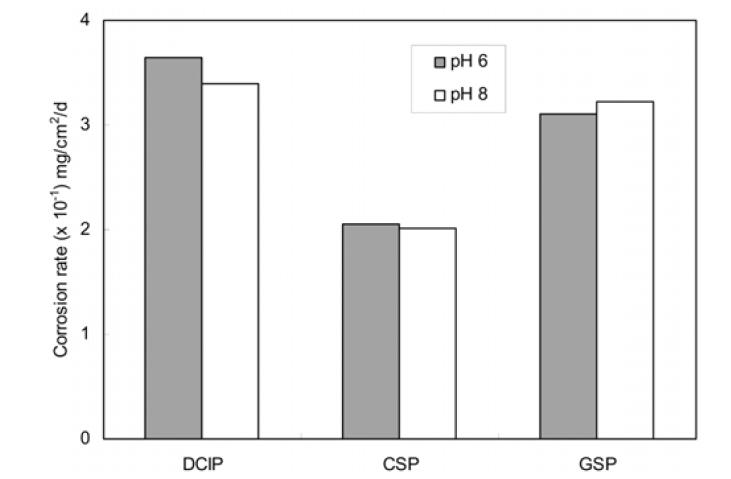
Since pH is related with the formation of scale on the internal surface of water pipe and metal solubility in water,7) pH adjustment has been used as a corrosion control strategy of water pipes. The level of pH was controlled at 6 and 8, because the pH level of drinking water quality standard is the range of 5.8 and 8.5. The effect of pH level was not significant in this experiment as shown in Fig. 2. This result seems that the stability of metallic pipes is situated in the same corrosion area in the potential-pH diagram under the pH conditions.
Under the condition of DO 9 mg/L, pH 8, and 20±2℃, hardness as a corrosion inhibitor was controlled by adding calcium carbonate. Corrosion rates of water pipes decreased as the concentration of hardness increased. For example, the corrosion rate of DCIP was 7.21±0.48×10⁻¹ mg/cm2/d without calcium
carbonate addition; however, it was reduced to 4.72±0.61×10⁻¹ and 4.24±0.39×10⁻¹ mg/cm2/d at the concentration of calcium carbonate of 40 and 80 mg/L, respectively after initial one week of experiment. This result is because calcium carbonate deposited in the interface of pipe surface and water. The deposition layer played a role to hinder the electrochemical reaction between metallic pipes and water. The similar phenomena were observed for CSP and GSP. However, the continuous injection of calcium carbonate would result in the formation of thick scale in the metallic pipes, which cause serious increase of pressure.
Usually chloride ion acts as a corrosion enhancing agent of the metallic pipes in water. The enhanced corrosion was observed as the chloride concentration increased to 75 and 150 mg/L in the experiments, under the condition of DO 2±0.5 mg/L, pH 6 and 20±2℃. The corrosion rates for DCIP, CSP, and GSP were in the range of 2.61±0.4×10⁻¹∼2.63±0.21×10⁻¹ mg/cm2/d, 1.20±0.19×10⁻¹∼1.21±0.44×10⁻¹ mg/cm2/d, and 1.87±0.24×10⁻¹∼ 2.39±0.33×10⁻¹ mg/cm2/d, respectively.
It is clearly observed that the effect of DO on the limitation of corrosion was much greater than other water parameters, such as hardness, chloride ion, and pH level.
The simulated loop system was constructed to mimic the condition of real water pipes with flow. A membrane system was added to the loop system to remove DO concentration, and the loop system was set up at water treatment plant. During the experiment, no chemical was added, and water temperature was not controlled.
3.2.1. Metal Ionization
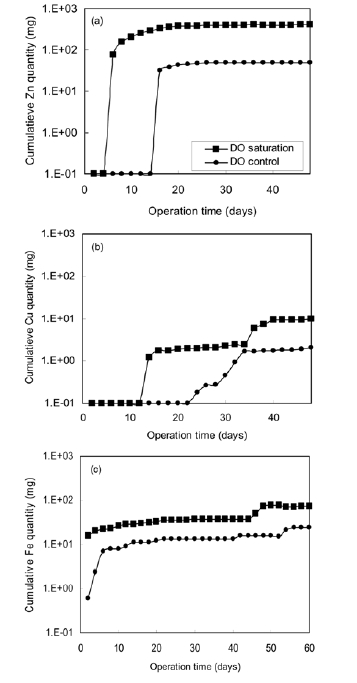
Fig. 3(a) shows the accumulated amount of zinc ion released from GSP during the operation period. The accumulated quantity increases linearly to 360 mg with exposure time for two weeks in DO saturation system. After that, the amount of zinc ion slightly went up to 400 mg after 46 days. In DO controlled system, no zinc ion was detected for 14 days. After 14 days of operation, the amount of zinc ion increased to 50 mg.
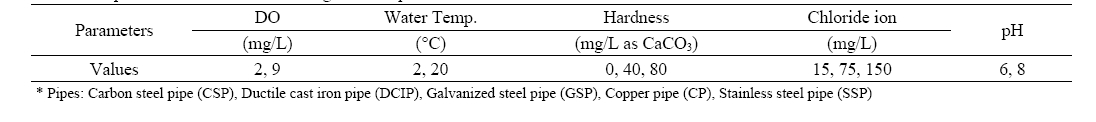
Fig. 3(b) and Fig. 3(c) are experimental results of metal release from CP and SSP, respectively. Since these pipe materials are relatively anti-corrosive, the release of metal ion was not significant compared to GSP. However, the release of metal
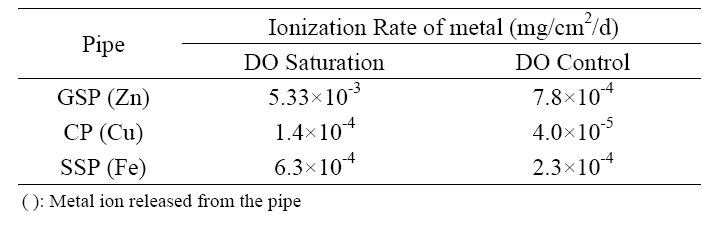
ions from these anti-corrosive pipes was also strongly affected by DO control. As given in Table 3, the average ionization rate of zinc was reduced from 0.00533 to 0.00078 mg/cm2/d by DO control for GSP. The reduction of metal ionization rate for CP and SSP was 71.4% for Cu and 63.5% for Fe, respectively.
[Table 3.] Average ionization rates of water distribution pipes by DO control

Average ionization rates of water distribution pipes by DO control
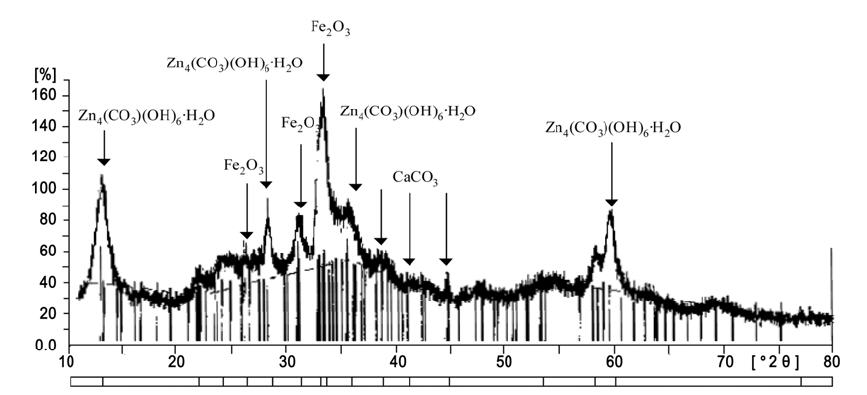
3.2.2. Analysis of corrosion products
The scale formed on the inner surface of water pipes was analyzed using XRD method to identify corrosion process. Since approximately 3.5 times more scale was formed on GSP compared to CP and SSP, the XRD analysis was only done for the scale in GSP. Different types of scale formation were observed between with and without DO control cases. A porous and soft scale was formed at the GSP loop where DO was saturated. This kind of scale appeared to be generated by consistent oxidation reaction on the surface, and it was easily dissolved in water. On the other hand, dense and compact brownish color scale was observed for DO control system, and it was not easily dissolved in water. Fig. 4 shows the result of XRD analysis for the scale in DO control system. It consists of various complex formations, such as zinc carbonate hydroxide[Zn4(CO3)(OH)6? H2O], hematite[Fe2O3], and calcite[CaCO3]. It is well known that the zinc carbonate hydroxide is a long-term stable compound and calcite is the most stable form of calcium carbonate.8) The formation of such compounds is the major reason to prevent the pipe corrosion at lower DO concentration in water.
Although sufficient scale was not formed to analyze the composition of corrosion products for CP and SSP, it was possible to evaluate the corrosion process of CP by the visual observation of pipe surface. Light brown and/or blue green color appeared on the surface in DO controlled system, which meant that copper oxide formed on the surface was cuprite (Cu2O). This is very stable and forms in a thin and nearly continuous layer,9) and this protects the inner surface of the pipe. On the other hand, dark brown and dark blue that stand for cupric oxide were observed in DO saturation system. Cupric oxide could be developed when an electron acceptor (i.e., DO) was sufficient in drinking water.
From the experimental investigation, it was found that DO is the most critical parameter on the corrosion of metal pipes. Internal corrosion of water pipes could be effectively prevented by reducing DO concentration. Especially the clear reduction of corrosion rate for DCIP, GSP and CSP was obtained by DO control during the initial one week in weight loss experiment. For example, corrosion rates for GSP, CSP, and DCIP were decreased to 72%, 75%, and 91% by reducing DO concentration from 9±0.5 mg/L to 2±0.5 mg/L. In the pilot scale experiment, the average ionization rate of zinc decreased from 0.01252 to 0.001308 mg/cm2/d for GSP by DO control. The reduction rate of ionization was 71.4% for Cu and 63.5% for Fe for CP and SSP, respectively. Dense and stable compounds, such as Zn4(CO3)(OH)6?H2O, Fe2O3, and CaCO3, were formed on the inner surface of GSP in DO control system. The corrosion products on the surface of CP was appeared as light brown and/or blue green color which meant that cuprite was formed in DO control system, whereas dark brown and dark blue that stand for cupric oxide were observed in DO uncontrol system.