Vehicle cabins have recently received a great concern associated with a potential microenvironment that can result in elevated health risk from personal exposure to many toxic trafficrelated pollutants. Several recent studies1-3) have identified that individuals inside vehicles are exposed to elevated levels of nitrogen oxides, polycyclic aromatic hydrocarbons (PAHs), monocyclic aromatic hydrocarbons (MAHs), or other volatile organic compounds (VOCs) when compared to the corresponding ambient air at nearby monitoring sites. In particular, naphthalene is the most prevalent one among PAHs emitted from motor vehicles.4-6) Since naphthalene is present as a vapor under typical atmospheric conditions, it has been prevalent in various indoor environments.7-9) Naphthalene has been known to have various adverse effects on human health. A long-period inhalation expo-sure to naphthalene may cause kidney and liver damage, retinal damage, and central nervous system damage.10) Exposure to high concentrations of naphthalene can damage or destroy some of the red blood cells, thereby causing hemolytic anemia.10) Some symptoms of hemolytic anemia include fatigue, lack of appetite, restlessness, and change in skin color. Since inhalation of naphthalene has caused cancer in animal tests, this compound has been classified as possibly carcinogenic to humans.10,11)
In addition, MAHs such as benzene, toluene, ethyl benzene and xylene (BTEX) are other important vehicle-related pollutants. 1-3) These MAHs have been added to gasoline in order to increase octane ratings in gasoline.12,13) Meanwhile, according to the Korean Petroleum Corporation, the gasoline manufactured by all five Korean petroleum companies contains 30 to 35% BTEX by volume, including to 1 to 3% benzene. Most MAHs are toxic (e.g. benzene) or potentially toxic to humans (e.g. toluene, ethyl benzene, and xylene).11,14,15) For instances, benzene is a known carcinogen such as leukemia,11,14) and toluene is neurotoxic.15)
Exposure data are needed in order to properly link environmental exposure to health effects. The hazardous or toxic characteristics of MAHs and PAHs warrant the estimation of invehicle exposure to relate exposures to adverse health effects. Although several in-vehicle studies measured VOC levels in the interiors of gasoline-fueled passenger cars and diesel-fueled public buses,1-4) only limited information is currently available in scientific literature on levels of PAHs and MAHs inside diesel-fueled passenger cars. Consequently, the present study was conducted to measure and compare the levels of both MAHs (BTEX) and a PAH (naphthalene) inside diesel- fueled and gasoline-fueled vehicles.
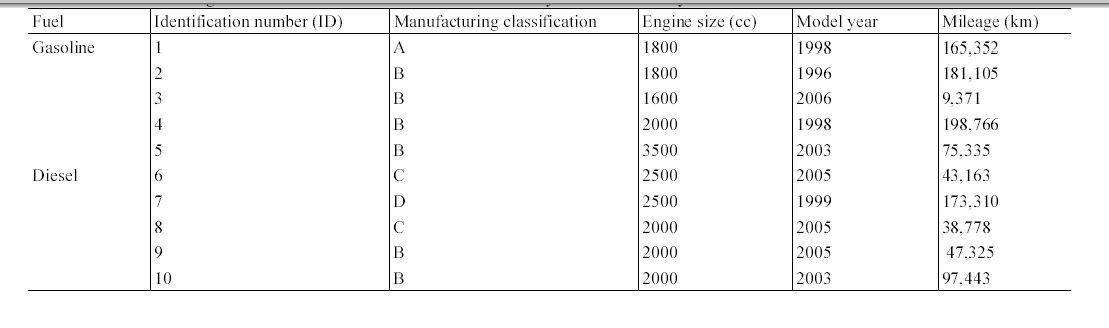
A series of experiments was conducted to measure the concentrations of one PAH (naphthalene) and five MAHs (benzene, toluene, ethylbenzene, and m,p-xylenes) inside gasoline-fueled and diesel-fueled passengers cars. The sampling was conducted during morning and evening commuting hours in standard weekdays (Monday through Friday), between March and June, 1997. A total of 10 actual passenger car commuters were recruited for this study. The commuters were equally classified into two groups (five drivers of gasoline-fueled and other five drivers of diesel-fueled passenger cars). None of car size, car type and model year were controlled for the selection of test cars. Information on the test cars is shown in Table 1. All the passenger cars were equipped with electronic fuel-injected engines, used unleaded gasoline fuel or diesel fuel, and were apparently functioning normally during the entire experimental period. Each car was sampled twice (morning and evening) in a single sampling day. One criterion of the commuter selection was the travel time, between 30 and 60 min for a one-way commute, which was determined during the interviews for participants. The drivers were graduate students or faculty members at Kyungpook National University. The samples were collected by a trained technician in the passenger seat. The commute routes were real rather than hypothetical. The windows and vents of the passenger cars were kept closed for most of the sampling time, with the temperature level and blower speed set to the personal comfort level of the occupants. To prevent any interference from tobacco smoke, the participants of this experiment were asked not to smoke during sampling.
A constant-flow sampling pump (A.P. Buck Inc. Model I.H ) was connected to a 1/4" stainless steel sorbent trap containing 0.3 grams of Tenax. The sampling pump was calibrated by a mass flow meter prior to and following the collection of each sample. For personal air sampling a pump (A.P. Buck Inc. Model I.H) and cartridge were carried by each subject with the inlet of the sample cartridge located within the subject’s breathing zone. A sampling vest was designed to provide for this location and minimize any inconvenience for the participant during sampling. The flow rate was set at a nominal flow rate of 100 mL/min. This flow rate was used as the sample flow rate in all the volume calculations. Sampling duration was between 30 and 60 min. No samples departed more than 10% from the initial flow rate during this study. The sample volume was determined based on the expected concentrations relative to each experimental condition.
Naphthalene and BTEX collected on the Tenax Traps were analyzed by coupling a thermal desorption system (TD T1, Donam Instrument Inc.) to a gas chromatograph (GC, Hewlett Packard 5890) within 3 days of collection. First, the collected pollutants were thermally desorbed and then transferred to the GC. Next, the target compounds were separated into fractions using a highresolution capillary column (Supelco Co. SPB-5) and analyzed by a Flame Ionization Detector. The identification of each compound was confirmed using its retention time. The quantification was based on multipoint external standard curves.
The quality control included laboratory and field blank traps, spiked samples, and duplicate measurements. Two blank traps were analyzed daily along with an external standard check of the performance of the entire analytical system. The method detection limits ranged from 0.4 to 1.7 μg/m3 for the target compounds. The mean relative standard deviations calculated from the duplicate samples were less than 20% for nearly all the target compounds.
3.1. Gasoline-Fueled Vehicles vs. Diesel-Fueled Vehicles
[Table 1.] Information on gasoline-fueled and diesel-fueled vehicles surveyed in current study

Information on gasoline-fueled and diesel-fueled vehicles surveyed in current study
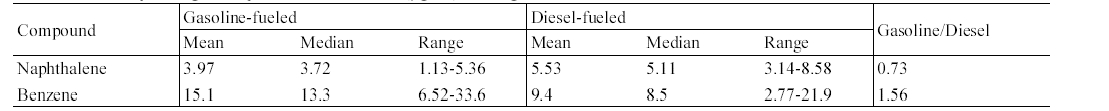
The concentrations of target compounds measured inside gasoline-fueled and diesel- fueled vehicles were summarized in Table 2. An analysis of variance test showed that the in-vehicle concentrations of MAHs measured inside gasoline-fueled vehicles were significantly higher for those of diesel-fueled vehicles, whereas the result was reverse for the PAH, naphthalene. The median concentration ratios of gasoline-fueled vehicles to dieselfueled vehicles ranged from 1.50 to 1.75 for MAHs, while the ratio was 0.54 for naphthalene. The pattern of higher levels in gasoline-fueled vehicles than in diesel- fueled vehicles may be explained by the fuel type. The gasoline fuel contains much more MAHs compared with diesel fuel,12) the interior of the diesel-fueled vehicles would be influenced by the roadway air levels only, while the interior of gasoline-fueled vehicles would be influenced by the engine running loss emissions as well as roadway air levels. This would result in the higher levels in the interiors of gasoline-fueled vehicles. In addition, two previous studies2,16) have indicated that the lower the height of the vehicles, the higher the compound concentrations encountered on roads, resulting from the vertical gradient of the compound concentrations. This would also result in the higher levels inside gasolinefueled vehicles as compared to the levels inside diesel-fueled vehicles.
In contrast to MAHs, the median concentration of naphthalene was significantly higher for the diesel-fueled vehicles, as compared to that for gasoline-fueled vehicles (Table 2). This result might be due to the difference in motor vehicle emissions of naphthalene between the two vehicle types. Since naphthalene was more predominant in diesel fuel than in gasoline fuel,17,18) its entrance with other unburned fuels into the interiors of vehicles would be greater in diesel-fueled vehicles, thereby resulting in elevated in- vehicle naphthalene levels. Furthermore, naphthalene is formed by the conversion of 2- methylnaphthalene, increasing increasing the naphthalene levels in motor vehicle exhaust.17) As a result, naphthalene would be emitted at greater levels from diesel- fueled vehicles than from gasoline-fueled vehicles and in turn, it would penetrate into the interiors of vehicles in themselves that emitted naphthalene through the exhaust pipes.
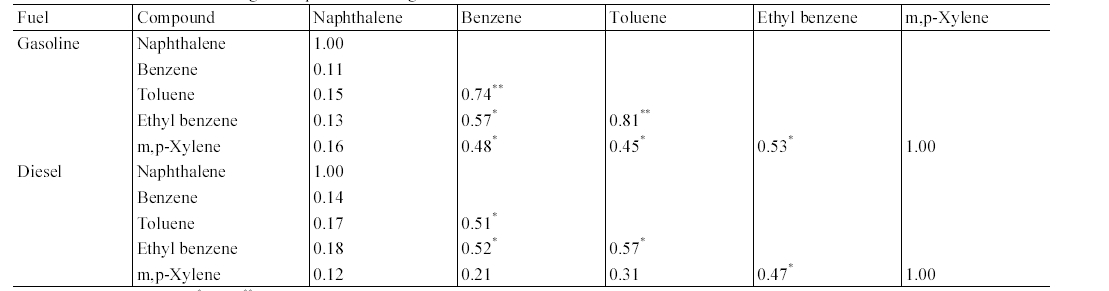
The results of correlation analysis between target compounds measured from gasoline- fueled and diesel-fueled vehicles are presented in Table 3. This correlation analysis was conducted in order to predict if there are any common sources for the target compounds. For both the gasoline-fueled and diesel-fueled vehicles, MAHs exhibited strong correlation among themselves, although less correlations were observed between m,p-xylene and benzene or toluene. In contrast, the PAH, naphthalene did not present any correlation with MAHs. As such, the sources and sink mechanisms for naphthalene are different from those for MAHs.6)
3.2. Intra-comparison of Gasoline-Fueled Vehicles and Diesel- Fueled Vehicles
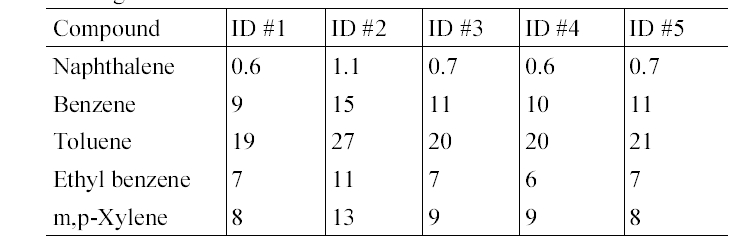
Table 4 presents the in-vehicle median concentrations of target compounds measured inside individual gasoline-fueled vehicles. It was notable that for all target compounds, the highest median in-vehicle concentrations were measured inside vehicle ID #1. For this vehicle, relatively higher variation in the concentrations of the target compounds was observed (Table 5). Furthermore, as shown in Table 2 and 5, it was found that the maximum values measured inside gasoline-fueled vehicles were obtained from vehicle ID #2. The vehicle ID # 2 was the oldest one (model year, 1996) among the test gasoline-fueled vehicles, with a mileage of 181,105 km (Table 1). This vehicle had the second longest mileage after vehicle ID #4 (model year, 1998). As such, model year would more influence the in-vehicle levels, as com

ummary of target compound concentrations (μg/m 3 ) inside gasoline-fueled and diesel-fueled vehicles
[Table 3.] Correlation matrix of target compounds inside gasoline-fueled and diesel-fueled vehicles

Correlation matrix of target compounds inside gasoline-fueled and diesel-fueled vehicles
pared vehicle mileage. This in-vehicle concentration difference may have been mainly caused by the penetration of more engine running loss emissions into the older vehicles compared to the newer vehicles, due to the lower combustion efficiency of the gasoline in the older vehicles.19) Another possible cause for the difference is the malfunctioning of vehicle ID #2, although the maintenance history of this vehicle was not known.

In-vehicle median concentrations (μg/m 3 ) of target compounds in five gasoline- fueled vehicles
The in-vehicle median concentrations of target compounds measured inside individual diesel-fueled vehicles are shown in Table 6. Unlike the gasoline-fueled vehicles, the in- vehicle concentrations were not significantly different among individual diesel-fueled vehicles. For example, the naphthalene concentrations were ranged only from 1.2 to 1.4 μg/m3. Accordingly, the mileage, engine size or model year would not be major parameters for the in-vehicle levels for the diesel-fueled vehicles.
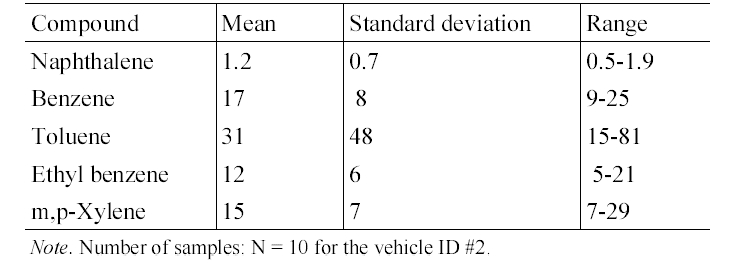
Summary of concentrations (μg/m 3 ) of target compounds inside a gasoline- fueled vehicle (ID #2)
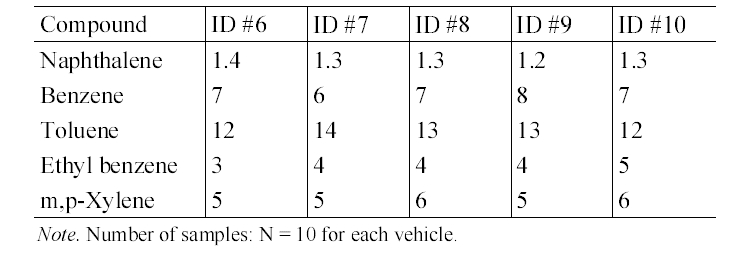
In-vehicle median concentrations (μg/m 3 ) of target compounds in five diesel- fueled vehicles
3.3. Comparison with Other Microenvironments
Table 7 presents the mean concentrations inside vehicles measured in the present study and those of other microenvironments reported by previous studies. The mean in- vehicle MAH concentrations for both the gasoline-fueled and diesel-fueled vehicles were higher than the landfill site mean concentrations measured at Seoul area20) or outdoor mean concentrations measured in Seoul,21) Birmingham, UK,22) Munich, Germany,23) and Daegu.24) In addition, the mean in-vehicle naphthalene concentrations for the diesel-fueled vehicles were much higher than those for outdoor and indoor air in Birmingham, UK22) and in Chicago, USA.7) Even the mean in- vehicle naphthalene concentrations for the gasoline-fueled vehicles were higher than those for outdoor and indoor air in Chicago, USA and for outdoor air in Birmingham, UK, although they were similar to the indoor naphthalene concentration measured in Birmingham, UK. As such, it is suggested that vehicle interior is an important microenvironment associated with the individual exposure to as naphthalene as well as MAHs. Meanwhile, since all necessary information for the measurements of MAHs in Rome was not provided,25) the reason is not clear why the outdoor MAH concentrations measured in Rome, Italy were higher than those of other countries and in turn, they were similar to the concentrations measured inside gasoline-fueled vehicles. Nevertheless, a possible explanation is that the difference would be a reflection of the combined effects of such driving parameters as vehicle type, driving route, driving period,
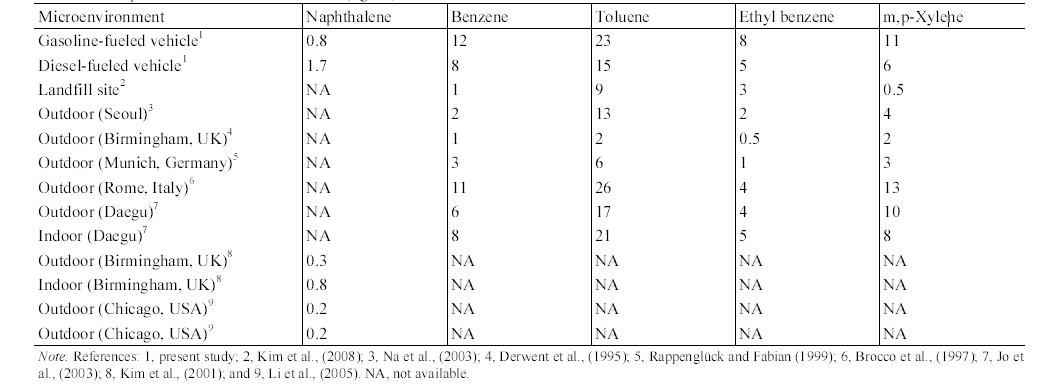
Comparison of mean concentrations (μg/m 3 ) inside vehicles with those of other microenvironments
vehicle ventilation, driving speed, traffic load, and fuel composition, and regional environmental conditions such as temperature and dispersion or turbulence variability.19)
The present study was conducted to measure and compare the levels of both MAHs (BTEX) and naphthalene as a representative of PAHs inside both diesel-fueled and gasoline-fueled vehicles. It was found that the in-vehicle naphthalene levels were higher for the diesel-fueled cars as compared to gasoline-fueled cars, whereas the results were reversed for the in-vehicle MAH levels. There was no significant difference of both naphthalene and MAHs between the diesel-fueled cars, but the in-vehicle levels were significantly different between gasoline-fueled cars. Meanwhile, it is noteworthy that the concentration levels of both naphthalene and MAHs were higher in the passenger cars than other non-industrial microenvironments. Consequently, it was confirmed that the cabins of both diesel-fueled and gasolinefueled passenger cars are an important microenvironment associated with the exposure to naphthalene and MAHs.