The fossil fuel as energy source had been used without any concern by mankind until they faced global issues of climate change such as global warming, smog and acid rain that resulted in a keen attention on the environmental issues and tightening regulation on the exhaust gas. In case of gas fuel exhaust, nitrogen oxide (NOx) is required to be decreased as there is almost no sulfur oxide nor particles. In a normal burner 95% of nitrogen oxide is emitted in the form of NO, which combines with oxygen in the air to be NO2. This nitrogen oxide not only reacts with solar ultraviolet and particles in the air that causes photochemical smog, which is harmful to human body, but melts into moistures in the air to become nitric acid that causes acid rain.1,2)
The method to control the generation of NOx is applied to the mechanism to restrain combustion, and so these are adverse to each other because the latter causes lots of CO and particle generation.3) Therefore it is required to develop a technology to control the generation of both unburned particles, which affects stability of flame4) and combustion efficiency, and NOx. The technology of external oscillation5,6) is adopted to cope with those problems. It is known that the application of external oscillation on flame promotes the intensity of turbulent flow and the adjacent flow field to accelerate transfer of heat, mass and momentum, and hence increases the stability of flame and combustibility.
In this study, an externally oscillated burner including conventional fuel staging for NO reduction, was developed. The parameters of oscillation frequency, sound pressure and air ratio were studied to know optimal operation condition.
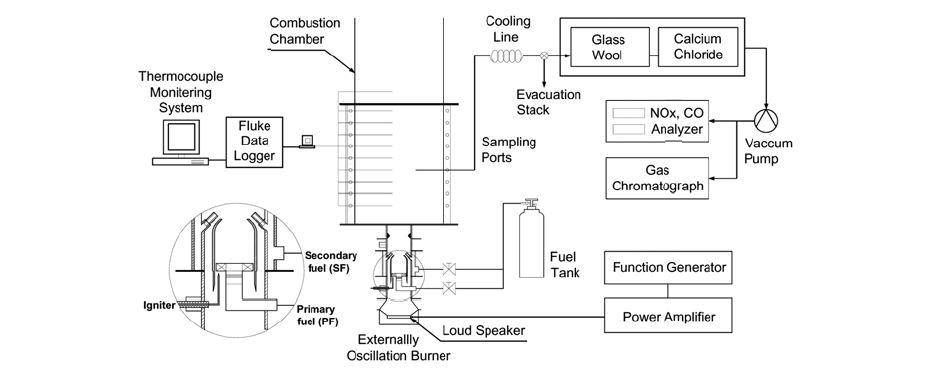
The experimental setup for this study is shown in Fig. 1. The setup consists of external oscillation burner, oscillating system, fuel supply line, and measurement and analyzing system.
The external oscillation staging burner was designed and made. A swirler was installed to promote the mixing of fuel and air, and then to secure stable flame. The cylindrical combustion chamber, measuring 350 mm in diameter and 900 mm in length, was insulated by 50 mm-thick blocks to minimize external influences. 11 measuring ports were installed for temperature measurement and exhaust gas sampling. A cylindrical oscillation chamber was installed at the bottom of burner with a loud speaker capable of maximum output of 200 W and frequency
range 60-6,000 Hz to produce periodic wave. The sine signal from function generator (Agilent 33250A, Agilent technology) is amplified by power amp (AMP 2000, ASSA).
CNG (Compressed Natural Gas) was used as fuel, the main element of which is methane. A flow meter with a regulator was installed to control flow rate. The primary fuel (PF) is supplied from the fuel supplying line, and the secondary fuel (SF) is directly injected to flame by four 2 mm-diameter nozzles in the staging burner.
The measurement and analyzing system were divided into exhaust gas sampling line and temperature measuring line. The exhaust gas sampling line consists of sampling ports, sampling probe and line to analyzers. Triply-tube water-cooling system was applied in the line to maintain the sampling state by preventing the highly reactive radicals in the combustion gas from continuously reacting in the hot sampling probe. Nondispersive Infrared gas analyzer (ZRF, California analytical inst) and GC (14B, SHIMADZU) were measured for NO and CO, respectively. The temperature measuring line consists of a thermocouple (K-type, Ø=0.3 mm) and a data analysis system (Hydra Data Logger 2625A, FLUKE).
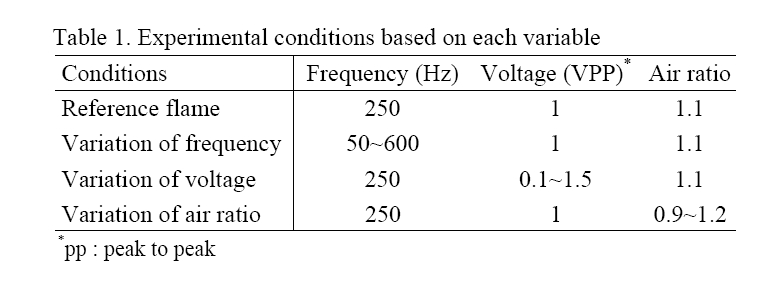
Experiments were conducted on combustion with such variables as frequency, sound pressure (i.e., Voltage) and air ratio. For all the parametric tests, the distribution ratio between primary and secondary fuel was set at 8:2. Through above parametric screening study, the reference flame was decided at optimum condition for lowest NO emission and highest combustibility. Particularly at this reference flame condition, the test was made in details to know the NO reduction mechanism and high combustibility. The experiment conditions based on each variable are shown in Table 1.
[Table 1.] Experimental conditions based on each variable

Experimental conditions based on each variable
3.1. NO Reduction in Reference Flame
The reference flame is the optimal condition which has highest NO reduction and combustibility, while applying oscillation after fuel staging. The variable conditions were taken as frequency of 250 Hz, sound pressure of 1 VPP and air ratio of 1:1 as shown in Table 1.
Dimensionless axial distance (L/D) is the variation of axial distance (L) versus chamber diameter (D) ratio, and dimensionless radial distance (r/R) is the variation of radial distance (r) versus chamber radius (R) ratio.
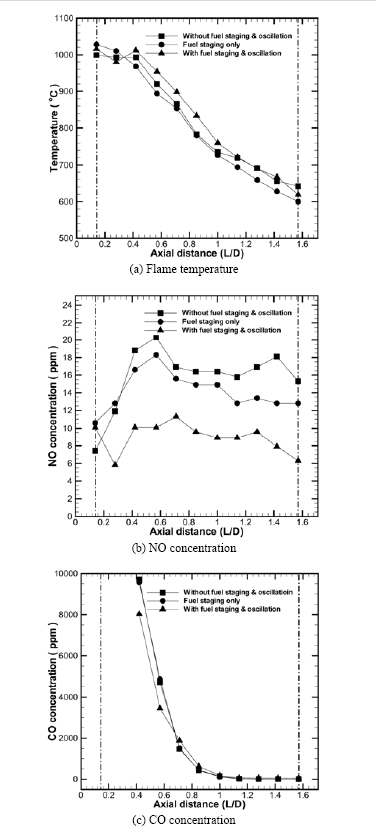
Fig. 2 shows the variation in flame temperature and concentrations of NO and CO along to the vertical axis at burner center. The experiments were conducted without both fuel staging and external oscillation, with fuel staging only, and with both fuel staging and external oscillation, in order to study the influence of external oscillation and/or fuel staging.
Fig. 2(a) shows the comparison on temperature in accordance with axial distance. External oscillation promotes the mixing of fuel and air to increase the combustibility and flame temperature. However as flame shortens with oscillation, it can be recognized that the temperatures are almost similar at longer than flame length of L/D ratio of 0.11. Fig. 2(b) shows the comparison on NO concentration according to different type combustion. Not like fuel staging that reduces NO concentration slightly, external oscillation reduces NO concentration significantly. NO concentration decreased by 58.8% at L/D ratio of 0.15, near outlet, with the addition of external oscillation. This is because the local high temperature region in flame was eliminated by external oscillation, and the flame shortened by acceleration of mixing, resulting in short residence time of combustion gas in flame.7) Fig. 2(c) shows the comparison on CO concentration according to axial distance. The concentration with external oscillation is lower than that of without external oscillation near the burner. This explains that, as shown in Fig. 2(a), external oscillation accelerates mixing to increase temperature and hence improves combustibility to decrease CO, which is generated by incomplete combustion.
Consequently, it was noticed that external oscillation supported NO reduction and maintenance of high combustibility. The reduction mechanism can be explained as follows; external oscillation in flame accelerates the transfer of heat, mass and momentum to improve combustibility. Also, the maximum temperature region in flame decreases, and the residence time of combustion gas in the maximum temperature is reduced, and then the thermal NO should be decreased. Therefore, high NO reduction and combustibility can be obtained simultaneously by external oscillation.
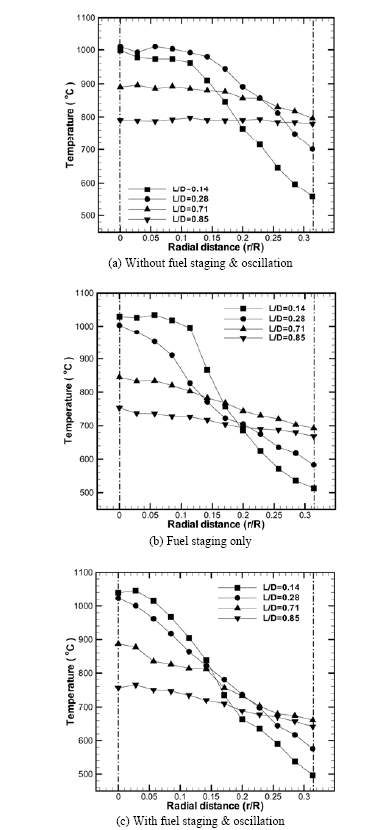
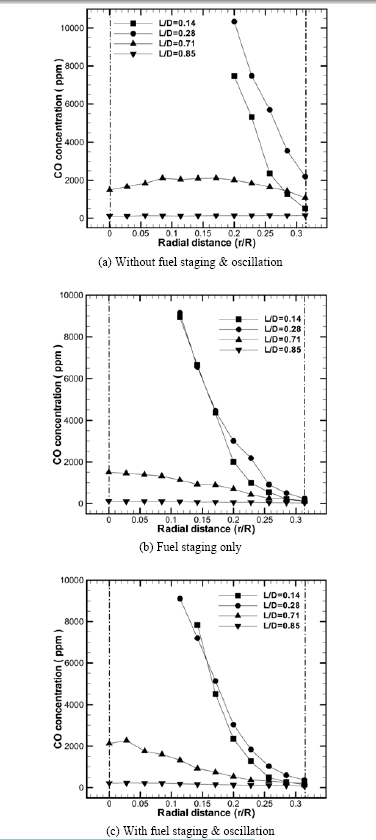
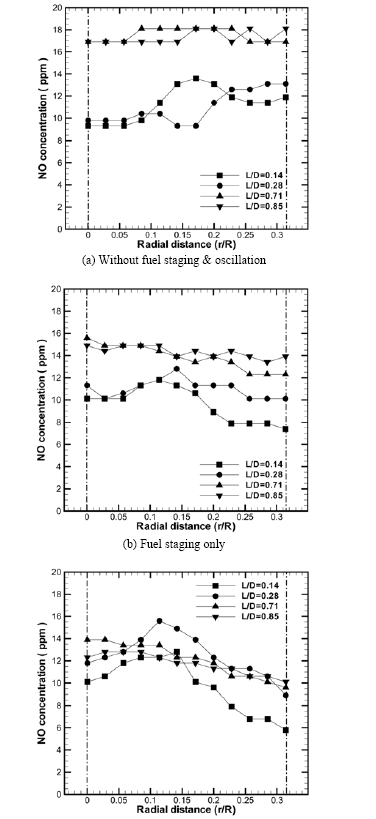
Figs.3,4 and 5 present the variation in flame temperature and NO and CO concentrations. The experiments were conducted on radial distance with four different L/D ratios of 0.14, 0.28, 0.71, and 0.85.
Fig. 3 shows radial temperature distribution according to different flame type. The greater L/D value means the less temperature changes due to the longer distance from burner. In case of small L/D, temperature changes significantly along the radial distance. Though the high temperature region is formed in L/D value of 0.057 range as shown in Fig. 3(a) and 3(b), the external
oscillation eliminates the local high temperature region as shown in 3(c). A decrease of thermal NO can be expected from this temperature distribution.
Fig. 4 is the comparison on NO concentration. The NO concentration is higher at bigger X/D value without fuel staging and oscillation in Fig. 4(a). But the NO concentration decreases with fuel staging or external oscillation as can be seen in Figs. 4(b) and (c). This is because flame shortens and combustion gas stays less in high temperature flame, resulting in high NO reduction.
Fig. 5 is the comparison on CO concentration. At near burner (L/D=0.14, 0.28), CO production is high in the center of flame due to incomplete reaction which passes through combustion chamber. But at near outlet (L/D=0.85), CO concentration decreases significantly due to complete reaction with remaining excess oxygen. External oscillation accelerates the mixing of fuel and air to be reduced CO which is clearly shown at the flame front of L/D value of 0.1.
3.2. Parametric Screening Studies
Experiments were conducted on such variables as oscillation frequency, sound pressure and air ratio that are expected to affect combustibility and NO generation with fuel staying and external oscillation simultaneously. The concentrations were measured at exit (L/D=2.14).
3.2.1. Oscillation Frequency
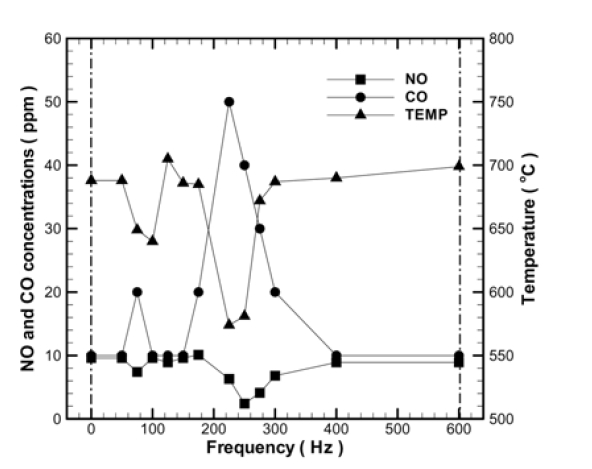
Fig. 6 shows temperature, NO concentration and CO concentration at exit with the variation of oscillation frequency in the range of 0∼600 Hz.
At 250 Hz of frequency, NO concentration and temperature fell down simultaneously and at the same time CO increased drastically. It can be recognized that the burner is greatly affected in this oscillation frequency. External oscillation accelerates the mix of fuel and air resulting in decrease of flame length. Therefore the residence time to generate NO becomes shorter along with the time for reacted gas to stay in high temperature region. That is, the amount of NO decreases with decreasing the local flame temperature. In general, NO and CO have opposite characters each other as can be seen in Fig. 6.
3.2.2. Sound Pressure
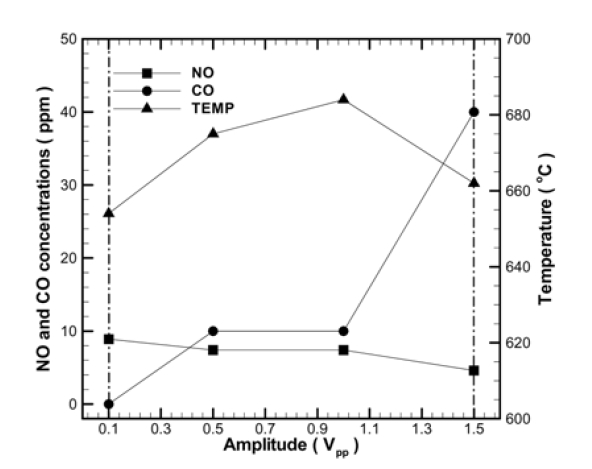
Fig. 7 shows the temperature, NO and CO at exit with fixed oscillation frequency of 250 Hz according to the variation of sound pressure.
When the amplitude of oscillation frequency increased, the NO concentration decreased slightly. In case of low amplitude, the flow field shows periodic repeating flow as in the case of non-resonance frequency. But when oscillation frequency goes high, intensive vortex is generated in turbulence form that induces collision near outlet. Therefore, the length of flame was decreased, resulting in NO reduction. Temperature peaks at 1 VPP though the change according to sound pressure variation was not high.8) CO concentration fluctuates much according to sound pressure due to unstable flame, caused by high sound pressure and amplitude.
3.2.3. Air Ratio
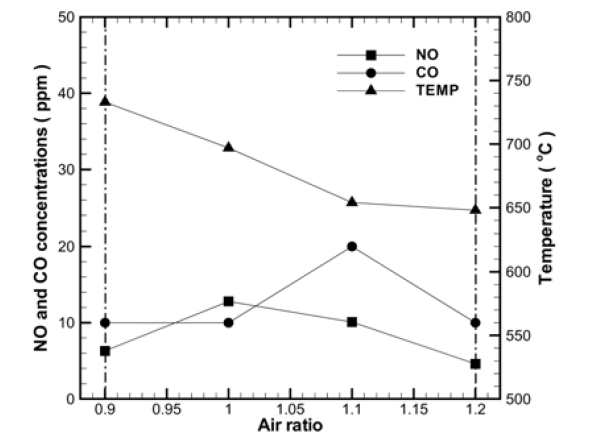
Fig. 8 shows the temperature, NO and CO at exit with fixed oscillation frequency of 250 Hz and oscillation voltage of 1 VPP according to the variation of air ratio 0.9∼1.2.
Temperature decreases as air ratio increases because of the heat loss in exhaust with excessive air. NO concentration shows the same tendency as temperature to be decreased along with increase of air ratio. This explains that the change of NO concentration is more dependent on the temperature drop due to deviation from the theoretical fuel-air ratio in local flame than on increase of oxygen in the air. Little CO is emitted with air ratio of 1 or more.
Experiment was conducted to study the effects of oscillation with a fuel staging. The optimum condition was obtained by experiment on three variables that affect oscillation such as oscillation frequency, sound pressure and air ratio. It was noticed that NO and CO concentrations decreased slightly with fuel staging, and remarkably with additional external oscillation. The mechanism of NO reduction is; when external oscillation is applied into the flame of burner, the transfer of heat, mass and momentum is accelerated to improved combustibility, to reduce the maximum temperature region and to reduce the stay time of combustion gas in maximum temperature that results in decrease of NO concentration.
The following results were obtained through the study on variables. In case of the burner used in this experiment, the effective frequency of 250 Hz had the biggest NO reduction effect. NO decreased according to the increase the oscillation sound pressure though it was not remarkable. NO decreased as the air ratio increased.