Microorganisms and their specific genes can be very informative for environmental monitoring since environmental eco-system is always influenced by microbial population and their fates. Molecular biological methodologies are most commonly used for characterizing diversity and behavior of microorganisms in the environment. Furthermore, molecular biological techniques can be facilitated with monitoring microbial dynamics in operating bioreactors and analyzing variation of microbes at a contaminated site.
Certainly, total genomic DNA extraction from a sample is the first step taken for most molecular biological analysis. And the quantification of target gene by real-time PCR is subsequently conducted in many studies.1-3) Although these molecular biological tools are actively being used by various studies, they have been solely adopted by either comparing DNA extraction methodologies or comparing real-time PCRs.4-7) Comparative investigations employing types of DNA extraction in association with different real-time PCRs have not been significantly carried out. The selection of optimal methodology discretely comparing either among DNA extractions or among real-time PCRs without any related combination may lead to misinterpreting the entire DNA quantification data.
Real-time PCR methods are universally used for quantification on a nominal target DNA.7) There are several methods such as PCR using SYBR green I dye, Taqman, molecular beacons and Quenching Probe (QProbe). Among them, SYBR green I dye and QProbe were chosen for this study. A real-time PCR with SYBR green I dye has been most commonly used. SYBR green I which is DNA binding dye emits a nominal intensity of fluorescence as soon as a double strand DNA is formed throughout PCR.8) In comparison, QProbe is activated by modifying a cytosine base at one of their ends that selectively interacts with a fluorescence dye. When a QProbe binds with a target gene, a fluorescence dye and the guanine base of target gene interlinks each other, resulting in quenching of the magnitude of fluorescence. By monitoring its diminished intensity, the target gene can be quantified by real-time PCR using QProbe or QPrimer.9)
In this study, a comparative investigation adopting types of DNA extraction in combination with different real-time PCR procedures were carried out for reason of the importance to find the way to quantify the accurate amount of target microorganism. That is, three of DNA extraction practices in conjunction with two real-time PCR protocols were compared. For those purposes, total genomic DNA was comparatively extracted from
2.1. Extraction of Total Genomic DNA from E. coli K-12
E. coli K-12 was cultured in a 3 mL of LB broth at 37℃ for 14 hr in an incubator (VS-8480SF, Vision Scientific Co., Korea). It was purely cultured in Luria-Bertani (LB) media followed by DNA purification and then
First, DNA was extracted by employing SDS/Proteinase K where 150 μL of E. coli K-12 culture fluid was transferred to 1.5 mL tube, which was then centrifuged at 14,000 Xg for 1 min. A volume of separated supernatant was then discarded, and the concentrate was re-suspended in a 567 μL of TE (Tris- EDTA, 99%, Sigma, USA) buffer solution. Thereafter, 30 μL of 10% SDS and 3 μL of 20 mg/mL Proteinase K was added and reciprocally hand-mixed. It was incubated at 37℃ for 1 hr and then mixed with 100 μL of 5 M NaCl by using a voltex mixer (KMC-1300V, Vision Scientific Co., Korea). After that, 80 μL of 10% CTAB-0.7 M NaCl was added, which was then incubated at 65°C for 10 min (Dri-Bath, Barnstead, USA). Subsequently, the equal volume of chloroform was added and mixed gently for 20 min. The sample was centrifuged at 14,000 Xg for 5 min, thereafter a supernatant was transferred to a sterilized 1.5 mL tube followed by adding the equal volume of phenol/chloroform (99%, Sigma, USA) and mixed gently for 20 min. The sample was centrifuged again at 14,000 Xg for 5 min, thereafter a supernatant was then poured to a sterilized 1.5 mL tube. A nominal volume of 2-propanol (99.8%, MERCK, Germany) equivalent to 0.6 volume of supernatant was added to the sample where the precipitate was obtained. DNA precipitate was transferred to a sterilized 1.5 mL tube already containing 1 mL of 70% ethanol (99.9%, MERCK, Germany), which was centrifuged at 14,000 Xg for 5 min followed by three rounds of rinsing with 70% ethanol. At last, the amount of ethanol was air-stripped where DNA examined was finally dissolved into 50 μL of TE buffer.
The second protocol for DNA extraction employing magnetic beads was prepared in the same manner as suggested by Compac- Bio Science (Korea)11) while third method for DNA extraction using GTC/silica matrix was implemented as suggested by FastPrep® Instrument (Bio101 system, Q-Bio gene, USA).12) Finally, the amount of extracted genomic DNA was purified with Microcon® Centrifugal Filter Units (Millipore Corporation, USA) followed by subsequent PCR procedures being taken place.
2.2. Determination of DNA Concentration
Quant-iTTM PicoGreen® dsDNA reagent was purchased from Invitrogen (USA), which was used to determine DNA concentration. A 18.9 μL of TE buffer, 0.1 μL of PicoGreen dye and 1 μL of DNA were added into the well plates (Millipore, USA). That is, Quant-iTTM PicoGreen® dsDNA reagent illuminated a nominal intensity of fluorescent (which used for quantification of DNA) when a fluorescent nucleic acid is selectively binding a specific double-stranded DNA (dsDNA) in a sample.
2.3. Quantification of lacZ Gene by Real-time PCR
For quantifying of
For qPCR employing SYBR Green I, PCR mixture including Titanium buffer 1X (BD Clontech), Nucleotide Mix Plus (Roche) 0.2 mM, E.c lacZ FP2 (J-Bio corporation, Japan) 1 μL, E.c lacZ RP1 (J-Bio corporation, Japan) 0.3 μL, BSA (Wako, Japan) 0.25 mg/mL, Titanium Taq DNA Polymerase 1X (BD Clontech) and SYBR Green I 0.2X (TaKaRa, Japan) were placed in a test tube of Lightcycler. For qPCR using QProbe, PCR mixture was produced in the same as for the preparation of qPCR employing SYBR Green1 except that SYBR Green I 0.2X was substituted by 0.05 μL of E.c lacZ QP2 (J-Bio corporation, Japan).
[Table 1] Three methods for DNA extraction
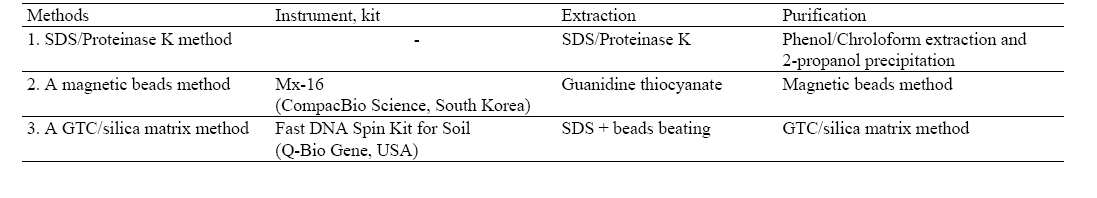
Three methods for DNA extraction
A 2 μL of genomic DNA isolate, which has been extracted by three different ways presented in 2.1, was added into a 18 μ L PCR mixture, in which the real-time PCR was then performed by Lightcycler in a given condition and the gene concentration was eventually determined on the basis of standard curve previously prepared. The standard curve for quantitative PCR was plotted by Ct (Threshold cycle) values, the cycle number at the point of encounter of fluorescence with the base line, of serial dilution of the PCR product of
The copy number of the target DNA of the sample was calculated based on the concentration of the PCR products as referring from that of a standard DNA. For a while, the sequences of the lac Z primers, e.g., E.c lacZ FP2 and E.c lacZ RP1, as well as the sequence of the lacZ probe, e.g., E.c lacZ QP2, used in the test were described in Table 2.
[Table 2] Sequences of oligonucleotide primers and a probe
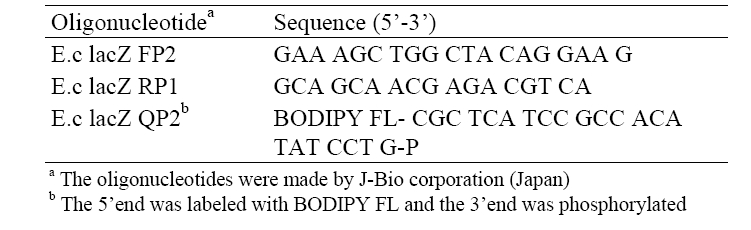
Sequences of oligonucleotide primers and a probe
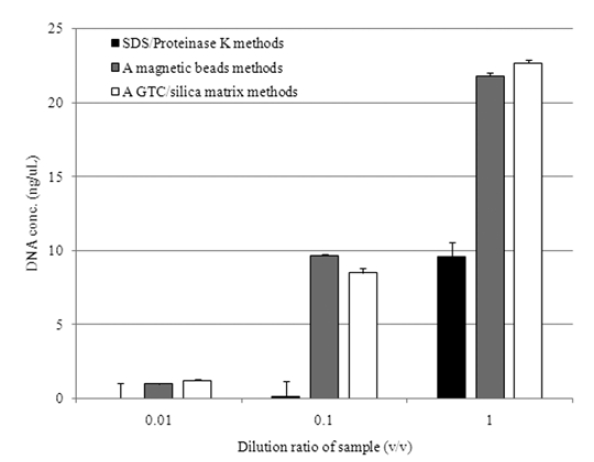
3.1. Comparison of DNA Extraction Methods from E. coli K-12
Fig. 1 represents the average value of DNA concentration based on the dilution ratio for the given samples. The standard deviation of all data was below 5%. The DNA concentration obtained from those methods was not significantly differed for 0.01 of dilution ratio. However, as much as dilution ratio increased more than 0.1, DNA concentration obtained from employing SDS/Proteinase K was approximately 10 ng/μL, which is
lower than the others, whose difference was further enlarged to 23 ng/μL for 1 of dilution ratio. As a while, the methods employing magnetic beads and GTC/silica matrix obtained almost the same amount of DNA regardless of different dilution ratios. The greater levels of DNA were retrieved from these two methods, but the lowest was observed from SDS/Proteinase K method. In referring from extraction time, it took almost two hours for SDS/ Proteinase K and GTC/silica matrix, but an hour for magnetic beads beating automatically conducted.
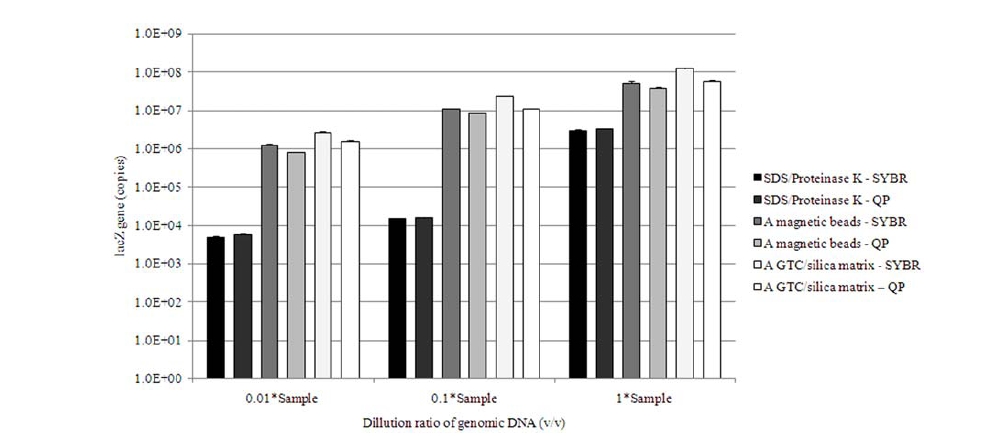
3.2. Quantification of lacZ Gene
For determining the concentration of
In the long run, the best methodological combination retrieving the greatest amount of gene from a laboratory prepared
However, employing GTC/silica matrix extraction took an hour more and it has relatively complicate procedures practised in comparison with that of magnetic beads beating. Although, SYBR Green I probe or QProbe real-time PCR with employing magnetic beads for DNA isolation presented lower value of copy number than that with GTC/silica matrix, the former can save the duration needed for the final quantification of DNA.
Unlike to a quantification based on a pure culture, a practical sample in the field may contain so many types of impurities like unknown soil colloidal particles or organics, which can interfere
in quantifying DNA.14) For that reason, DNA quantification employing gene specific probe such as QProbe or Taqman can be more preferably implemented for a practical purpose.
Three different methods were compared for extracting total genomic DNA from a laboratory cultured