Microbes are major players in the geochemical cycles, and important tools for industrial and environmental applications such as wastewater treatment, bioremediation, renewable energy, and medicine production. Because of the dimensions of the bacterial diversity, as much as 106 different species in a gram of soil,1) bacterial identification is critical for assessing and managing microbial processes in both natural and engineered conditions.
Bacterial identification has been traditionally done through cultivation-dependent methods such as metabolic and biochemical characterization of isolated strains, and also through microscopy. However, these cultivation-dependent and physiological assays can be time-consuming and results may change depending on the conditions used (e.g. temperature, pH, biological associations, etc). Additionally, a relative small fraction of the microbial diversity is cultivable using traditional methods (usually less than 0.1%),2) though recent advances has increase this to recoveries as high as 7.5%.3) To avoid the bias inherent to cultivation and isolation, molecular methods can be used to examine the microbial composition.
The most frequently used molecular method for bacterial identification is comparative 16S rRNA gene analysis. This technique takes advantage of the conserved nature of the 16S rRNA gene. This gene does not code for a protein but for a structural RNA part of the ribosome. Because ribosomes play an essential role in protein synthesis, this gene is ubiquitous in bacteria, highly conserved and it almost never horizontally transferred4) making it ideal for phylogeny reconstruction and identification.
More highly conserved regions in the ribosomal RNA gene sequence allow for the creation of (nearly) “universal” primers for the amplification of this gene from DNA extracted directly from natural environments. On the other hand, regions within the gene have increasing variation in sequence, reflective of evolutionary distance, and hence provides information that can be use for bacteria identification.
To identify the source of the sequences derived from environmental DNA, the sequences are compared with reference sequences from ribosomal RNA databases. This can be done through phylogenetic methods or classification methods. Phylogenetic methods cluster unknown sequences together with reference sequences using an alignment and a phylogeny reconstruction algorithm. Even though this is the preferred method, the computing power required greatly increases with increasing numbers of sequences and the results may differ depending on the phylogenetic algorithm used. On the other hand, classification methods sort the unknown sequences into a known taxonomic hierarchy by comparing features of the unknown sequence with those from references in the known taxonomy. Classification methods use either nearest-neighbor schemes or text-based Bayesian approaches. The first approach assigns a sequence into a taxon depending on the established classification of its closest relatives in the database. The second approach compares the “text features” of the sequences to find relatives with similar “text features”. Classification methods are easier to interpret and faster for well understood groups.5) Nowadays, classification methods for 16S rRNA gene analysis are becoming increasingly popular especially for environmental studies. Ribosomal RNA databases play a key role in this process by providing analysis tools, a standard taxonomy, and high quality sequences that can be used as references in the study of environmental sequences.
In this review article, we summarize a standard procedure for using the Ribosomal Database Project (http://rdp.cme.msu.edu/) in microbial community analysis. We also include recent status and features of “new” RDP services that allow using data from pyrosequencing for the study of both functional and phylogenetic gene analysis.
2. Recovery and Amplification of Genes Directly from Microbial Communities
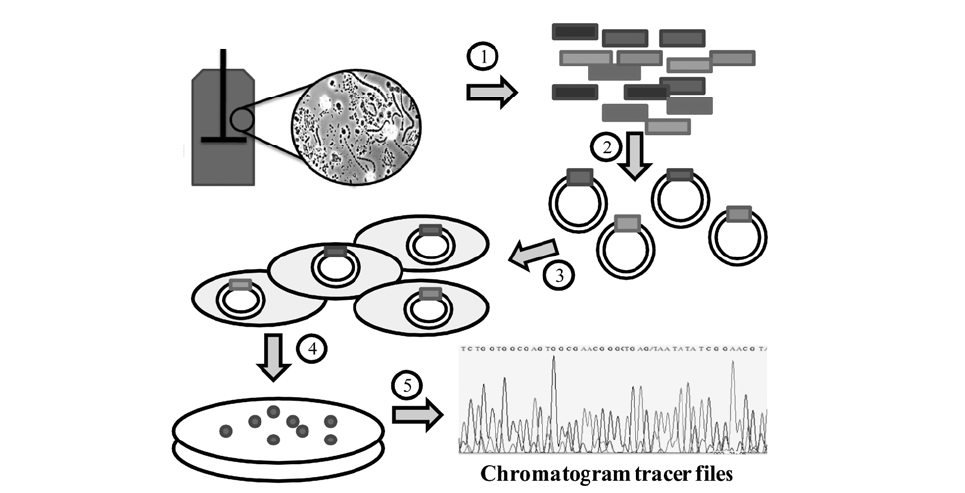
Traditional studies of microbial communities involved isolation isolation of their individual members. Since the microbial diversity is so large and bias in cultivation exists, microbial identification is now typically done by amplifying and sequencing the 16S rRNA gene directly from the community’s DNA. The first step, DNA extraction, can be done with a variety of commercial kits that can be used on samples from water, soil, bioreactors and almost every type of environment. Usually the most challenging situation for obtaining high quality DNA occurs when the population density is very low or when chemicals that interfere with DNA processing are present, such as humic acids in soils.6) After DNA is obtained, “universal” primers are used to amplify genes from all the members of the community with the polymerase chain reaction (PCR).
Because community DNA is amplified, a mixture of PCR products is obtained; thus creating a need to separate the individual products before sequencing. This is usually done by inserting individual products into a vector (e.g. plasmid) that is later inserted into a host cell, typically
Given the relative small size of the 16S rRNA gene (∼1500 bases), most of the gene can be sequenced using “single read” sequencing by the Sanger method.7,8) The current version of the Sanger method is based on the polymerization of a DNA strand using fluorescent dye terminators. The terminators are dideoxynucleotides labeled with a fluorescent probe, one color for each of the four bases (A,
C, G, and T). When the DNA polymerase extension is stopped by the terminators, a labeled nucleotide chain is generated. A population of chains can be later separated by electrophoresis, and because each chain is labeled with only one color, the sequence of the original DNA molecule can be determined.
Recently, new sequencing methods such as pyrosequencing have become available9-11) (see Box 1). These new sequencing methods produce shorter reads than traditional Sanger sequencing method but in much larger numbers and at a much reduced cost per base. Shorter reads creates the need to target regions of the 16S rRNA gene that are the most informative for identification and not the complete gene itself. These hypervariable regions even when small as 100 bases are informative enough to accurately classify most sequences to the genus level.5,12) The major advantage of these new sequencing technologies is the high throughput they provide, making possible to conduct large numbers of in-depth surveys of the microbial world. Of the new sequencing methods, pyrosequencing is rapidly becoming the most adopted method for microbial community analysis with 16S rRNA genes, while short-read methods, such as Illumina, are being used mostly for global expression studies.
Because the typical throughput of these technologies is very high (400,000 reads per run for pyrosequencing), multiplex methods are being used. In these methods, the genes are amplified with primers that are a combination of universal primers with four to six or more extra bases used as barcodes. A particular barcode is used to uniquely identify all sequences from one sample, so different samples can be mixed together and their sequence information later computationally separated; e.g. the 400, 000 sequences can be comprised of 80 libraries (samples) of 5000 sequences.
The first of these massive community surveys produced thousands of sequences per ocean sediment sample.13) In one study of sediments close to hydrothermal vents, more than 750,000 sequences were recovered and yet the microbial diversity present was still not completely sampled.14)
Box 1. Since its first publication in 1977, the Sanger method has been the gold standard for determining the sequence of nucleic acids. Advances in capillary electrophoresis, fluorescent dyes and automation allows one instrument to sequence up to 2.1 Megabases per day with average read lengths from 550 to 900 bases. Novel sequencing technologies based on different principles are nowadays providing much higher throughput but of shorter read lengths. Two examples of these technologies are pyrosequencing and Illumina sequencing. A single run of pyrosequencing generates up to 600 Megabases per day with average read length of 400 bases, while Illumina sequencing can generate 3 Gigabases of 36-base reads in a run which takes five days. The novel technologies are changing the way microbial communities can be studied providing a more comprehensive sampling of the microbial world.
3. Preprocessing and Quality Control
3.1. Processing of Sequences and Chromatogram Tracer Files
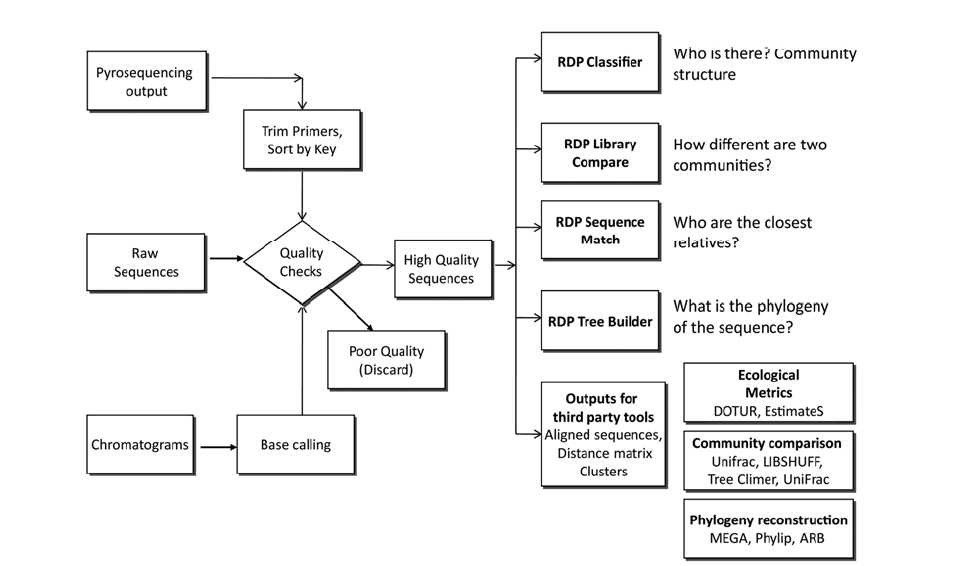
The output from sequencing is a chromatogram trace file. This file shows the signal for each nucleotide for every single position. Many programs are trained to read this trace file to assign a base to each position and provide an estimate of assignment accuracy (Q value). After each base is assigned, the complete sequence of the molecule can be determined. In the case of the RDP, either tracer files or sequence files can be used as input
for analysis (Fig. 2). In either case, users need to create a
Quality control is key for the correct classification and diversity estimation, as artifact sequences tend to be unique. Amplification of genes from environmental DNA has the potential to create biases and artifacts.15) Bias can be due to primer selection (as no single primer set is truly universal), to interference of the clone product with the cloning host,16) and to difference in the size of the amplicons. Artifacts like heteroduplexes and chimeras are due to hybridization of incomplete PCR products. Different approaches can be used to deal with these problems. Chimeras can be detected using specialized software packages like Pintail17) and Mallard18) and web-applications like Bellerophone19) and RDP’s CHIMERA CHECK.20) CHIMERA CHECK is a very popular tool that has been used to detect chimeric sequences in studies of microbial communities from petroleum-contaminated sediments,21) phosphorus removal from wastewater treatment plants,22) among others. Additionally, all public sequences are checked for artifacts using the Pintail application. This allows users to select a high quality database, and avoid problematic results due to unreliable reference sequences.
If working with trace files, the quality data information can be used to discard low quality sequences, and the spatial location of samples in the plate can be used to discover systematic errors in the sequencing process, e.g. low quality sequences coming from the same row could indicate a problem in a capillary of the sequencing instrument.
4. Who Is There? - Bacterial Classification
Bacterial classification is a form of identification that assigns unknown sequences to a position in a taxonomic hierarchy. The most common classification methods use a nearest-neighbor algorithm that assumes that the unknown sequence shares the same classification as its closest relatives. This approach is used by the Sequence Match feature of the RDP where the closest relatives “vote” on the classification of the unknown sequence using their own classification. If there is no consensus on the classification at the genus level, the next taxonomic levels is analyzed until a unanimous classification is reached.
The Classifier feature of the RDP assigns unknown sequences by calculating the frequency of 8-letter words and comparing these frequencies to those from a set that contains well-studied sequences from different regions of the bacterial Tree of Life.5) This method is fast, consistent and powerful enough to correctly classify sequences as short as 100 bases long.5,12)
As an example, this feature has been used to study the microbial community of an anaerobic enrichment that dechlorinated a PCB congener mixture.23)
Most studies of unknown sequences recovered from the environment benefit from finding close relatives to the unknown sequences. Relatives provide information about the phylogenetic association of the query sequences, and about their metabolic potential. The latter which is usually more useful than the name of the genus to which the sequence belongs, the best result from classification methods. This is especially important if a genus contains pathogenic and non-pathogenic members.
Several algorithms for finding close relatives exist with BLAST24) being the most widely known. In the case of 16S rRNA sequences, the Seqmatch algorithm has been shown to be more accurate in finding the closest relative of unknown sequences.20) This is because Seqmatch analyses the whole sequences while BLAST works on local alignments. As an example, Seqmatch has been used to find a close relative of a
6. Microbial Community Comparison
Several approaches can be used to compare microbial communities. The first approach is used in RDP’s Library Compare. With this feature, two libraries are classified into RDPs taxonomy and the abundance of each taxon is compared along with its statistical confidence. This approach has the advantage of identifying which groups account for the differences between communities. This method is fast, does not require alignment of sequences, has a genus level resolution (RDP taxonomy's smallest taxa), and works better for well studied groups.
The second approach assigns sequences into operational taxonomic units (OTUs) based on their similarity, e.g. if OTUs are defined at 97% identity, sequences 97% identical or higher will be assigned to the same unit. These OTUs are then used to compare the communities based on their diversity components: richness and evenness, and by different diversity indices.27,28) This approach requires sequences to be aligned in order to compare homologous positions and generate a matrix of distances between all sequences. It also requires a priori decision on the similarity level that defines the OTUs. Typically “species” level has been defined at 97% sequence identity,29) although new data suggest that a 98.5 to 99% sequence identity is more consistent with the DNA-DNA hybridization standard for species.30-32) Diversity indices such as Chao1 and Ace can then be used to estimate the total number of species in the sample. Other metrics, such as Shannon’s index and Evenness measure the distribution of species in the sample. However, two communities can have the same diversity by these measures but completely different compositions. Similarity between samples based on community composition can be calculated using the Sorensen33) and Jaccard34) indices.
A third approach uses phylogenetic information, statistical tests and Monte Carlo simulations. This approach is represented by LIBSHUFF,35) ∫-LIBSHUFF36, UniFrac,37,38) TreeClimber,39) Analysis of Molecular Variance (AMOVA), and Homogeneity of Molecular Variance (HOMOVA).39) However, these approaches are computationally difficult when the number of sequences is in the thousands. Additionally, results from methods that use phylogenetic trees in their analysis can be influenced by the length of the sequences used as well as the region of the 16S rRNA gene from which the sequence is derived. These methods, their specific approaches, with advantages and limitations have been recently reviewed.40)
7. Aides for Using the Ribosomal Database Project
The adoption of new sequencing technologies is currently changing the way we study microbial communities. The high throughput sequencing technologies now available or becoming available creates the opportunity to massively survey microbial communities for identification of the more dominant organisms, even in very diverse communities, as well as study community structure and dynamics. The information obtained through sequencing is useful not only for community profiling but also for identification of its members, and for phylogenetic analysis. The main limitation of sequencing used to be cost, the limited output, and complexity of the clone library process. These limitations can largely now be bypassed with the new sequencing technologies; however, the very large numbers of sequences creates computational and technical issues in handling and interpreting the data.
The new limitations are partially technically because of the novel nature of the techniques. Issues such as error rates, data handling, quality control, and standard analysis methods are some of the new technical limitations.
To facilitate the adoption of these powerful new technologies for 16S rRNA analysis, a pipeline for the analysis of pyrosequencing surveys was developed by the RDP.41) This pipeline (available at http://pyro.cme.msu.edu/pyro/ ) processes the raw sequences, checks their quality and separates them into their original samples by reading the barcode used in the amplification step. The pipeline uses a secondary-structure-based aligner to which the sequences can be compared. The use of a model for alignment instead of pairwise comparison reduces the speed for alignment, and provides a consistent alignment tool. In general, this pipeline facilitates the handling of big datasets, e.g 400,000 sequences, and provides tools for a consistent analysis.
The tools developed for the pipeline can also be used for massive surveys of functional genes of environmental relevance. The main difference in when dealing with functional genes is the alignment tool since the sequence (either nucleotide or protein) is relevant in contrast with ribosomal RNA genes where the secondary structure is the conserved feature. Some of the most popular aligner approaches use the programs CLUSTAL,42) MUSCLE.43) An alternative to these aligners is to use a protein model for alignment, such a Hidden Markov model, in the same way we use a secondary structure model for the ribosomal genes. Pfam (http://pfam.sanger.ac.uk/) and the Functional Gene Database/ Repository (http://fungene.cme.msu.edu/) use Hidden Markov Model (HMM) search programs to retrieve sequences that fit a given protein model from the public databases such as GenBank, EMBL, etc.
Pyrosequencing together with a HMM was used to study the diversity of biphenyl dioxygenase, a gene association with polychlorinated biphenyl (PCBs) degradation.44) A short variable region of the
The study of microbial communities is essential in the understanding of the processes microbes mediate. For this purpose comparative 16S rRNA gene analysis is one of the most powerful method currently available to study the microorganisms in their natural or managed environments. The information retrieve from sequencing this gene can be used for microbe classification, community structure determination, and phylogenetic analysis. For any of these applications, ribosomal RNA gene databases play a key role by providing the most current sequences, taxonomic information, and analysis tools. These features can be used to create a high quality, consistent, and replicable analysis.
Novel and cheaper sequencing technologies are revolutionizing the biological fields and comparative 16S rRNA gene analysis is also being changed by them. With the new methodologies, many of the restrictions are disappearing allowing researcher worldwide, including those in small laboratories, to discover and characterize the microbial diversity in microbial communities of their interest.
New databases and tools are being developed to meet the data analysis challenge necessary to realize the potential that the new sequencing technologies provide. The new analysis tools promise to also revolutionize the study of functional genes with massive surveys that reveal more of the functional diversity present in the microbial world.