SOC (state of charge) is used to indicate the remaining power of a battery and is one of the most important parameters in battery applications. An accurate SOC estimation can help prevent excessive charge or discharge of a battery, thus battery safety can be ensured; it can also be used as the control parameter to provide the optimal performance of the battery system. Several commonly adopted battery SOC estimating methods have been introduced, among which, the ampere-hour integral method is most commonly adopted due to simplicity and reliability; but there can also be problems such as the initial value and the cumulative errors [1]. Such problems can be avoided when the open circuit voltage method is adopted, but a long standing time is required to measure the open circuit voltage, which hinders its convenient application. The relationship between SOC and the voltage and current at the charging, discharging and static states, have been deduced [2]; the initial value of the SOC estimation can be calculated, then the improved ampere-hour integral method is used to estimate SOC and have it corrected at a fully discharged state. However, such correction at a fully discharged state does not completely overcome the accumulative error caused by the ampere-hour integral method. The ampere-hour integral method and the open circuit voltage method are integrated via the extended Kalman filter method based on the proposed simplified equivalent circuit model; and the measurement noise covariance error is adjusted through the measurement noise model to correct the SOC estimation continuously [3].
The Thevenin equivalent circuit battery model [4] is used in this article to estimate battery SOC based on the extended Kalman filter method. A method to simplify the process noise covariance and measurement noise covariance is proposed to facilitate application of the extended Kalman filter method. Finally, the battery SOC estimation method is verified through the DST driving cycle experiments [5]. The batteries used in the experiments are Model JD125210265F polymer Li-ion batteries produced by the Globe Super Power New Energy Technology Development Corp. with nominal voltage of 3.2 V and nominal capacity of 50 Ah [8].
The battery equivalent circuit model is widely used to estimate battery SOC and the Thevenin battery model is selected as the Li-ion battery model. Experimental data from the designed parameter identification experiments of the Thevenin battery model are used as the basis for deducting the Thevenin battery model parameters at corresponding testing points through the multivariate linear regression analysis in imitation of Partnership for a New Generation Of Vehicles (PNGV) [9] battery model parameter identification method; and the effectiveness of this estimation method is verified via the Dynamic Stress Test (DST) experiments. PNGV battery model is used as a standard battery model to the test model in ‘PNGV Battery Test Manual’ published in February 2001.
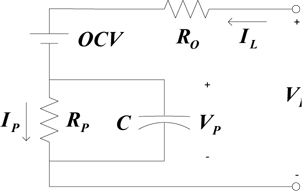
2.1 Thevenin equivalent circuit battery model
In this study, the Thevenin equivalent circuit battery model is adopted to acquire the process model and the measurement model of the extended Kalman filter, as shown in Fig. 1.
Where ideal voltage source

2.2 Mathematical relationship of thevenin battery model
Based on the Thevenin equivalent circuit battery model, battery

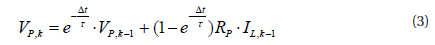
i.e.,
Where sampling time interval Δ
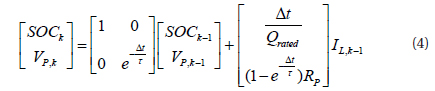
Meanwhile, the obtained discrete state equation of the Thevenin battery model is:


Where
2.3 Thevenin battery model parameter identification
The Thevenin battery model parameter identification experiments are designed in accordance with the proposed method i.e., the quantified HPPC (Hybrid Pulse Power Characterization) test [6]. Based on the experimental data, the Thevenin battery model parameters at corresponding testing points are obtained through the multivariate linear regression analysis in imitation of PNGV battery model parameter identification method. Model parameters when
[Table 1.] Model parameters when SOC=61%.

Model parameters when SOC=61%.
The Kalman filter is widely applied in estimations, but is only suitable for those linear models. The Thevenin equivalent circuit battery model is a nonlinear model; therefore, the extended Kalman filter is used in this article to estimate battery SOC.
The process model and the measurement model of the extended Kalman filter respectively, are:


Where and are the process noise and the measure noise,
Based on the mathematical relationship of the Thevenin battery model,
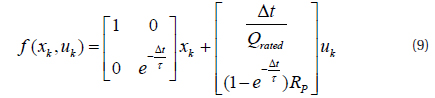

Where
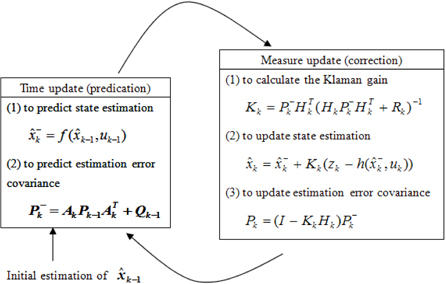
The time update equation of the extended Kalman filter is:


The state update equation of the extended Kalman filter is:


where, , and .
The working flow of the extended Kalman filter is shown in Fig. 3. First, the initial state and initial estimation error covariance are to be determined. Second, the state estimation and estimation error covariance are calculated based on equations (11) and (12). Then, the input and measurement values are input, as well as the process noise covariance and the measurement noise covariance; the Kalman gain is calculated based on equation (13); the state estimation and the estimation error covariance are corrected based on equations (14) and (15). Finally, a cycle is to be formed with the prediction and the correction, and the extended Kalman filter is to work continuously following this cycle.
3.2 Simplification of process noise covariance and measurement noise covariance
Since it is difficult to acquire precise process noise covariance and measurement noise covariance, the previously proposed method [7] is imitated to reach the following conclusions through significant number of experiments and simulations.
1. The larger the measurement noise covariance Rk, the slower the convergence of the filter, and smoother the filtration; the smaller the measurement noise covariance Rk, the faster the convergence of the filter, and more drastic the oscillation of the filtration. 2. The smaller the process noise covariance Qk, the smaller the filtration error, and better the filter performance. 3. When the process noise covariance Qk is at a very small value and Qk is 0, the filtration effect can hardly be any different.
Based on the above conclusions, the way to simplify the process noise covariance and the measurement noise covariance is as follows:
(1) Set Qk = 0, so as to achieve better filtering effect. (2) Before the first jump of the current, set Rk = 10−6, to maximize converging speed of the filter; then set Rk = 1, to make the filtration smoother.
3.3 Initial parameters of the extended Kalman filter
Assuming that the battery starts at a static state, the initial estimation of

As the battery is at a static state, the initial value of

4. VERIFICATION THROUGH EXPERIMENTS
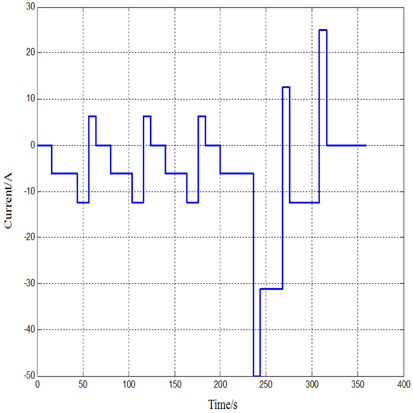
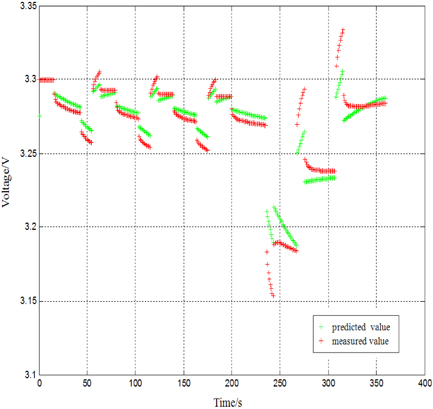
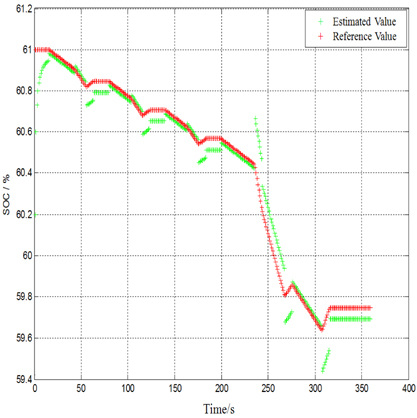
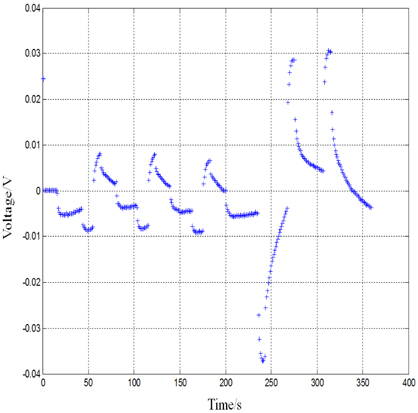
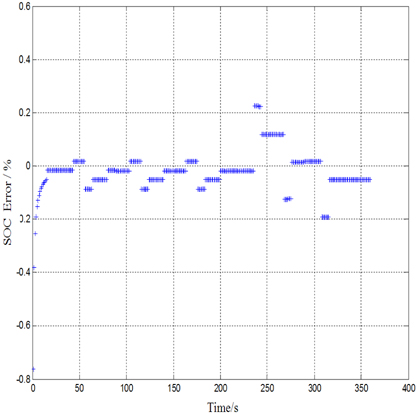
The DST (dynamic stress test) cycle used in this study, is designed based on the DST driving cycle and battery characteristics to verify the proposed battery SOC estimation method, as shown in Fig. 4. The DST cycle is used to generate the predicted value and measured value of the battery terminal voltage, as shown in Fig. 5; furthermore, the measurement difference (between the measured value and the predicted value) is shown in Fig. 6. The SOC obtained via the discharge test is used as a reference in this article to obtain the SOC estimation error. Meanwhile, only the SOC obtained through the discharge test after the DST cycle is used as a reference for convenience, and other SOC references are then obtained through the ampere-hour integral method. The battery SOC estimated values and reference values are shown in Fig. 7; the estimation errors (differences between estimated values and reference values) are shown in Fig. 8, from which it is apparent that the estimated SOC error is less than 2% and hence, of practical significance.
In this study, a simplified battery SOC estimation method is proposed based on the utilization of the Thevenin equivalent circuit battery model and the extended Kalman filter. The extended Kalman filter method is made easy to apply via simplifying the process noise covariance and the measurement noise covariance of the extended Kalman filter. Since it is difficult to acquire precise process noise covariance and measurement noise covariance, several experiments and simulations are required to reach practical conclusions. These conclusions can help deal with measurement noise covariance and process noise covariance. Subsequently, the DST cycle experiments are conducted to verify accuracy of the proposed SOC estimation, where the estimated SOC error is no larger than 2%.