Capital flight is not a current issue. It has become a trending topic recently. This is because of the two biggest financial scandals,PanamaPapersand ParadisePapers. Capital flight is also an illicit financial flow. Some previous studies define capital flight as a movement of investment or capital to obtain a better return or prospect (
According to the International Consortium of Investigative Journalists (ICIJ) report in 2017, there are 13.4 million documents from Paradise Papers and 11.5 million documents Panama Papers. There are 500 banks, and many individuals and 25,000 companies in the macrocosm. The ICIJ revealed there are 2,961 names from Indonesia. They are capitalists, businessmen, prime ministers, rich men, and well-known companies from Indonesia. Global Financial Integrity (GFI) estimates the illicit financial flows from Indonesia $271.65 billion at the 2005-2014 period.
From the ICIJ and GFI reports, capital flight is a large problem in Indonesia. The impact of capital flight, particularly for a non-western country like Indonesia is adverse. Capital flight will decrease revenues and increase foreign debt. And then, it will erode the tax base (Marianna ˇ
During the Jokowi government (2014-2019), the investment climate looks not well. According to BPS-Statistics Indonesia data, the business tendency index (BTI) of Indonesia steady growth. The BTI in 2013 is 104.91 points and 108.4 points in 2018. Investors still doubt the Indonesia economy because of political risk and much debt in Indonesia.
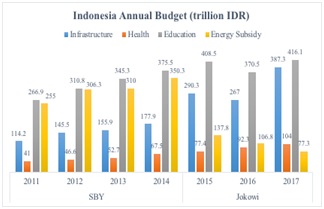
SusiloBambangYudhoyono (SBY) government (2004-2014), the investment climate is also not well. The national priority program at that moment focuses on teaching improvement and rising costs. Based on Figure 1, it allocated the proportion of the budget more for education and energy subsidies. The proportion of infrastructure was nearly half of the energy subsidy. This was because of high crude oil prices at SBY government.
The government prioritizes the budget for energy to stabilize the inflation rate and makes a few bases. The impact is Indonesia’s ease of doing business (EoDB) rank always above 100th at that moment. Therefore, only a few investors were interested in investing because the development plan did not concentrate on infrastructure development.
However, the highest economic growth of Indonesia happens in the SBY government, with 6.4 percent (2010). But during Jokowi government, the development plans focus on infrastructure. Based on Figure 1, contrary to the previous president, the proportion of the budget is more allocated for instruction and infrastructure. Many developers plan to focus on infrastructure development like toll roads, mass rapid transit (MRT), light rapid transit (LRT), high-speed railways Jakarta-Bandung, and many more.
Now, in 2019, there is a big project at special economic zone "KawasanEkonomiKhusus (KEK)”, Mandalika. Indonesia will be MotoGP host from 2021 to 2023 in Mandalika. Indonesia’s government will build much building in Mandalika to make MotoGP 2021 successful. Thus, many investors will put their capital in Indonesia, especially at Mandalika. That project proves that Indonesia’s climate investment is better than before. That project also will attract more investors from around the world and decrease capital flight from Indonesia.
The era of President Jokowi makes investors interested in placing their assets in Indonesia more and more. We assume that an infrastructure development plan in his era will decrease the number of capital flights from Indonesia. Although the budget for energy subsidy is half that of infrastructure, the inflation rate in Jokowi government has fallen 50 percent from 6 percent (2013-2015) to 3 percent (2016-2019).
President Jokowi also simplifies investment regulation to make business activities in Indonesia easier and simpler than earlier. Investment Coordinating Board, BKPM provides a “one-stop service” that aims to coordinate issuing other permits and approvals needed from several ministries and agencies of government for investment.
This investment service comprises 22 ministries and departments in a three-hour service. This introduction makes the rank of Indonesia’s ease of doing business (EoDB) increase drastically from 114th (2014) to 72nd (2018) of 190 countries. In ASEAN, this placement is under Singapore, Malaysia, Thailand, Brunei and Vietnam.
In 2019, President Jokowi has set a target for the state in the top 40 by next year. But an ambitious target will probably not come true. There are problems in Indonesia’s investment climate in this global crisis uncertainty. They are beginning a business, enforcing the contract, and paying taxes. Indonesia’s EoDB is in 100th rank at starting a business (144th), enforcing the contract (145th), and paying taxes (114th). Paying taxes indicator slipped 10 places to 114th.
Although Indonesia is the second world investment destinations (UNTCD, 2018), we view that global crisis, uncertainty gives an impact on Indonesia whole economic. In Jokowi government, Indonesia’s revenue decreases drastically. Grounded on the Ministry of Finance data, Indonesia's tax to GDP ratio (tax ratio) decreased from 11.4 (2014) to 10.9 (2017). If we compared to some ASEAN countries, Indonesia tax ratio is below than them such as Malaysia 15.5%, Thailand 17%, Philippines 14.4%, and Vietnam 13.8% in 2017.
The IMF concurs, saying that since Indonesia’s tax to GDP ratio is less than 11 percent, below the 15 percent threshold required to stimulate growth. The country cannot harness the potential of its 5.4 percent economic growth. Its tax to GDP ratio is also a lot lower than most other middle-income countries.
That low tax ratio also effects on Indonesia economic. In recent years has shown a steady growth above 5 percent. Steady investment flows have also allowed Indonesia’s economy to inflate at a rapid pace. Among ASEAN countries, Indonesia’s economic growth in 2018 is 6th rank under Cambodia the first. Most notably, the Indonesian government has announced several policy changes to get new investors.
The IMF recommends that to create sustainable economic development, the minimum tax ratio of 12.5%. We suppose the lower tax ratio is because of many abused state budgets, such as the markup or corruption. Whereas Jokowi government focuses on infrastructure development which needs much budget. The shock is that the budget deficit will increase every year. Based on the Ministry of Finance, the budget always deficit from -0.73 percent of GDP (2010) to 2.67 percent of GDP (2017).
The debt to GDP ratio increases enough drastically from 32.94 percent (2014) to 36.18 percent (2018). Based on the World Bank's report on International Debt Statistics in 2017, Indonesia is one of the top ten middle-income country borrowers. The high debt is also because of leaked state revenue.
There are yet many problems besides the better climate investment in Jokowi government. It will increase foreign loans to extend the budget deficit. A swollen foreign loan will increase investors’ risk aversion and deleveraging. That’s why there are many capital outflows and less capital inflow. We suppose this phenomenon is a capital flight.
The Jokowi government used the Tax Amnesty program after the emergence of the capital flight. But that program is not effective. Repatriation fund from tax amnesty only IDR 115 trillion of the total foreign funds, IDR 3,147 trillion (Bank Indonesia data).
The capital flight issue is like illicit financial flow. Based on the Global Financial Integrity (GFI) report in 2017, there are many illicit financial flows from Indonesia. The total is $271.65 billion in the 2005-2014 period. This is the big problem of Indonesia’s investment besides the strict investment regulation.
Some researchers have stated that the impacts of capital flight through the non-western economy are enough adverse. Capital flight can decrease revenues and increase foreign debt. Increasing foreign debt will create a new capital flight again. This cycle is like a vicious circle. Capital flight also can erode the tax base (Marianna ˇ
It will reduce the power of banks to create money with the purpose of investment projects. Then, the most important impact, capital flight, contributes to income from non-Western states to western countries (
This study aims to summarize the immense potential of investment in Indonesia in the short and long-term. Besides that, this study also explains the climate for investment conditions in Indonesia and how to maintain a lucrative investment. This work also explains the determinants of capital flight in Indonesia.
Some studies in the 20th century have put forward that the determinants of capital flight are macroeconomic factors.They are high,inflation and overvaluation of the exchange rate (
In addition, in 21st century studies, the high inflation rate still has a positive effect on capital flight (
Some studies have lately found that non-macroeconomic determinants cause capital flight.Corruption,country risk,and political instability are non-macroeconomic factors that cause capital flight (Baek & Yang, 2010;
However, these determinants are difficult to measure in Indonesia. Hence, this study uses an alternative non-macroeconomic determinant.That determinant is a sovereign rating. Sovereign rating is widely used by investors to consider how the Indonesian investment climate is right today.
This study included non-macroeconomic determinants because the capital flight is a complex matter.This topic is the impact of domestic wealthy individuals’ manner.They may avoid investing in their wealth because they are cared about losing profit.
Non-macroeconomic determinants like political risk and the financial crisis have a positive effect on capital flight.While,Foreign Direct Investment (FDI),external debt,and the stock market suffer a negative effect on the capital flight (
Inflation and deposit interest rates have a significant effect on the capital flight (
Only debt stocks,nominal the exchange rates,and IR differences have no substantial effect on capital flight eventually.Then,political instability has a negative effect on capital flight in Nigeria eventually (
Capital flight ratio (lagged),government debt ratio,economic growth,REER,Indonesia-US IR difference,and dummy sovereign rating have a significant effect on capital flight.(
This study employed the statistical principle because many previous studies ignore it.Previous studies have used determinants from the identity equation as a regressor.For example,some previous studies use external debt and foreign direct investment (FDI) as a regressor (
In the statistical principle,these two determinants are significant through capital flight. This is because those are components to measure capital flight by the residual approach. Therefore, this study excludes them.
3. Research Methods and Materials
It is almost impossible to calculate the exact amount of a capital flight of a country, especially for countries that adopt a free foreign exchange system (Istikomah, 2003). In this study, capital flight measurement uses the residual approach method (
However, the disadvantage of this method is ignoring the flow of funds like debt forgiveness. Then, direct measurement, especially hot money, gets criticism. This is because the method uses the basis of error and omission data. Error and omission include errors in collecting data, miscalculation, and unreported imports. Then, the criticism of the direct measurement, especially the asset method, is if the national depositors are reported, whereas that assumption does not always take place in reality (
This World Bank method has also been applied by almost recent studies
ED refers to external debt, FI refers to net foreign investment, CAD refers to current account deficit, and R refers to reserve.
Based on equation 1, the two initial components are sources of capital inflows or sources of funding, while the last two components are the source of use. If the difference between the source of funding and a source of use is positive, then it is capital flight, while if the difference is negative, it means a capital reflow (Ajayi & Khan, 2000) or inward capital flight (
The data to measure capital flight is in the period 2009 to 2017 quarterly. That period is appropriate with the latest Balance of Payment Manuals of the sixth edition (BPM 6) since 2009. We derive the data source from the Central Bank of Indonesia, BPS-Statistics Indonesia, OECD, and Moody’s Investor Service.
The estimation technique used in this study is ordinary least squares (OLS). This technique has been used widely in previous studies to estimate capital flight. Thus, capital flight regression is modelled:
where:
CF = Capital flight (QoQ)
RDef = Budget deficit to GDPratio (QoQ)
EG = Economic growth (QoQ)
Inf = Inflation Rate (QoQ)
ERG = Growth of the exchange rate (QoQ)
DR = Dummy sovereign rating (Baa3=1; Ba3 until
Ba1=0) (QoQ).(Speculative Grade= Ba3-Ba1;Investment Grade = Baa3)
μ = Error (QoQ)
The budget deficit ratio, economic growth, inflation rate, the exchange rate growth, and dummy sovereign rating affect capital flight simultaneously. And then, the budget deficit ratio, inflation rate, and the exchange rate growth have a positive effect on capital flight parted, but economic growth and dummy sovereign rating have a negative effect on capital flight.
Some studies in the 20th century concluded that the determinants of capital flight are macroeconomic factors. They are high, inflation and overvaluation of the exchange rate (
In addition, in 21st century studies, the high inflation rate still has a positive effect on the capital flight (
On the other side, some studies have recently found that non-macroeconomic determinants cause capital flight. Corruption, country risk, and political instability are non-macroeconomic factors that cause capital flight (Baek & Yang, 2010;
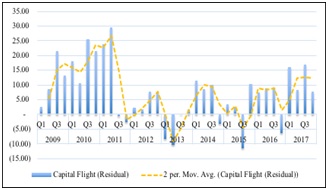
Based on Figure 2, Indonesia's capital flight exploded after the global economic crisis in 2008. The capital outflow in the first quarter of 2009 to the second quarter of 2011 is much greater than in the next periods. This condition is because the global economy is not a conducive and an unstable domestic economy. Based on BPS-Statistics, data, the economy grew slowly in the fourth quarter of 2010 and 2011, approximately 2.12% and -2.18%.
During the 2009-2011 period, the highest economic growth (QoQ) occurred only in the second quarter of 2010, 4.07%. In addition, the tragedy of the mega Kuningan bombs in July 2009 worsened political stability in Indonesia. It increased uncertainty and capital flight from Indonesia. The highest capital flight was $32.02 billion in the 3rd quarter of 2011.
Otherwise, the lowest capital flight was -US$8. 67 billion in the second quarter of 2013. It implies there is a capital re-flow or inward capital flight. It is because of Indonesia’s Government improves the economic policy, especially Ease of Doing Business (EoDB). The government defines a strategy called "Indonesia-sentries". With this strategy, the domestic economy (QoQ) exploded. It peaks at 4% in the second quarter of 2013 compared to the previous quarter only 0.49%.
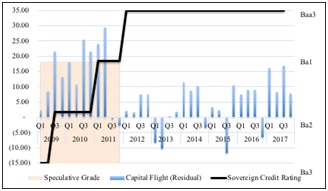
Based on Figure 3, although between 2009 and 2011 there was an increase in the level of credit rating, that level was still in the speculative-grade. That’s why the capital flight exploded in the period 2009-2011. Then, since 2012, the credit rating has also risen to "Baa3" which means the investment level of Indonesia is in investment grade. Even if the investment level was in investment-grade, capital flight during 2014 and in the period 2016-2017 was enough. This condition shows that the investment-grade level has not fully negatively reduced capital flight in Indonesia.
Based on Lucas Paradox's paradigm, capital will flow to Indonesia when the sovereign risk decreases. Since 2012, the sovereign rating has increased from speculative-grade (Ba1) to investment-grade (Baa3). In Virgantari's research (2010) shows that when the sovereign rating of Indonesia is at the investment-grade level (BBB-), the capital flight ratio to GDP will decrease 0.034 units.
We propose that the most influential problem of capital flight in Indonesia is because of non-macroeconomics factor, an especially political issue, corruption, bad regulation, and others. That’s why the investment climate in Indonesia is still not secure, especially the regulation on starting a commercial enterprise, enforcing contracts, and compensating taxes.
[Table 1:] OLD Estimation Results
OLD Estimation Results
Based on Table 1, an increasing one percentage point budget deficit ratio, the capital flight will raise to $2.64 billion. The earlier studies, Lucas Paradox's paradigm, also support it. In those studies, political institutions are the main factors affecting the national economy. In Indonesia, political risk is enough high. There are still many crimes, corruption, instability politics, bad regulation, etc. This problem can trigger capital flow out faster from Indonesia. Even though, Indonesia is one of the emerging markets.
This empirical result is also dealing with
Besides economic growth, the inflation rate also does not have a significant effect on capital flight. The sign of the inflation rate coefficient deals with the research hypothesis and earlier studies. When the inflation rate rises one percentage point, capital flight will increase $1.40 billion. This empirical result deals with the government's stabilization policy. The Government stabilizes price since economic crisis 1998 and 2008. When an economic crisis occurred in 2008, the inflation rate in Indonesia reached 11.06%. By stabilizing price with a macro-prudential policy, the inflation rate decreased by 2.78%. The inflation rate in the last three years is on target (Bank Indonesia, 2018). This circumstance indicates that price control in Indonesia is well. Investors or capitalists no longer consider the inflation rate as a suit for them to flee their capital overseas. Thus, the inflation rate doesn’t affect capital flight.
This result also deals with earlier studies and the research hypothesis. Earlier studies concluded that the inflation rate does not have a significant effect on the capital flight (
On the other side, the exchange rate growth has a significant influence on capital flight. Merely, the signal of the exchange rate coefficient is opposite of the research hypothesis. When Indonesia the exchange rate depreciates one percentage point, capital flight will decrease $1.10 billion. This empirical result is strange because contrary to earlier studies. When the domestic currency depreciates, there are two possibilities. Capitalists will keep their assets abroad from Indonesia.
When the Rupiah the exchange rate appreciates, capital flight increases (2009-2011) and vice versa. After the economic crisis in 2008, the rupiah appreciated during the 2009-2011 period. The capitalists view this term as an achievement because Indonesia's stabilization policy is strong against the crisis.
These results deal with the research of
In the last variables, we likewise look at the dummy sovereign rating as determinants of capital flight. Based on the results, the sovereign rating does not give an effect on capital flight. Simply, the coefficient sign deals with the research hypothesis and the earlier study. When Indonesia’s sovereign rating (Moody’s) at investment-grade level (D=1), capital flight can be reduced to $5.07 billion.
From this study, we can consider that the impact of sovereign rating to decrease capital flight is enough powerful than the other determinants. This result is dealing with figure 3. In that figure, when Indonesia's investment climate is in speculative-grade, capital flight is much enough (2009-2011). But when the sovereign rating is at the investment-grade level, capital flight is not as much as during 2009-2011.
This result also deals with the Lucas Paradox paradigm. In that paradigm, capital will flow to Indonesia when the sovereign risk decreases. Since 2012, the sovereign rating has increased from speculative-grade (Ba1) to investment-grade (Baa3). In Virgantari's research (2010) shows that when the sovereign rating of Indonesia is at the investment-grade level (BBB-), the capital flight ratio to GDP will decrease 0.034 units.
And then, the determination coefficient in this study is approximately 0.3090. It signifies that the determinants can explain the 30.90% variance of capital flight. The remaining 69.10% is explained by other determinants not included in the model. Some earlier studies with the same techniques also get a small determinant coefficient (Baek & Yang, 2010;
The budget deficit ratio, economic growth, inflation rate, the exchange rate growth, and dummy sovereign rating affect capital flight simultaneously. And then, the budget deficit ratio, inflation rate, and the exchange rate growth have a positive effect on capital flight parted, but economic growth and dummy sovereign rating have a negative effect on capital flight.
The most influential problem of capital flight in Indonesia is because of non-macroeconomics factor political issue, corruption, bad regulation, and others. That’s why the investment climate in Indonesia is still not secure, the regulation on starting a commercial enterprise, enforcing contracts, and compensating taxes. There are ways to improve the investment climate and reduce capital flight, short-term and long-term improvements.
Data from the United Nations Conference on Trade and Development (UNCTD) shows Indonesia as a promising country in receiving foreign investment. In addition, policy reforms joint with national economic performance have become an attraction for investors. Indonesia, for example, develops the creative economy as a breakthrough in improving the economy. Manifesting consistent growth in Indonesia’s creative industry is short-term to decrease capital flight outside Indonesia.
This creative industry has an excellent growth record of 922.58 trillion IDR (US$64.7 billion) or 7.44 percent of the country’s GDP and accounted for 14.3 percent of Indonesia’s workforce. Dubbed as the ‘creative economy’ initiative under the Jokowi administration, we poise it to become Indonesia’s future economic powerhouse.
We consider that investing in the creative economy is a good opportunity for investors’ capital in the short-term. In the era of industrial revolution 4.0 makes creative economics one of the strategic issues that deserve to mainstream as a strategic choice to win global competition, marked by continued innovation and creativity to increase economic added value through capitalizing creative ideas.
Indonesia’s projection in Jokowi government now holds a set of agendas to build many infrastructures. This is a great opportunity for attracting investors to put their capital in Indonesia. Not just that, but also creating a digital economy also become Indonesia’s future economic powerhouse.
Head of the Investment Coordinating Board, Thomas T. Lembong convey that the digital economy is one of the leading sectors to attract international investment in Indonesia. According to the data from APJII, internet users in Indonesia reached 143 million or 54% of the total population with the number of smartphones and mobile owner’s internet reaches 90 million.
Google and Temasek research also mentions that the market size of Indonesia's digital economy also reaches USD 27 billion. They predict the Indonesia market will grow to USD 100 billion in 2025. From the flow of foreign investment per year at the level of USD 20-25 billion, about 10% contributed from the digital economy sector.
We also consider that the capital flight issue can be solved by applying several policies such as deregulation of overlapping regulations, the equalization of business process simplification (EoDB) across the region, tax rate up to zero percent for reinvestment, and real-time monitoring of business processes.