Many parts of the world are effected by salt (Munns and Tester 2008), which is known as one of the main environmental constraints that are affecting the productivity of crops and plants (Munns 2002). Among various environmental stresses, excessive salinity in soil and groundwater suppresses plant growth, causes decrease in net photosynthesis, reduces vitality of enzymes that control metabolism, and accelerates production of harmful active oxygen species in plant cells (Cheeseman 1988, Borsani et al. 2001, Gill and Tuteja 2010). Salt constrains plant growth largely in three ways. The first is water deficiency caused by reduced water potential in soil around roots. The second is toxic effect of ions caused by excessive absorption of Na+ and Cl-. The last is ionic imbalance due to constraints in transportation and absorption of ions (Marschner 1995). Adaptive response of plants to salt can be divided broadly into the exclusion or accumulation of salts. Salt exclusion can be observed mainly in monocot sulphosalaplants while salt accumulation can be observed normally in dicotyledonous halophytes. Most halophytes survive by developing resistance to salt stress through two methods. One method is to remove accumulated salt from their bodies by forming salt glands as well as trichomes, special epidermal structure. The other is to dilute absorbed salt ion by increasing water content through the shape and structural changes of cell, and by accumulating absorbed salt in vacuole (Reimold and Queen 1974, Jefferies et al. 1979, Reimann and Breckle 1988, Breckle 1990). Species resistant to saline conditions increase concentration of compatible solutes in cytoplasm to carry out a process called osmoregulation, which plays a crucial role in the adaptation of the plants under saline environment. Representative compatible solutes are amino acids (esp. proline, Pro), betaines, low-molecular-weight carbohydrates, and sugar alcohols (Stumpf 1984, Smirnoff 1993). Under salt or water stress, many Chenopodiaceae plants are known to accumulate Pro and glycine betaine (GB) used as osmolytes for osmoregulation (Storey and Jones 1979). Salt accumulation in irrigated soil especially in arid and semiarid region is known as the primary factor of reduced crop productivity (Serrano 1996, Volkmar et al. 1998). In general, decreased crop productivity due to various environmental stress including salt is related to decrease in photosynthetic performance (Ziska et al. 1990). Salt reduces the photosynthetic ability of plant, by affecting one or more processes in connection with photosynthesis. Environmental stresses decrease light energy that plants use (Singh and Dubey 1995), reduce the amount of chlorophyll or destroy the structure of chloroplast, damage photosystem II (Downton et al. 1985), reduce stomatal conductance by closing stomatal pore and eventually reduce the amount of fixed CO2 (Seemann and Sharkey 1986, Singh and Dubey 1995).
This research was performed to investigate the physiological changes of leaf beet (
>
Plant material and growth conditions
Seeds of
>
Measurement of plant water content and inorganic ions
After measuring the fresh weight (FW), leaf samples were dried in an oven at 70℃ for 3 days to determine dry weight (DW). Plant water (PW) content was determined as the difference between the FW and DW. The dried plant material was ground to a homogeneous powder and extracted with 95℃ distilled water for 1 h, then the sample was filtered with a GF/A filter (4.7 cm, Whatman, UK). Inorganic cations (Na+, K+, Ca2+ and Mg2+) were determined by inductively coupled plasma atomic emission spectroscopy (ICP-AES) (Optima7300DV; Perkin Elmer, Waltham, MA, USA). The chloride content was measured using a chloride titrator (Titrators DL 50; Mettler Toledo Inc., Columbus, OH, USA).
Total ion contents (calculated as NaCl equivalents) were determined using a electrical conductivity instrument (Mettler Check Mate 90; Mettler Toledo Inc.).
>
Measurement of water-soluble carbohydrates and osmolality
Total soluble carbohydrates of the plants were assayed using the phenol-sulfuric acid method (Chaplin 1994). 20 μL of plant extract was mixed with 580 μL of distilled water, 400 μL of 5% phenol, and 400 μL of sulfuric acid, and the solution was allowed to stand for 10 min before being shaken vigorously. Total carbohydrates were quantified by determining the absorbance at 490 nm by using a UV mini 1240 spectrophotometer (Shimadzu, Kyoto, Japan) after 30 more minutes. Glucose (2–40 μg in 200 μL) was used as a standard solution.
Osmolality was measured by cryoscopy using an Micro-Osmometer 3MO (Advanced Instruments, Needham Heights, MA, USA).
Dried leaves (0.5g) were extracted in 3% sulphosalaplantsicylic acid and the homogenate filtered through a 0.45 µm pore size CF/C (Whatman). Filtrate of 2 ml was reacted with 2 ml of acid ninhydrin reagent and and glacial acetic acid of 2 ml in a test tube for 1 h at 100℃ and the reaction terminated in an ice bath. The reaction mixture was extracted with 4 ml of toluene and mixed vigorously with a vortex mixture for 15-20s. The chromophore containing toluene was aspirated from the aqueous phase, warmed to room temperature and the absorbance measured at 520 nm using toluene as blank. Pro concentration was calculated from a standard curve using L-Pro (Bates et al. 1973).
The extract was diluted with 2N H2SO4 (1 : 1 /v) and 0.5 mL of the acidified extract was cooled in ice water for 1 h. Later, 0.2 mL of cold potassium tri-iodide solution was added and mixed by vortex, and the tubes were stored at 4℃ for 15 min and centrifuged at 10,000 rpm for 15 min. The supernatant was aspirated with a fine-tipped glass tube. The periodide crystals were dissolved in 9 mL of 1,2-dichloroethane with vigorous shaking. After 2.5 h, the absorbance was determined at 365 nm in a spectrophotometer. GB (200 μg in 1 N H2SO4 1000 mL) was used as a standard solution (Grieve and Grattan 1983).
>
Leaf gas-exchange measurements
Photosynthesis of the plant leaves was determined using a LCi Portable Photosynthesis System (ADC BioScientific LTd, Hertfordshire, UK), and then was stabilized for five minutes to one-minute interval was measured five times.
Before measuring chlorophyll fluorescence, leaves were put in dark-adapted state for 20 min using light exclusion clips and then minimal fluorescence in dark-adapted leaves (F0), maximal fluorescence (Fm), maximum photochemical quantum yield of photosystem II (Fv/Fm), effective photochemical quantum yield of photosystemⅡ (Y(II)), quantum yield of light-induced non photochemical fluorescemce quenching ( Y(NPQ)) and quantum yield of non-regulated heat dissipation and fluorescence emission (Y(NO)) were measured using a Portable Chlorophyll Fluorometer PAM-2500 (Heinz Walz GmbH, Effeltrich, Germany).
>
Measurement of chlorophyll contents
The leaf samples for chlorophyll and carotenoid were extracted by dimethyl sulfoxide (DMSO) at 60℃ for 24 h. The contents of chlorophyll a, chlorophyll b and carotenoid were estimated from absorbance at 645 nm, 663 nm and 480 nm with UV mini-1240 spectrophotometer (Shimadzu).
Data were analyzed by analysis of variance (ANOVA) using SPSS ver. 19.0 (SPSS Inc., Chicago, IL, USA). Graphs show means with standard deviation (SD). A Duncan’s multiple range test was carried out to determine significant differences (
>
Growth and plant water content
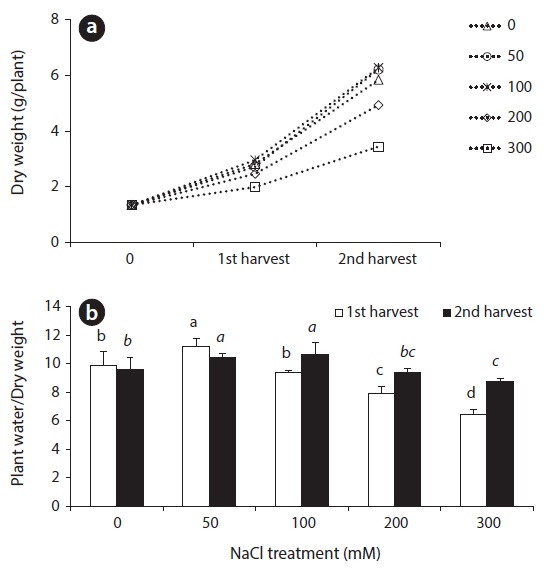
DW change and the ratio of plant water content to DW in beet leaves after salt treatments are shown in Fig. 1. A great difference could not be observed in dry weight between the control and treatment groups until after the first 14 days salt treatments. However, DW showed a significant difference at 28 days after salt treatment. The DW of the two treatments of 50 mM and 100 mM NaCl were more than that of the control. When treated with 200 mM NaCl, however, DW was slightly lower than the control, and plant growth was significantly inhibited at 300 mM NaCl treatment (Fig. 1). Until 14 days after treatment, the ratio of plant water content to DW in beet leaves was increased at 50 mM NaCl and then gradually decreased, and showed the lowest value at the 300 mM treatment. Over 100 mM NaCl treatments, the ratio of plant water content to DW in leaves of the 28 day treatment increased due to continued salt stress, compared to those given the 14 day treatment (Fig. 1).
Compared with most crops which generally exhibit low salt tolerance, many chenopodiaceous plants possess a somewhat higher salt tolerance (Choi et al. 2014). For example,
In the NaCl treated group, a large difference was not observed in F0, Fm and Fv/Fm, which represent quantum yield of photosystem II’s photochemical reaction to maximum photosynthesis (Table 1). Chlorophyll fluorescence and electron transport in leaves of beets were hardly affected by salt treatmemts, displaying a high Fv/Fm value of over 0.81 in all experimental groups treated with NaCl.
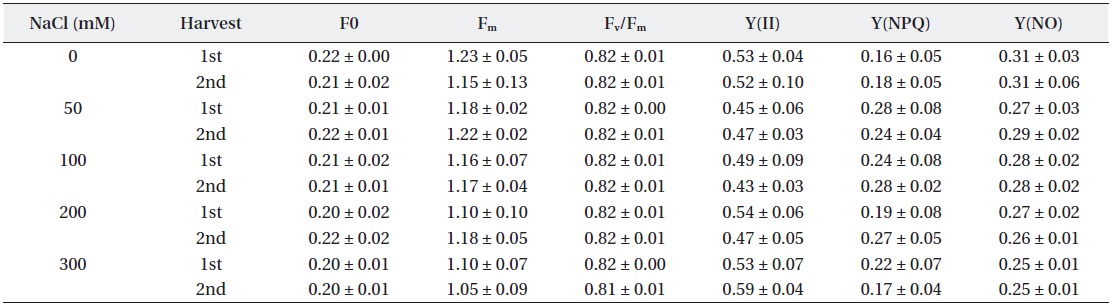
Characteristics of chlorophyll fluorescence (F0, Fm, Fv/Fm, Y(II), Y(NPQ) and Y(NO)) under NaCl stress.
Fv/Fm is used not only to measure photosynthetic electron transport ability, but also as an indicator of environmental stresses (Schansker and van Rensen 1999). The Fv/Fm ratio of plants in stress-free environments is generally known to be 0.75-0.85 (Peterson et al. 1988). Typically plants tend to show an increase of F0 and decrease of Fm when they are stressed. However, stressed plants possess a mechanism that relaxes the energy of excited electrons derived from chlorophyll by releasing the energy as a form of heat and light in order to suppress the generation of active oxygen species, which brings it back to the ground state. In this way, the photosynthetic apparatus in leaves is protected. This is the photoprotection mechanism of plants, called non-photochemical quenching (NPQ) (Niyog 1999). The results of this experiment did not show any significant difference between the control and experimental groups in terms of the values of F0, Fm, Fv/Fm, Y(NO), Y(II) and Y(NPQ). Judging from the results, NaCl treated beet plants perform photosynthesis effectively without significant salt effect. It is considered that beets under salt stress is not damaged to photosystem.
>
Chlorophyll a, b and carotenoid content
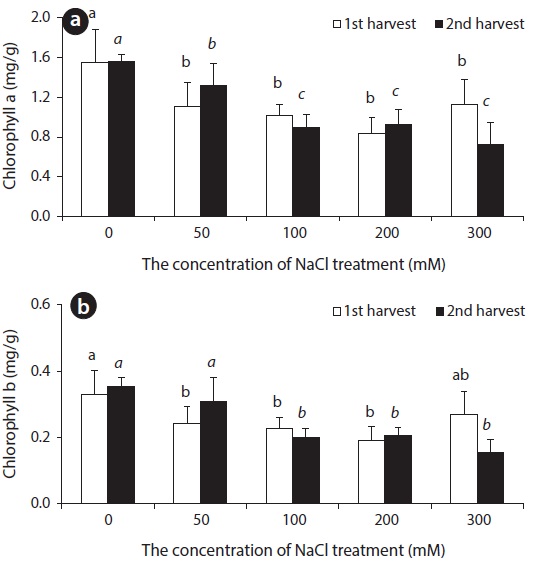
Chlorophyll a (Chl a) content of beets displayed a tendency to decrease in accordance with the increase of salinity. With lengthened treatment time, a difference in content was not observed up to 200 mM, but a decrease in Chl a content was observed at 300 mM. Up until the 14th day, Chl b content decreased somewhat, but did not display a great change. However, a decrease was observed at concentrations over 100 mM on the 28th day (Fig. 2).
Carotenoid is known to play two roles in photosynthesis: light harvesting and photoprotection (Hopkins and Hüner 2004). With respect to concentration level of NaCl treatment, carotenoid content was lower in all experimental groups than in control groups (Fig. 3). In general, chlorophyll content decreased in leaves of NaCl-stressed plants (Meloni et al. 2003). Decreased Chl a, Chl b and carotenoid contents in leaves of beets treated with NaCl perhaps indicate that NaCl hinders the synthesis of chlorophyll and carotenoid in beet.
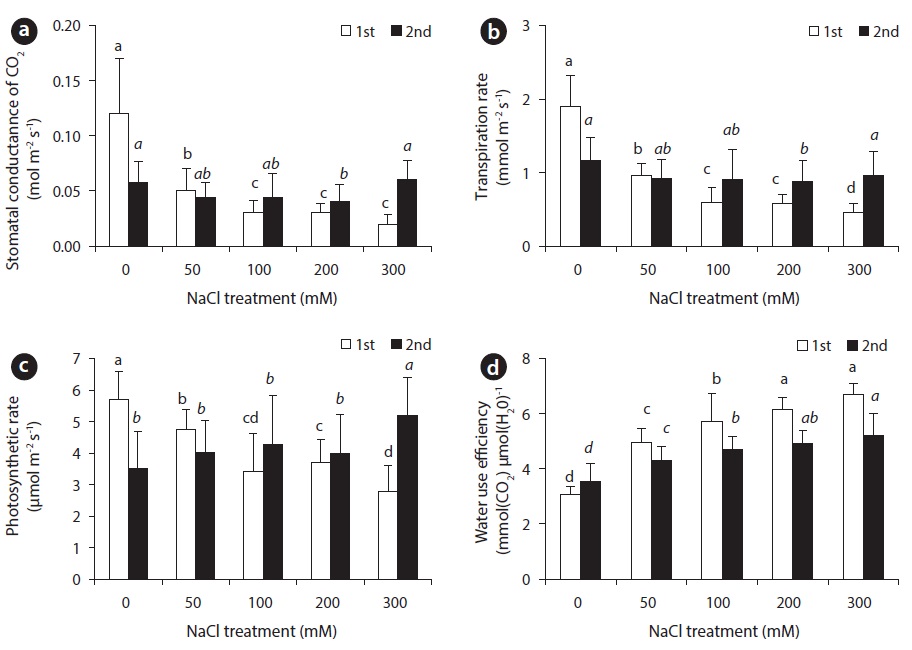
With the increase of NaCl concentration, both stomatal transpiration rate and stomatal conductance showed a tendency to decrease significantly, while water use efficiency displayed a tendency to increase (Fig. 4). Transpiration usually occurs through stomata, so that the degree of stomatal opening and closing is of absolute importance in water retention. Stomatal conductance, which is diffusion of water into the atmosphere, is influenced by many environmental factors such as light intensity, vapor pressure deficit, concentration of carbon dioxide, temperature and relative humidity (Sim and Han 2003). With decreased stomatal conductance, stomatal transpiration rate decreases and photosynthetic performance is affected. Photosynthesis in higher plants became especially affected when plant was provided with less than available water. Thus, abscisic acid (ABA) content in plants is increased. With the change in ABA content, stomata begins to close up, which affects the absorption of carbon dioxide (Salisbury and Rose 1992, Yu and Bae 2004).
Fourteen days after NaCl treatment, an obvious difference in transpiration rate and stomatal conductance between control group and experimental groups was observed. The difference of the 1st harvest was more significant than the 28th day. With NaCl treatment, a decrease in transpiration rate and stomatal conductance appeared before photosynthesis. As a result, the beets decreased stomatal conductance and transpiration rate in order to reduce water loss within the plant body under NaCl stress. Therefore, appropriate water-carbon dioxide exchange could not take place, hindering photosynthetic performance.
>
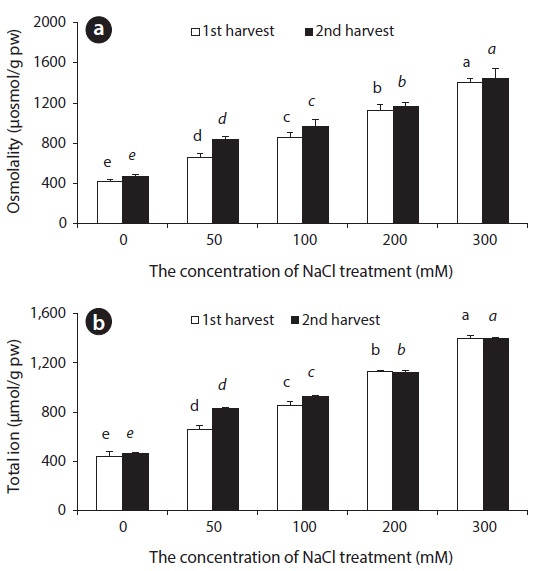
Osmotic concentration, total ion and inorganic cation content
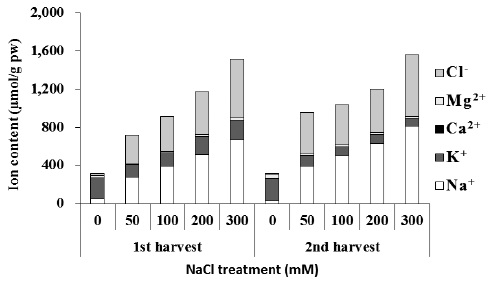
Ion uptake and compartmentalization are crucial not only for normal growth but also for growth under saline condition (Adams et al. 1992) because the stress disturbs ion homeostasis. The total osmotic concentration and ion content accumulated in beet leaves increased with an increase in salinity (Fig. 5). This had a connection to an increased influx of Na+ and Cl- ions. In order to maintain water potential of leaves under saline conditions, the beet increases osmotic concentration in the body. The study shows that in the beginning of salt stress, inorganic ions constituted the majority of osmotic concentration, and then, organic solutes such as GB were accumulated in the plant body.
High salt (NaCl) uptake competes with the uptake of other nutrient ions, especially K+, leading to K+ deficiency. Increased treatment of NaCl induces increase in Na+ and Cl- and decrease in Ca2+, K+, and Mg2+ levels in a number of plants (Khan et al. 1999, Aziz and Khan 2001). In plants that cannot remove salt out of the body, absorption of K+ and Ca2+ ions is hindered under environments with high concentrations of NaCl. At the same time, growth is hindered by the imbalance in inorganic nutrients and ion toxicity caused by excessive influx of Na+ ion (Ashraf et al. 1994). In some plants, excessive Ca2+ ion content in the plant body can have a harmful effect, so a low Ca2+ concentration is usually maintained in the cytoplasm. Chenopodiaceous plants are especially known to accumulate only a small amount of Ca2+ ions in the plant body (Choo and Song 1998). Plants adapted to saline environments possess various physiological control mechanisms: In order to avoid NaCl hinderance, plants dilute salt accumulated in cells by increasing water content (succulents), emit it through salt glands, accumulate in trichome, accumulate to the roots or old leaves, and store it in vacuoles (Shabala and Mackay 2011). Sugar beets, a Chenopodiaceous plant, accumulates a great amount of K+ and Na+ to use for osmotic adjustment during early stages of its growth. As it grows, it gradually dilutes accumulated ion concentration by increasing water content within the plant body (Kenter and Hoffmann 2006). As a response to NaCl stress, beets overcome ion toxicity by appropriate compartmentalization of Na+ ions accumulated in the leaf. At the same time, beets increase water content and maintain a balance between Na+ ions and K+ ions in leaves.
>
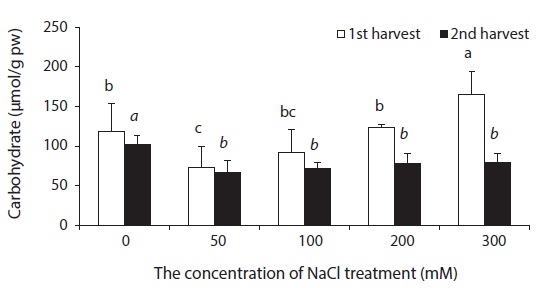
Soluble carbohydrate content
Beets contained a small amount of soluble carbohydrates. The smallest change in soluble carbohydrate content was observed in experimental groups treated with 50 mM NaCl, while the greatest change was observed in experimental groups treated with 300 mM NaCl (Fig. 7). As a response to drought or NaCl stress, most plants accumulate soluble carbohydrates such as sucrose, Gramineous crops and Cyperaceous plants are especially known to contain a great amount of sugar (Albert and Popp 1978, Stewart et al. 1979, Huetterer and Albert 1993, Choo and Albert 1999). A physiological characteristic of
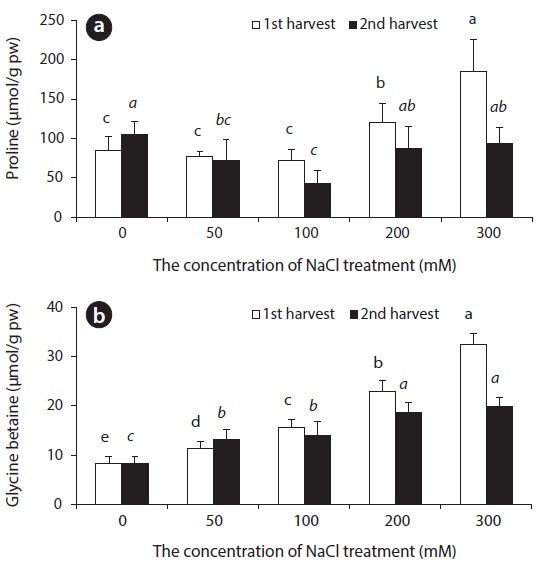
In NaCl treated beets, changes in Pro content did not show in the control group, nor did they appear in experimental groups treated with up to 50–100 mM NaCl, but beets showed an increase in content at NaCl concentration of 200 mM and 300 mM on the 14th day. On the 28th day, a great difference in Pro content between all experimental groups, and the control group was not observed. In comparison, GB content following saline treatment showed an increase in accordance with an increase in salinity (Fig. 8).
Pro, which is known as one of the compatible solutes, is accumulated as a response to water deficiency as well as salt and low temperature stress in higher plants, and this accumulation plays an important role in osmotic adjustment. Also, Pro assists in protecting cells from many negative effects caused by drought (Binzel et al. 1987, Voetberg and Sharp 1991, Rhodes and Hanson 1993). GB, which is known as a cytoplasmic osmolyte for osmotic adjustment, is accumulated in the cytoplasm as a response to stress such as salt, cold, heat and drought in many plants. Even though a great amount of GB may accumulate in the cytoplasm under osmotic stress, it does not hinder biochemical responses. Rather, it is used to maintain cell membrane, to stabilize cell structure, and to maintain photosynthetic efficiency (Wang and Showalter 2004). The accumulation of GB not only has a connection to NaCl resistance, but is known to increase NaCl resistance in plants that do not form GB when the supply of GB from the outside (Harinasut et al. 1996). In sugar beets and spinach, which are Chenopodiaceous plants, formation of GB in chlorophyll is catalyzed by choline monooxygenase (CMO) and betaine aldehyde dehydrogenase (BADH) enzymes as a response to various stress factors such as drought and NaCl, and is accumulated in the cytoplasm (Sakamoto and Murata 2002). In beets, GB is accumulated for osmotic adjustment with accumulation of inorganic ions such as Na+ and Cl- in the plant body. Thus, GB is thought to be the main cytoplasmic osmolyte for osmotic adjustment in regards to NaCl stress in beets.
These results suggested that under severe NaCl stress conditions, NaCl treatment did not induce photochemical inhibition on fluorescence in the leaves of
By understanding the physiological characteristic of beet under salt stress, it may give a clue to solve salt accumulation problem in agricultural land.