검색 전체 메뉴
PDF
맨 위로
OA 학술지
Relationship between the spatial distribution of coastal sand dune plants and edaphic factors in a coastal sand dune system in Korea
  • 비영리 CC BY-NC
  • 비영리 CC BY-NC
ABSTRACT
Relationship between the spatial distribution of coastal sand dune plants and edaphic factors in a coastal sand dune system in Korea
KEYWORD
CCA ordination , coastal sand dune plant , relationship between vegetation and environmental factors , zonal distribution
  • INTRODUCTION

    The spatial aggregation of species along a gradient is termed zonation (Smith and Huston 1989). It has been demonstrated that environmental heterogeneity affects plant distribution due to variations in micro-environmental conditions, and the specific responses of plants to this variability (Ranwell 1972, McCook 1994, Culter et al. 2008). Several studies have investigated the relationship between vegetation and environmental gradients (Lortie and Cushman 2007, Lane et al. 2008, Carboni et al. 2011). Variation in vegetation landward across coastal sand dunes is associated with decreases in the degree of exposure to salt spray (Lubke 1983, Maun and Perumal 1999), strong winds, and sandblast (Martinez et al. 2001) as well as with increased nutrient levels (van der Valk 1974, Gilbert et al. 2008, Lane et al. 2008 ) and moisture content of the developing dune soils (Baldwin and Maun 1983). Variation in soil properties may also result from topographic heterogeneity. The resultant soil-vegetation and soil-landscape interrelationships should therefore be expected to be more complex than either of the two considered separately (Chen et al. 1997).

    Many natural sand dune areas in South Korea have been lost due to development, overuse, invasive nonindigenous plants, and beach erosion by typhoon surge, coastal flooding during the summer, aggravation of the meteorological disaster and sea level arising (Yoon et al. 2010, Kim et al. 2013), resulting in beach regression, biodiversity loss, damage to vegetation, and environmental disturbance which in turn have affected the re-vegetative process (Girad et al. 2002). In coastal ecosystems, these impacts include the interruption of the sand supply, which can accelerate sand erosion, and result in the deterioration of the dune system. In addition to the collapse of a balance of eroded and deposited sand by foundation of shore protection structures is as an important factor influencing sand erosion. Although the importance of maintaining beach and dune ecosystems is increasingly recognized (Mendoza-González et al. 2013) and many studies on coastal dune protection have conducted, there is still insufficient ecological information on dune vegetation and environmental factors.

    The objectives of this study were therefore to describe the distribution patterns of coastal sand dune plants and the soil environment across the dune gradient and to relate plant distribution with environmental factors.

    MATERIALS AND METHODS

      >  Study sites

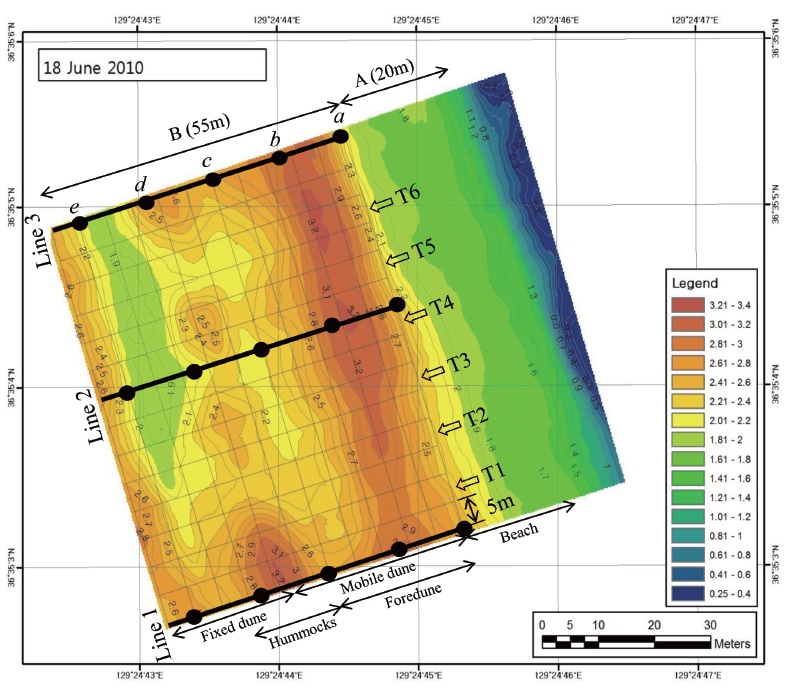
    Even though a lot of coastal dune areas in east coast have been affected by natural or artificial environmental conditions, the Goraebul coastal dune field, the largest that in east coast of Gyeongsangbuk-do Province in Korea (36°34′27.9″N, 129°25′04.6″E), has well-developed foredunes and dune vegetation and is an established Long-Term Ecological Research (LTER) site for the study of coastal ecosystems (Fig. 1). Since it located with an area managed by the military, the Goraebul coastal sand dune system is relatively unaffected by anthropogenic activities compared with the surrounding region due to restrictions on development and limited accessibility from the outside. The sand deposition in almost seasons except summer was investigated in Goraebul sand beach (Bang and Lee 2011). The microtopography includes a beach face, berm, beach flat, foredune and three hummock dunes lying parallel to the shoreline (Fig. 1). Sandy beach significantly influenced by wave action was developed about 20 m in width and was rarely vegetated.

    Temperature in this region fluctuates seasonally; the warmest and coldest months are August and January, respectively. Mean annual temperature and precipitation for the study period (2010-2013) were obtained from meteorological records of the Yeongdeock Meteorological Observatory. The mean annual temperature is 13.2℃ (January 0.0℃ , August 26.4℃). The mean annual precipitation is 1000 mm, of which 670-900 mm fall in April-October. The mean monthly temperature in April-September varied between 10.3-15.5℃. Extreme mean monthly temperatures ranged between -2.6℃ (January 2011) and 27.7℃ (August 2013).

      >  Plant distribution

    To reveal the distribution patterns of plants in the Goraebul coastal sand dune, a rectangle of 70 m × 55 m containing 154 grids of 5 m × 5 m grids which extended from the location of the first plant found on the upper shore to the fixed dunes was established (Fig. 1). The surveying first line which was established parallel to the shoreline was set at the distance of about 20 m from the shoreline or about 10 m from the berm. To identify spatial patterns of plant species across the gradient, we recorded coverage of all plant species in a grid that consisted of six belt transects, each 55 m long, which were separated by a distance of 5 m (Fig. 1). Plant cover was surveyed over a four year period (from April to October 2010-2013). Within each quadrat, the percent cover of plant species was first assigned to one of the six cover-classes: 0-5%, 5-25%, 25-50%, 50-75%, 75-95%, 95-100%, then plant cover was further refined to the nearest 5% for cover values from 5% to 95% and to the nearest 1% for cover less than 5% and greater than 90%.

      >  Soil sampling and analysis

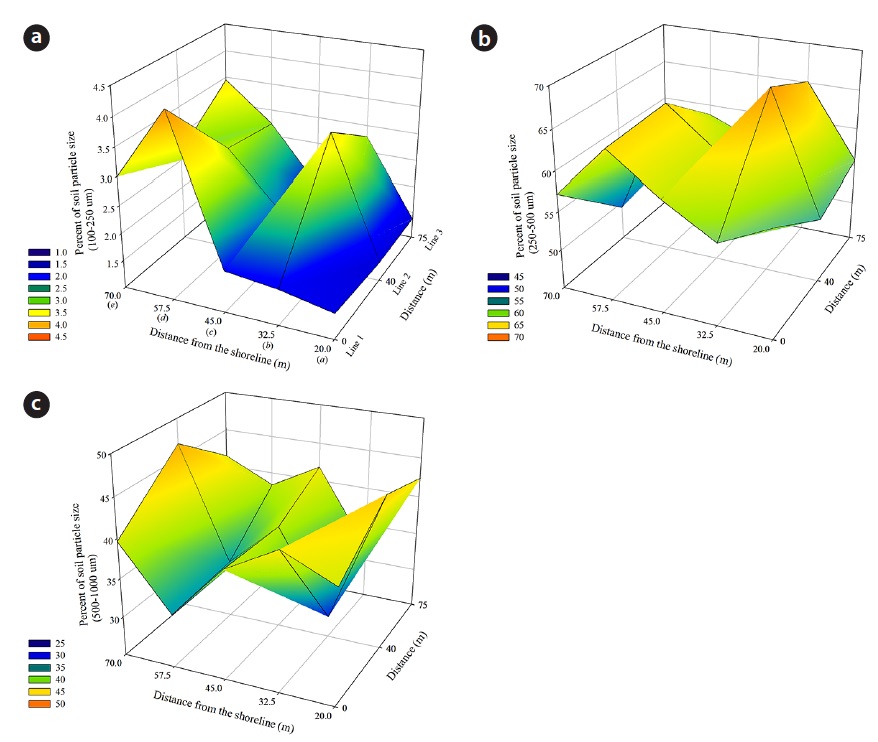
    In the study area, five quadrats (2 m × 2 m) were established at each of the three lines to analyze the relationship between distribution of plants and environmental variables, thus producing data from 15 quadrats (Fig. 1). Soil samples (0.2 kg) were collected from 0 to 10 cm depth at each the 15 quadrats during the period April - October from 2010 to 2013. Water content (WC) of the soil was determined by comparing the weight difference between fresh and oven-dried soils. Soil particle sizes (SPS) were analyzed by a Particle Size Analyzer (Mastersizer 2000; Malvern Instruments Ltd, Worcestershire, UK) which allows particles in the size range 0.02 to 2000 μm, and the soil had a particle size distribution of 99% and more sand (150 to 1000 μm), classifying this soil texture as sand (United States Department of Agriculture 1987). The sand separate was subdivided into coarse sand (500-1000 μm), medium sand (250-500 μm), and fine sand (100-250 μm).

    Soil samples (5 g) were added to 25 mL distilled water, and shaken for 1 h. The soil solution was then filtered through a filter paper (Whatman No. 40, 110 mm), and the soil pH and total ionic content (TIC, calculated as NaCl equivalents) were measured using a pH meter (Orion US/710; Thermo Orion, Waltham, MA, USA) and an electrical conductivity meter (MX300 X-masterpro; Mettler-Toledo, Columbus, OH, USA), respectively. The organic matter (OM) contents were estimated by loss of dry mass upon ignition at 550℃. Total nitrogen (TN) was measured by the Kjeldahl method.

      >  Data analysis

    Box-whisker plots were, generated using SPSS ver. 18.0 (SPSS Inc., Chicago, IL, USA), and used to illustrate the plant distribution at varying distance from the shoreline during the study period. The spatial distribution pattern of soil parameters was illustrated using Sigma-plot 2000 (ver. 6.10; SPSS). The data were tested for normality with the Kolmogorov-Smirnov test and homogeneity of variances with Levene test. To test the relationship between the distance from the shoreline and soil properties, Spear-man’s rank correlation was applied due to lack of homogeneity of most soil variables except TN. Quantitative data on soil properties among soil sample plots as factor were compared using parametric (ANOVA, followed by Duncan’s test as a post hoc analysis) or non-parametric analysis of variance (Kruskal-Wallis test when the data were not normally distributed or the variances of the groups differed significantly, followed by Mann-Whitney U test as a post hoc analysis), depending on the characteristics of the evaluated variable (SPSS ver. 18.0 ). P < 0.05 was considered statistically significant.

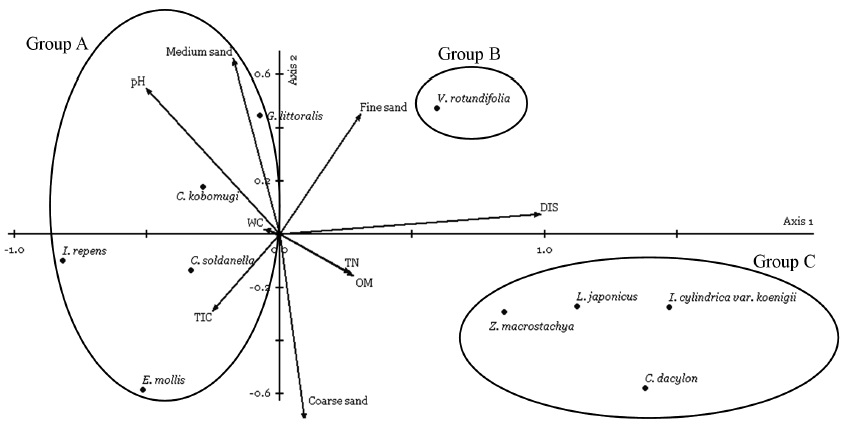
    In order to obtain an effective description for sand dune vegetation and related environmental factors, both two-way indicator species analysis (TWINSPAN) and canonical correspondence analysis (CCA) are employed. CCA is used to identify the most important environmental factors in determining patterns of species distribution, leading to an ecologically meaningful interpretation of the essential gradients in a few dimensions (Palmer 1993). Both vegetation classification and ordination analysis were performed on a matrix containing ordinal transform values for all species according to van der Maarel (1979) replacing the modern nine-point Braun-Blanquet scale by the values 1-9. 13 species of the total flora occurring only at a single sample plot are eliminated from the species data set prior to TWINSPAN and CCA using PC-ORD program for windows version 5.0 (McCune and Mefford 1999). Therefore, a matrix of 10 species × 323 releves resulting from trnansect sampling was subjected to TWINSPAN and CCA. Eight soil parameters (WC, pH, TN, OM, TIC, fine sand, medium sand, coarse sand) and distance from shoreline were included for CCA. The following options for CCA were used in PC-ORD: row and column scores were standardized by centering and normalizing; ordination scores were scaled to optimize rows; site scores were linear combinations of variables, and a Monte Carlo test of significance was used with 9,999 randomizations.

    RESULTS

      >  The spatial distribution of plants

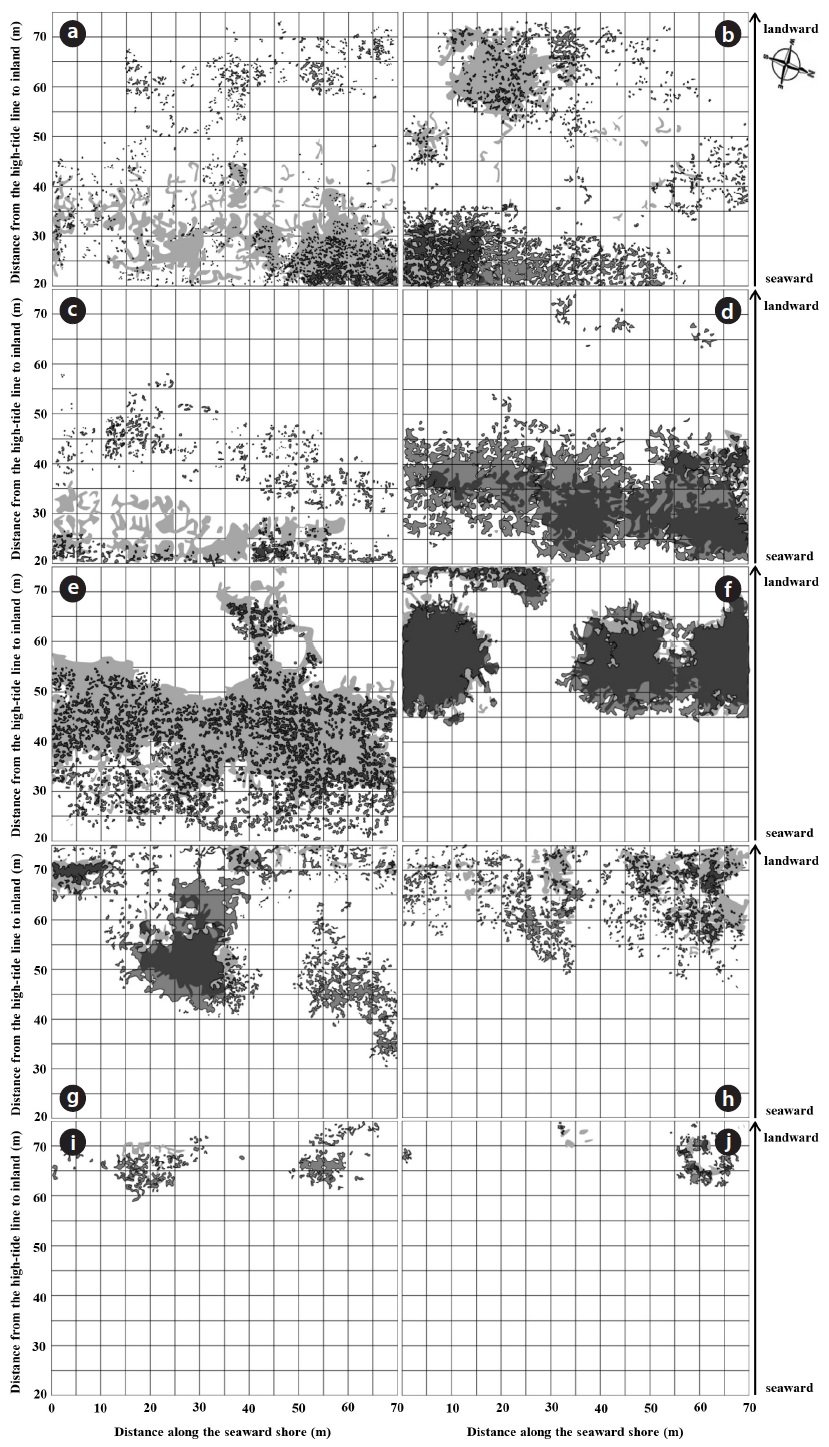
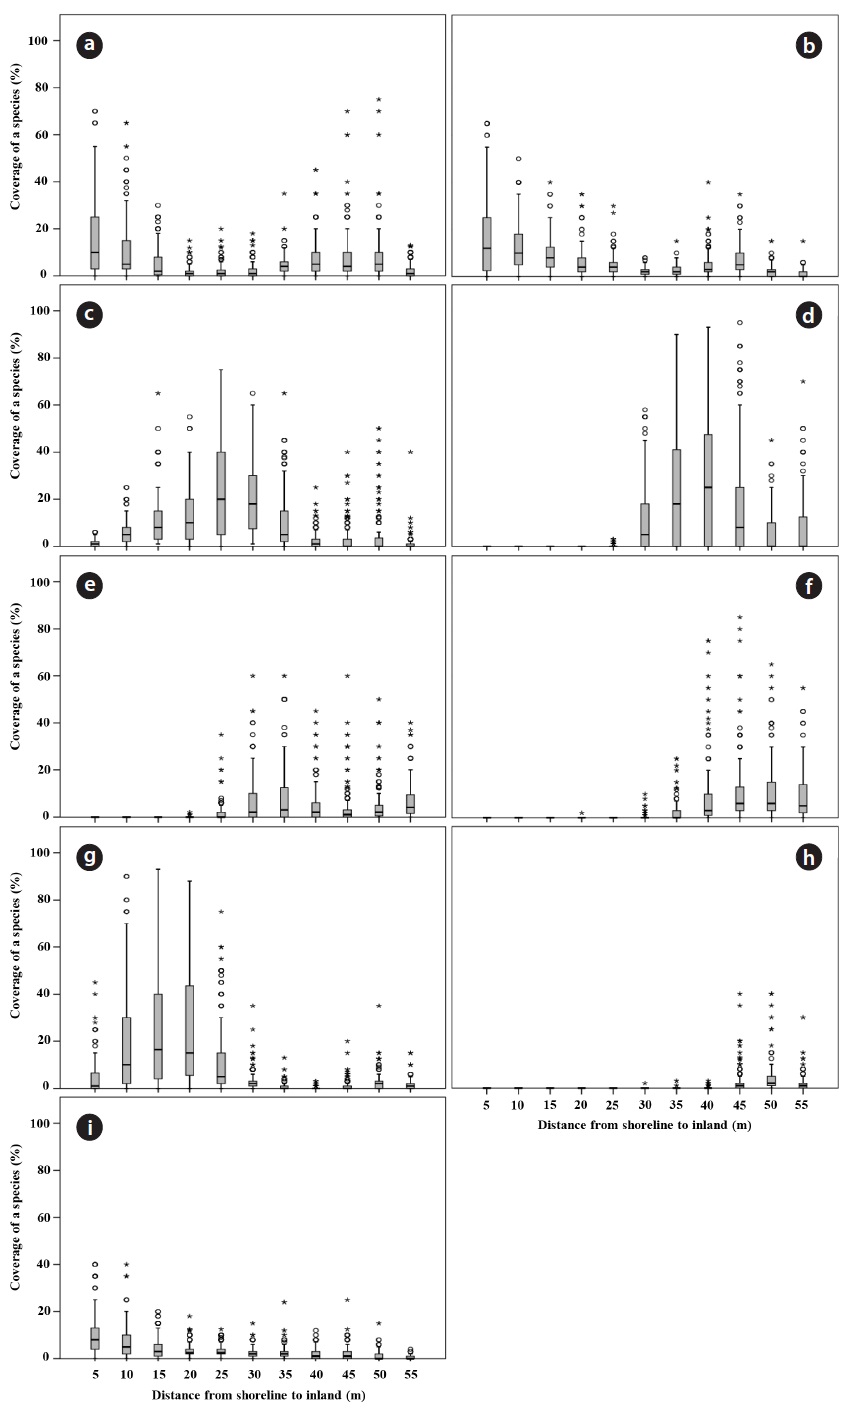
    A total of 23 species and 12 families were recorded in study site during the four year period. Dicotyledons comprised 65.2% of the total (15 species in 9 families), while the remainder consisted of 7 monocotyledons species (2 families) and one gymnosperm. The Gramineae family exhibited the highest number with 6 species, followed by Asteraceae, Chenopodiaceae and Convolvulaceae with 4, 3 and 2 species, respectively. Coastal sand dune plants constituted 68.2% of the recorded species. In terms of life duration, 13 species were perennials (56.5%), 8 species were annuals (34.8%) and 2 species were biennials (8.7%). The number of plant species increased with increasing distance from the shoreline. The highest diversity was observed on the relatively protected backdune. The number of plant species per quadrat was lowest at 20 to 25 m from the shoreline (mean 4.11 ± 0.41), and highest at 65 to 70 m (mean 7.40 ± 1.09). Change in the species composition in a seaward to landward direction was also evident (Fig. 2). The change of plant coverage along the distance from shoreline to inland during the four years was appeared using box-whisker plot from SPSS 18.0 because of seasonal fluctuation in plant cover (Fig. 3).

      >  Vegetation classification

    The application of TWINSPAN classification based on the coverage of 10 plant species recorded in present study site over four years led to the recognition of three vegetation groups that are associated with the following environments: foredune, semi-stable zone (hummocks), and stable zone.

    Group A. This group was characterized by Calystegia soldanella and included Elymus mollis, Carex kobomugi, Ixeris repens, C. soldanella, and Glehnia littoralis, which are herbaceous perennial plant found on foredune. E. mollis, C. kobomugi and I. repens occurred on seaward slop of foredune, 20 to 25 m from shoreline. The frequency of observation of three species decreased with increasing distance from the shoreline. The change of spatial distribution based on actual vegetation maps in June 2010 and 2013 was shown in Fig. 2. E. mollis expanded in foredune increased in 2013 compared to 2010. However, the distribution range of C. kobomugi in foredune decreased in 2013 compared to 2010. I. repens in foredune occurred with E. mollis in 2010, but expanded into the site dominated by C. kobomugi in 2013. C. soldanella was dominant along dune ridge and leeward slop of foredune in average coverage of 25.6% both at 35 m and at 40 m from shoreline over four years. G. littoralis was widespread in relatively low flat area between foredune ridge and hummock dunes in the semi-stable zone,about 20 m in width. G. littoralis expanded toward the seaward site in 2013.

    Group B. This group was characterized by Vitex rotundifolia found in semi-stable dune which was located about 45 m inland from the shoreline and the further landward zone and this species was the indicator species that separate into foredune and fixed dune. V. rotundifolia was abundant on hummocks in average coverage of 24.0% at 55 m and 30.0% at 60 m from shoreline over four years (Fig. 3). V. rotundifolia showed radial range expansion on hummocks in 2013 compared to 2010.

    Group C. Indicator species of this group were Zoysia macrostachya, Lathyrus japonicus and Cynodon dactylon. The spaces between hummocks were covered with grasses dominated by Z. macrostachya. This species expanded towards the seaward and the landward site. More protected areas behind dense V. rotundifolia and Z. macrostachya were stabilized by various species such as L. japonicus, C. dactylon and Imperata cylindrica var. koenigii with the admixture of the inland plants including Chenopodium album var. centrorubrum, Bidens bipinnata, Oenothera odorata, Erigeron canadensis, Digitaria sanguinalis with relatively low coverage. L. japonicus was rarely observed at 40 m from shoreline and its coverage increased with increasing distance from the shoreline. The distribution range of L. japonicus, C. dactylon and I. cylindrical var. koenigii increased in 2013 compared to 2010.

      >  Soil properties

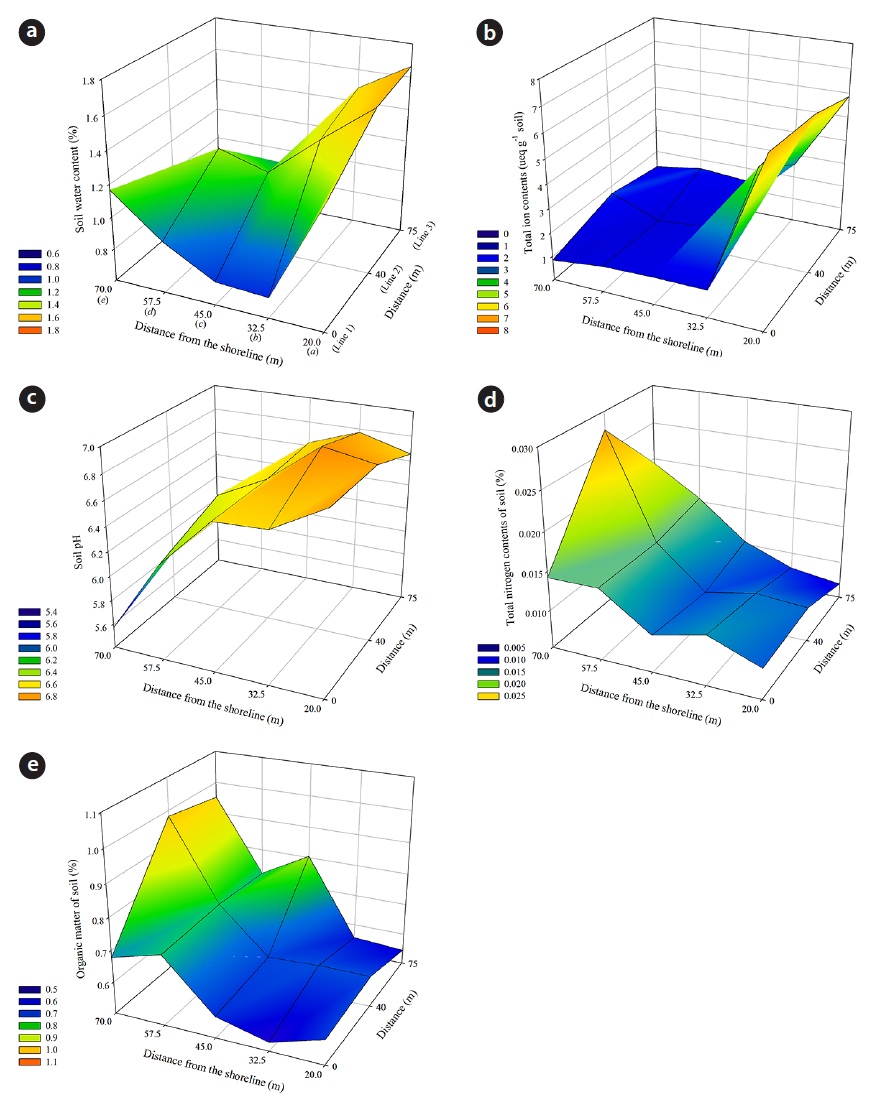
    The size of sand grains generally ranged from 160 μm to 1400 μm. The percent composition of soil particles at the 18 quadrats of the study site, as measured from April 2010 to October 2013, was divided into three size classes: 2.43 ± 0.91% of the sand particles were fine (100 to 250 μm); 58.63 ± 5.06% were medium (250 to 500 μm); and 38.55 ± 5.37% were coarse (500 to 1000 μm). These data indicate that the Goraebul coast primarily comprises relatively medium-textured material, as the highest proportion of soils were medium in texture, and consisted of particle sizes between 420 to 550 μm, The spatial distribution of the mean percent soil particle size during the study period is shown in Fig. 4. The proportion of sand grain size also varied among habitats of dominant species. A relatively high porportion of fine sand was shown at Line 1d dominated by V. rotundifolia and at Line 2b distributed with C. soldanella (χ2 = 137.22, P < 0.001, Kruskal–Wallis test). The proportion of medium sand also was found at Line 2b and 3b dominated by C. soldanella, and at Line 1d and 2d dominated by V. rotundifolia (Kruskal–Wallis test: χ2 = 225.84, P < 0.001). A relatively high proportion of coarse sand was found at Line 2a dominated by C. kobomugi on the seaward slope of the foredune and Line 2e distributed with L. japonicus (in spring) or G. littoralis (in summer and autumn) in landward site. The percentage of fine sand increased with increasing distance from the shoreline (Spearman correlation coefficient = 0.377**, P < 0.001), whereas the percentage of medium sand decreased (Spearman correlation coefficient = - 0.131**, P < 0.01).

    Soil WC, pH and TIC showed a negative correlation to the distance (P < 0.01), whereas TN and OM had a positive correlation to the distance (P < 0.01). The spatial pattern of soil properties was shown in Fig. 5. Soil WC ranged from minimum 0.02 to maximum 4.71%, and a significant difference of WC among soil sample plots was found (Kruskal-Wallis test: χ2 = 30.42, P < 0.01), but post-hoc test with Mann-Whitney U tests revealed no significant difference between soil sample plots.

    TIC were decreased with increasing distance from the shoreline, and a significant difference between soil sample plots was found (Kruskal–Wallis test: χ2 = 85.66, P < 0.001). Line 1a, 2a and 3a vegetated by E. mollis or C. kobomugi in the seaward slope of the foredune showed a higher TIC than those in Line 1e (L. japonicus in spring or I. cylindrical var. koenigii in summer) and 2d (V. rotundifolia) in landward sites (Mann-Whitney U test, P < 0.001, Bonferroni corrected α = 0.00048). The mean soil pH was pH 6.43, and pH values ranged from 4.46 to 8.27. Soil pH differed significantly among soil sampling plots (Kruskal–Wallis test: χ2 = 89.401, P < 0.001). Soil pH in pioneer zone located near the seashore (Lines 1a, 2a and 3a) was different in landward sites (Line 1e, 2e, 3e) (Mann-Whitney U tests, all P < 0.001, Bonferroni corrected α = 0.00048).

    TN increased with distance from the shoreline, and the highest values were observed in Line 2e and 3e comprised of various plants with L. japonica, G. littoralis and Z. macrostachya (ANOVA: P < 0.001, post hoc with Duncan’s test). The mean OM level in the foredune was below 0.01%, and the highest levels of OM were observed in Line 2e and 3e as TN (Kruskal–Wallis test: χ2 =69.294, P < 0.001, post hoc with Mann-Whitney U tests).

      >  Vegetation-Soil Relationships

    CCA ordination was performed using PC-ORD to identify which soil environmental gradients determined the distribution patterns of coastal sand dune plants (Fig. 6). The CCA eigenvalues for the first two ordination axes were 0.397 and 0.117, which explained 23.4% of the variance in the community data. The interset correlations of soil environmental factors with axis scores showed that distance from the shoreline had a higher correlation with first axis, followed by OM, TN, and TIC. Soil pH and fine sand had relatively high correlation with first and second axis. Cor-relation with medium and coarse sand was the significant soil property along the second axis. Soil WC showed the lowest correlation with first and second axis.

    Coastal sand dune species occurred on the landward such as V. rotundifolia, Z. macrostachya, L. japonicus, C. dacylon and I. cylindrica var. koenigii was closely related to the distance from the shoreline. V. rotundifolia occurred in the semi-stable zone were related to the proportion of fine sand. Soil TIC was related to the E. mollis occurred on the seaward slop of foredune and C. soldanella in dune ridge and low flat area behind the dune ridge. Soil pH was related to the distribution of C. kobomugi. The proportion of medium sand size was closely related to the G. littoralis, which widely distributed in the low flat area behind foredune ridge. Z. macrostachya, L. japonicus, C. dacylon and I. cylindrical var. koenigii were related to the soil TN and OM.

    DISCUSSION

    The phytosocialogical study on plant species distribution of the East Coast in Korea has been described in other studies (Jung and Kim 1998, Min and Je 2002, Kim 2005, Han et al. 2013), and the patterns of species distribution in the site that we studied was similar with it described in earlier studies. Kim (2005) classified communities on sand dunes by TWINSPAN, CCA, and detrended canonical decorrespondence analysis (DCCA): C. kobomugi, E. mollis, and V. rotundifolia were found to be the dominant species plotted on the east, the west, and the peripheral coasts of Jeju Island, respectively. In the present study, the results of TWINSPAN and CCA were consistent with each other. Among the 9 environmental variables, the CCA analysis indicates that eight (distance, fine sand, medium sand, coarse sand, soil pH, OM, TN and TIC) are important in affecting the plant communities in Goraebul sand dune (Fig. 6). The CCA result showed that axis 1 represented distance from the seashore, and two species groups according to the distance were segregated significantly. It is important to note that the distance from the shoreline to inland are important factor controlling the plant distribution (Fig. 6). The spatial distribution of the vegetation is characterized by the minimum distance from the shoreline needed by the plants to survive long enough to build a mature foredune (Durán and Moore 2013). Angiolini et al. (2013) mentioned that distance from coastline may be the primary driver of changes in plant community composition and soil factors on the Mediterranean coast. The result of TWINSPAN classification indicated that V. rotundifolia in semi-stable zone is an important indicator species separating into two vegetation groups: foredune group and fixed dune group. The associations were separated along soil gradient far from the seashore.

    Understanding the mechanisms driving community assembly and shifts in plant distribution as species expand in newly favorable areas and decline in increasingly hostile locations has been an important focus in plant ecology. In the present study, the distribution of individual species changed from 2010 to 2013 (Fig. 2). The change of plant distribution is related to various variables such as edaphic conditions, climate and biotic interactions (Wisz et al. 2013, Beauregard and de Blois 2014), which could limit plant species’ ability to establish in areas newly within their niche. Species co-existence within communities, and species sorting along environmental gradients, are thought to be regulated by the degree to which species share similar adaptations (Kelly and Goulden 2008, Carboni et al. 2013).

    V. rotundifolia shrub with a wide distribution forming hummock dune is efficient in dune building and stabilization at back dune. Vegetative growth by the rhizomes and stolons and the lateral and vertical growth of V. rotundifolia allow this species to occupy this habitat permanently. The increase in soil volume around the plants alters the surrounding microclimate and the composition of the plant communities by selectively eliminating those species with a conservative growth habitat. Hesp et al. (2010) found that colonizing species both create and affect topography, and in turn, topography determines vegetation association and succession patterns. Moreno-Casasola and Espejel (1986) and Moreno-Casasola (1988) mentioned that local zonation patterns directly related to dune physiography (beaches, foreduns, slacks and stabilized area) and regional patterns produced mainly by soil.

    The texture of the sand on the sand dune ridges is typically finer than that of the beach and slack (Maun 2009). In this study, the highest percentage of soil particles of the size fraction 100-250 μm were found on hummuck dominated by V. rotundifolia and foredune ridge dominated by C. soldanella, indicating that both V. rotundifolia and C. soldanella communities were effective in trapping windblown sand, thus stabilizing soils through the high density of their vegetation coverage, as well as the morphological properties of these plants. The results on the proportion of soil particle size showed a transition in sand composition, particularly with respect to the proportion of fine sand size that occurred from the foredune ridge at 32.5 m to V. rotundifolia community at 57.5 m. G. littoralis, a deep-rooted perennial species, was found in the transition zone where sand was actively moving between foredune ridges and V. rotundifolia community, showing the relation with medium sand size.

    Ruocco et al. (2014) suggested that a distance to the coastline, mean grain-size, shoreline trend and OM as abiotic factors were found to be closely correlated with the distribution and composition of Mediterranean plant dune communities. Environmental gradients were observed over the distance from the shoreline to inland areas at the Goraebul coastal sand dune study site. WC, pH and TIC decreased with increasing distance from the shoreline, but TN and OM increased. Although the value of soil WC in seaward slops of foredune was relatively high comparison with other sites, the results of variance analysis and CCA showed no significant differences between moisture contents at the soil sampling site and had a low score for any of the axis, respectively, indicating that soil moisture in this dune system could not explain the spatial distribution of coastal plants. In the study by Ishikawa et al. (1995), although soil WC did not show significant differences among different distance from the shoreline, the increase of water availability with increasing distance from the shoreline was caused by an increasing proportion of fine sand at inland sites beyond 60 m.

    The distribution pattern of E. mollis and C. kobomugi can be explained by soil TIC and pH among soil properties, respectively. The higher level of TIC at the seaward site is likely due to the influence of seawater. Soil pH decreased with increasing distance from the shoreline, and the value of soil pH was low in the mixed herbaceous community comprised of L. japonicus, G. littorali, Z. macrostachya and various non-coastal sand dune plants at 65 to 70 m from shoreline. The accumulation of OM can lead to pH decrease as the distance increased. Soils exhibiting higher levels of stabilization in coastal sand dune were characterized by the deposition of nitrogen and OM. During dune slack succession, the underlying soil processes are acidification and OM accumulation (Sýkora et al. 2004). Soil OM accumulation during early succession depends largely on the production litters and dead roots, as a result nitrogen levels also increase (Berendse et al. 1998). In present study, stable zone farther inland with various herbaceous vegetation had higher amounts of OM than in foredune.

    TN was the highest in the L. japonicus in which organic debris accumulated, thus providing a more stabilized habitat compared with the pioneer region. Additionally, the L. japonicus could also contribute to the increase in nitrogen content due to the twice-yearly leaf production (occurring during the spring and autumn), which results in the continued production and the accumulation of a large amount of nitrogen containing litter at this site. Addition of nitrogen to the habitat seems to be caused a change in the species diversity and community composition due to the differential responses of species to total soil nitrogen concentration.

    The increase of OM and nitrogen contents in a stabilizing habitat can facilitate the arrival or spread of other species, particularly invasive species already established in a coastal sand dune system, and the introduction of new non-native species into the region. At the study site, inland species such as O. odorata, I. cylindrica var. koenigii, and E. canadensis were observed in the sites dominated by L. japonicus and Z. macrostachya. These results indicated that the difference in vegetation composition might have changed the soil properties as a providing the nitrogen matter to soils. Ishikawa et al. (1995) suggested that growth conditions become more hospitable with increasing distance from the shoreline. Kim (2005) suggested that in Korean sand dunes the impact of invasive and exotic species settled by artificial activities along the edges connecting with background forests and terrestrial ecosystems was found to be that they partially replaced native plants of high reproductive potential, thereby reducing the role of native species on the overall stabilization of theses sand dunes. The second, third and subsequent ridges may have little or no influence on the movement of sand, as the soil surfaces were stabilized and humus accumulated, thus fostering the development of soil structures. Therefore, the morphology of the subsequent dune ridges can be primarily influenced by vegetation rather than wind (Maun 1996).

    CONCLUSIONS

    The spatial distribution of plants in the Goraebul coastal sand dune system may result from the interactions between the plant species and environmental heterogeneity. The spatial pattern of soil was found to be associated to vegetation types. Although environmental factors may act alone or in combination with other factors, distance from shoreline, soil pH, TIC, spatial variability in soil particle size, and the accumulation of OM and nitrogen was closely related to the spatial distribution of species in study area. The sand width is important in dune formation and the sand transport. The results of SPS proportion, particularly with respect to the proportion of fine sand size suggest that the morphology of a dune and the pattern of sand movement are closely related to the occurrence and diversity of plant species, their density, and community structure. In nutrient-poor sandy soil, especially stable back dune, mixed herbaceous community comprised of nitrogen fixing L. japonicus, G. littoralis and Z. macrostachya have an important role in the increase of nitrogen and organic matter by continued production and slow decomposition of litter and acidification, which can facilitate the settlement or spread of other species with increased potential for improved soil structure development.

    The disruption of sand movement and beach erosion by construction and other anthropogenic activities in coastal sand dune could damage this coastal ecosystem. In order to maintain coastal ecosystem, it is therefore necessary to understanding of the controlling factors that are related to the distribution of various coastal sand dune plants. Sustainable management of dune system is imperative to maintaining its most beneficial environment and should take into account the positive effects of moderate sand movement.

참고문헌
  • 1. Angiolini C, Landi M, Pieroni G, Frignani F, Finoia MG, Gaggi C 2013 Soil chemical features as key predictors of plant community occurrence in a Mediterranean coastal ecosystem. [Estuar Coast Shelf Sci] Vol.119 P.91-100 google cross ref
  • 2. Baldwin KA, Maun MA 1983 Microenvironment of Lake Huron sand dunes. [Can J Bot] Vol.61 P.241-255 google cross ref
  • 3. Bang HJ, Lee GR 2011 Geomorphological properties and changes of Goreabul sand beach in Yeongdeok. [J Korea Geomorph Assoc] Vol.18 P.83-92 google
  • 4. Beauregard F, de Blois S 2014 Beyond a climate-centric view of plant distribution: edaphic variables add value to distribution models. [PLoS One] google cross ref
  • 5. Berendse F, Lammerts EJ, Olff H 1998 Soil organic matter accumulation and its implications for nitrogen mineralization and plant species composition during succession in coastal dune slacks. [Plant Ecol] Vol.137 P.71-78 google cross ref
  • 6. Carboni M, Acosta ATR, Ricotta C 2013 Are differences in functional diversity among plant communities on Mediterranean coastal dunes driven by their phylogenetic history?. [J Veg Sci] Vol.24 P.932-941 google cross ref
  • 7. Carboni M, Santoro R, Acosta ATR 2011 Dealing with scarce data to understand how environmental gradients and propagule pressure shape fine-scale alien distribution patterns on coastal dunes. [J Veg Sci] Vol.22 P.751-765 google cross ref
  • 8. Chen ZS, Hsieh CF, Jiang FY, Hsieh TH, Sun IF 1997 Relations of soil properties to topography and vegetation in a subtropical rain forest in southern Taiwan. [Plant Ecol] Vol.132 P.229-241 google cross ref
  • 9. Culter NA, Belyea LR, Dugmore AJ 2008 The spatiotemporal dynamics of a primary succession. [J Ecol] Vol.96 P.231-246 google cross ref
  • 10. Duran O, Moore LJ 2013 Vegetation controls on the maximum size of coastal dunes. [Proc Natl Acad Sci U S A] Vol.110 P.17217-17222 google cross ref
  • 11. Gilbert M, Pammenter N, Ripley B 2008 The growth responses of coastal dune species are determined by nutrient limitation and sand burial. [Oecologia] Vol.156 P.169-178 google cross ref
  • 12. Girad M, Lavoie C, Theriault M 2002 The regeneration of highly disturbed ecosystem: a mined peatland in sourthern Quebec. [Ecosystems] Vol.5 P.274-288 google cross ref
  • 13. Han YH, Lee YH, Kim JB, Cho KJ 2013 Vegetation characteristics of coastal sand dune in the East Coast. [J Korean Environ Res Tech] Vol.16 P.55-69 google
  • 14. Hesp P, Martinez M, da Silva GM, Rodriguez-Revelo N, Gutierrez E, Humanes A, Lainez D, Montano I, Palacios V, Quesada A, Storero L, Gonzalez Trilla G, Trochine C 2010 Transgressive dunefield landforms and vegetation association, Dona Juana, Veracruz, Mexico. [Earth Surf Process Landforms] Vol.36 P.285-295 google cross ref
  • 15. Ishikawa SI, Furukawa A, Oikawa T 1995 Zonal plant distribution and edaphic and micromeorological conditions on a coastal sand dune. [Ecol Res] Vol.10 P.259-266 google cross ref
  • 16. Jung YK, Kim JW 1998 Coastal sand dune vegetation in Kyungpook Province. [Korean J Ecol] Vol.21 P.257-262 google
  • 17. Kelly AE, Goulden ML 2008 Rapid shifts in plant distribution with recent climate change. [Proc Natl Acad Sci U S A] Vol.105 P.11823-11826 google cross ref
  • 18. Kim KD 2005 Invasive plants on disturbed Korean sand dunes. [Estuar Coast Shelf Sci] Vol.62 P.353-364 google cross ref
  • 19. Kim KH, Shin S, Widayati ATW 2013 Mitigation measures for beach erosion and rip current. [J Coast Res] Vol.1 P.290-295 google cross ref
  • 20. Lane C, Wright SJ, Roncal J, Maschinski J 2008 Characterizing environmental gradients and their influence on vegetation zonation in a subtropical coastal sand dune system. [J Coast Res] Vol.24 P.213-224 google cross ref
  • 21. Lortie CJ, Cushman JH 2007 Effects of a directional abiotic gradient on plant community dynamics and invasion in a coastal dune system. [J Ecol] Vol.95 P.468-481 google cross ref
  • 22. Lubke RA 1983 A survey of the coastal vegetation near Port Alfred, eastern Cape. [Bothalia] Vol.14 P.725-738 google cross ref
  • 23. Martinez ML, Vazquez G, Sanchez-Colon S 2001 Spatial and temporal variability during primary succession on tropical coastal sand dunes. [J Veg Sci] Vol.12 P.361-372 google cross ref
  • 24. Maun MA 1996 The effects of burial by sand on survival and growth of Calamovilfa longifolia. [Ecoscience] Vol.3 P.93-100 google
  • 25. Maun MA 2009 The Biology of Coastal Sand Dunes. google
  • 26. Maun MA, Perumal J 1999 Zonation of vegetation on lacustrine coastal dunes: effects of burial by sand. [Ecol Lett] Vol.2 P.14-18 google cross ref
  • 27. McCook LJ 1994 Understanding ecological community succession: Causal models and theories, a review. [Vegetatio] Vol.110 P.115-147 google cross ref
  • 28. McCune B, Mefford MJ 1999 PC-ORD: Multivariate Analysis of Ecological Data Version 4.20. google
  • 29. Mendoza-Gonzalez G, Martinez ML, Rojas-Soto OR, Vazquez G, Gallego-Fernandez JB 2013 Ecological niche modeling of coastal dune plants and future potential distribution in response to climate change and sea level rise. [Glob Change Biol] Vol.19 P.2524-2535 google cross ref
  • 30. Min BM, Je JG 2002 Typical coastal vegetation of Korea. [Ocean Polar Res] Vol.24 P.79-86 google cross ref
  • 31. Moreno-Casasola P 1988 Patterns of plant species distribution on coastal dunes along the Gulf of Mexico. [J Biogeogr] Vol.15 P.787-806 google cross ref
  • 32. Moreno-Casasola P, Espejel I 1986 Classification and ordination of coastal sand dune vegetation along the Gulf and Caribbean Sea of Mexico. [Vegetatio] Vol.66 P.147-182 google cross ref
  • 33. Palmer MW 1993 Putting things in even better order: The advantages of canonical correspondence analysis. [Ecology] Vol.74 P.2215-2230 google cross ref
  • 34. Ranwell DS 1972 Ecology of Salt Marshes and Sand Dunes. google
  • 35. Ruocco M, Bertoni D, Sarti G, Ciccarelli D 2014 Mediterranean coastal dune systems: Which abiotic factors have the most influence on plant communities?. [Estuar Coast Shelf Sci] Vol.149 P.213-222 google cross ref
  • 36. Smith T, Huston M 1989 A theory of the spatial and temporal dynamics of plant communities. [Vegetatio] Vol.83 P.49-69 google cross ref
  • 37. Sykora KV, van den Bogert JCJM, Berendse F 2004 Changes in soil and vegetation during dune slack succession. [J Veg Sci] Vol.15 P.209-218 google cross ref
  • 38. 1987 Soil Mechanics Level 1, Module 3: USDA Textural Soil Classification Study Guide. National Employee Development Staff, Soil Conservation Service. google
  • 39. van der Maarel E 1979 Trnasformation of cover-abundance values in phytosociology and its effects on community similarity. [Vegetatio] Vol.39 P.97-114 google cross ref
  • 40. van der Valk AG 1974 Mineral cycling in coastal foredune plant communities in Cape Hatteras National Seashore. [Ecology] Vol.55 P.1349-1358 google cross ref
  • 41. Wisz MS, Pottier J, Kissling WD, Pellissier L, Lenoir J, Damgaard CF, Dormann CF, Forchhammer MC, Grytnes JA, Guisan A, Heikkinen RK, Høye TT, Kuhn I, Luoto M, Maiorano L, Nilsson MC, Normand S, Ockinger E, Schmidt NM, Termansen M, Timmermann A, Wardle DA, Aastrup P, Svenning JC 2013 The role of biotic interactions in shaping distributions and realised assemblages of species: implications for species distribution modelling. [Biol Rev Camb Philos Soc] Vol.88 P.15-30 google cross ref
  • 42. Yoon HS, Park SY, Yoo CI 2010 Review of the functional properties and spatial distribution of coastal sand dunes in South Korea. [J Fish Mar Sci Educ] Vol.22 P.180-194 google
OAK XML 통계
이미지 / 테이블
  • [ Fig. 1. ]  Six transect lines (T1, T2, T3, T4, T5 and T6) designated for the survey of plant distribution across the gradient and 15 soil sampling plots (●) along three lines (Line 1, 2 and 3) placed at 0, 12.5, 25, 37.5 and 50 m (a, b, c, d and e) from seaward face base on the Digital Elevation Model (DEM), showing elevations obtained at the Korea institute of Ocean Science & Technology in June 2010. Red higher elevation (m) and blue lower elevation (m) in this figure legend. A, beach with no vegetation; B, zone from foredunes sparsely vegetated by sand dune species to densely vegetated by shrub and herbaceous species.
    Six transect lines (T1, T2, T3, T4, T5 and T6) designated for the survey of plant distribution across the gradient and 15 soil sampling plots (●) along three lines (Line 1, 2 and 3) placed at 0, 12.5, 25, 37.5 and 50 m (a, b, c, d and e) from seaward face base on the Digital Elevation Model (DEM), showing elevations obtained at the Korea institute of Ocean Science & Technology in June 2010. Red higher elevation (m) and blue lower elevation (m) in this figure legend. A, beach with no vegetation; B, zone from foredunes sparsely vegetated by sand dune species to densely vegetated by shrub and herbaceous species.
  • [ Fig. 2. ]  The change of plant distribution in June 2010 (gray) and 2013 (dark gray). (a) Elymus mollis, (b) Carex kobomugi, (c) Ixeris repens, (d) Calystegia soldanella, (e) Glehnia littoralis, (f) Vitex rotundifolia, (g) Zoysia macrostachya, (h) Lathyrus japonicus, (i) Cynodon dactylon, (j) Imperata cylindrica var. koenigii.
    The change of plant distribution in June 2010 (gray) and 2013 (dark gray). (a) Elymus mollis, (b) Carex kobomugi, (c) Ixeris repens, (d) Calystegia soldanella, (e) Glehnia littoralis, (f) Vitex rotundifolia, (g) Zoysia macrostachya, (h) Lathyrus japonicus, (i) Cynodon dactylon, (j) Imperata cylindrica var. koenigii.
  • [ Fig. 3. ]  The coverage changes of coastal sand dune plants. (a) Elymus mollis, (b) Carex kobomugi, (c) Glehnia littoralis, (d) Vitex rotundifolia, (e) Zoysia macrostachya, (f) Lathyrus japonicus, (g) Calystegia soldanella, (h) Cynodon dactylon, (i) Ixeris repens observed along transect. The box plots show the range of data over four years (2010 - 2013). The black line within the box denotes the median, the box gives the upper and lower quartile, which contains 50% of the data and the whiskers give the minimum and maximum of the data (N = 1848).
    The coverage changes of coastal sand dune plants. (a) Elymus mollis, (b) Carex kobomugi, (c) Glehnia littoralis, (d) Vitex rotundifolia, (e) Zoysia macrostachya, (f) Lathyrus japonicus, (g) Calystegia soldanella, (h) Cynodon dactylon, (i) Ixeris repens observed along transect. The box plots show the range of data over four years (2010 - 2013). The black line within the box denotes the median, the box gives the upper and lower quartile, which contains 50% of the data and the whiskers give the minimum and maximum of the data (N = 1848).
  • [ Fig. 4. ]  The spatial distribution of the mean percent of soil particle size over four years (2010 - 2013). (a) fine sand (100-250 μm), (b) medium sand (250-500 μm), (c) coarse sand (500-1000 μm).
    The spatial distribution of the mean percent of soil particle size over four years (2010 - 2013). (a) fine sand (100-250 μm), (b) medium sand (250-500 μm), (c) coarse sand (500-1000 μm).
  • [ Fig. 5. ]  The spatial distribution of mean values of soil properties over four years (2010-2013). (a) water contents (%), (b) total ionic contents (ueq g-1soil), (c) pH, (d) total nitrogen contents (%), (e) organic matter (%).
    The spatial distribution of mean values of soil properties over four years (2010-2013). (a) water contents (%), (b) total ionic contents (ueq g-1soil), (c) pH, (d) total nitrogen contents (%), (e) organic matter (%).
  • [ Fig. 6. ]  Canonical correspondence analysis (CCA) ordination diagram between the two-way indicator species analysis (TWINSAPN) groups (A-C) and environmental variables (black arrows). DIS, distance; OM, organic matter; TN, total nitrogen; TIC, total ion concentration.
    Canonical correspondence analysis (CCA) ordination diagram between the two-way indicator species analysis (TWINSAPN) groups (A-C) and environmental variables (black arrows). DIS, distance; OM, organic matter; TN, total nitrogen; TIC, total ion concentration.
(우)06579 서울시 서초구 반포대로 201(반포동)
Tel. 02-537-6389 | Fax. 02-590-0571 | 문의 : oak2014@korea.kr
Copyright(c) National Library of Korea. All rights reserved.