Recent increase of oil price has triggered a significant change in the ship design trends, the energy saving design. The efforts to achieve energy efficient ship are divided into two categories; drag reduction and propulsion efficiency enhancement. Historically, more attention has been paid to the hull form optimization toward the reduction of wavemaking resistance than the turbulence control for the frictional drag reduction. However, the frictional drag accounts for about 70~80% of total drag of slow and full hull ships. This makes the frictional drag reduction significant for the energy saving design.
The frictional drag of ship is attributed to the wall shear stress of the turbulent boundary layer flow around the hull surface. The wall shear stress of turbulent boundary layer is in turn closely associated with the organized coherent structures such as hairpin vortices in the turbulent boundary layer flow. Various strategies of turbulent flow control toward either destruction or attenuation of such organized coherent structures have been proposed during several decades. From the viewpoint of reliability, the passive techniques such as riblet (Walsh, 1980; Beckert and Bartenwerfer, 1989), compliant coating (Choi et al., 1997) and Large Eddy BreakUp device (LEBU) is more suitable for the marine application. Hefner et al. (1979) conducted the experiments with LEBU to reduce the skin friction downstream of the LEBU devices and achieved 24% of drag reduction compared to undisturbed flat plate levels. The LEBU devices directly interact with and change the large eddy structures, thus interruptting the production loop and reducing the bursting events causing surface stress. Schoppa and Hussain (1998) claimed that the imposition of a large-scale vortical control flow into turbulent boundary layer flow could lead to promising skin-friction reductions.
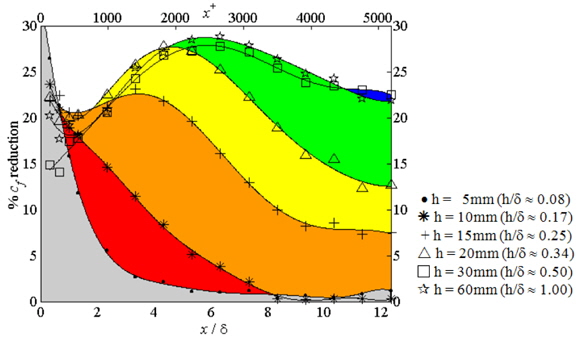
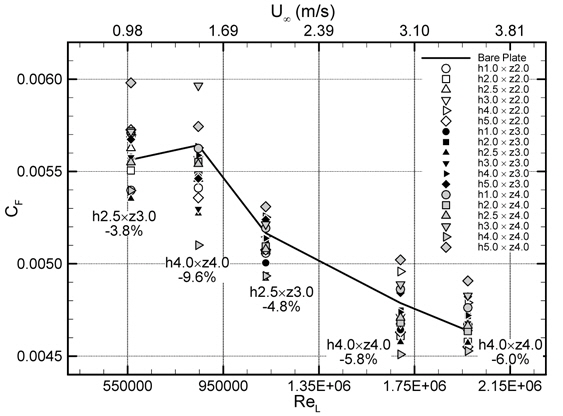
Hutchins and Choi (2002) and Hutchins (2003) introduced the idea of the outer-layer vertical blades, an array of thin vertical plates in the turbulent boundary layer. This array chops off large scale coherent structures of turbulence, thereby disconnecting the link between outer and inner layers. The height and the spanwise spacing were varied to find optimal values. As seen in Fig. 1, the skin friction reduction effect attains a maximum of 30% when the height of the blade h is approximately 50% of the local boundary layer thickness δ at the position of the blade in the undisturbed boundary layer without blades (h/δ = 0.5 ). In this case, this maximum occurs at the position of six boundary layer thickness downstream of the blade ( x/δ = 6). Recently Park et al. (2011) investigated the frictional drag reduction capability of the outer-layer vertical blades. Whilst Hutchins (2003) demonstrated only the reduction local skin friction effect in the downstream of the blades, the towing tank measurements of Park et al. (2011) clarified the practical applicability by considering the device drag of the blades. It was found that the outer-layer vertical blades array achieved maximum 9.6% drag reduction, as presented in Fig. 2.
The present study is an extension of the previous research of Park et al. (2011) with a view to assessing the feasibility of the outer-layer vertical blades for three-dimensional flow around a ship model. The blades arrays were attached on the flat surfaces of a KVLCC model and a series of model tests in towing tank were carried out to investigate the resistance (CTM) reduction efficiency and the improvement of stern wake distribution with varying geometric parameters.
>
Model ship and flow conditions
For the present model test, 300
[Table 1] Principal particulars of 300k KVLCC.
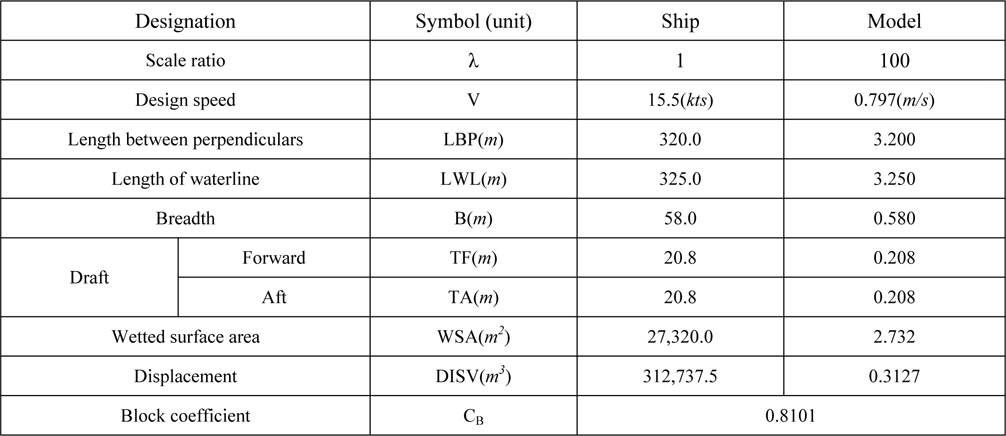
Principal particulars of 300k KVLCC.
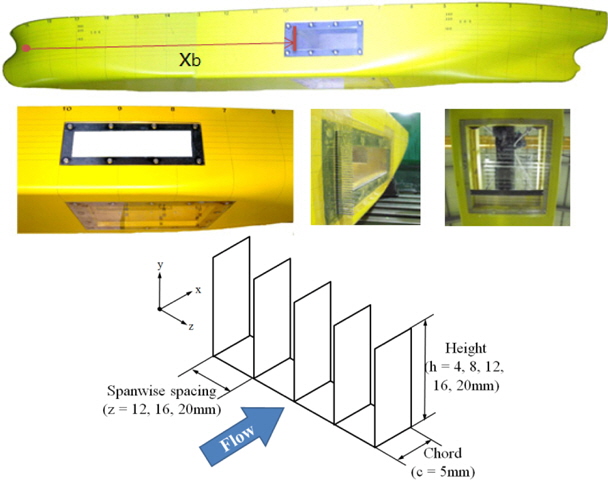
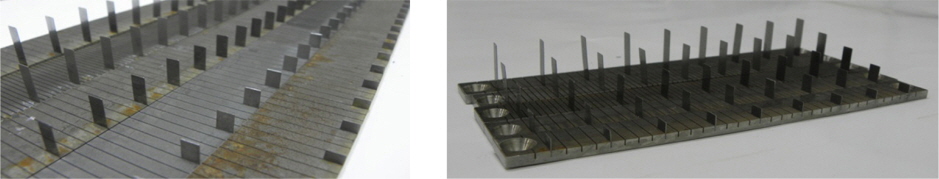
The vertical blades were constructed from 0.2

Here, Re x0 corresponds to the Reynolds number of the fictitious origin and the value Re x0 = 1.5×10⁵ was used. The value of the streamwise distance x is given as Xb = 1.6
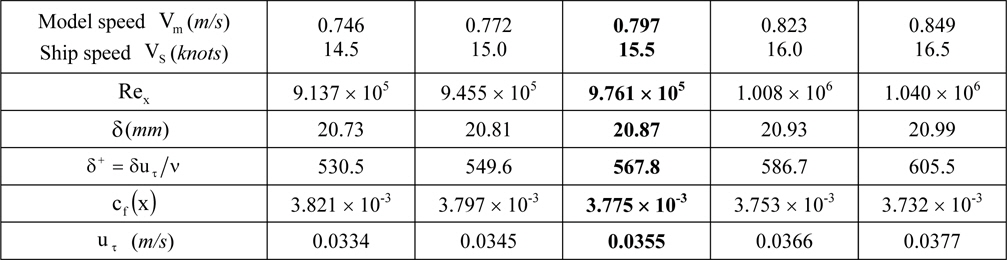
[Table 2] Flow condition in the present study.

Flow condition in the present study.
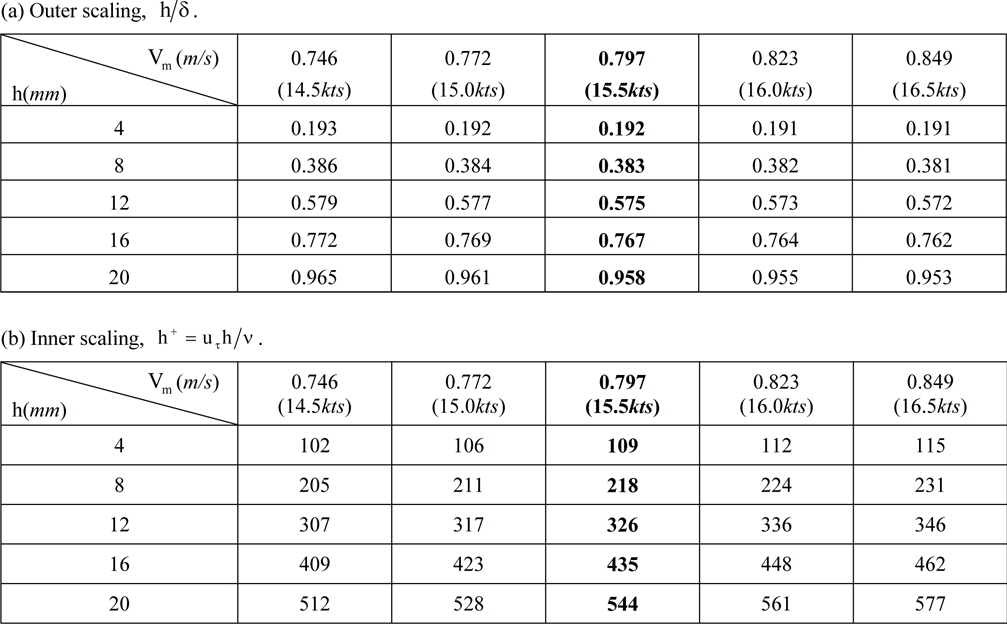
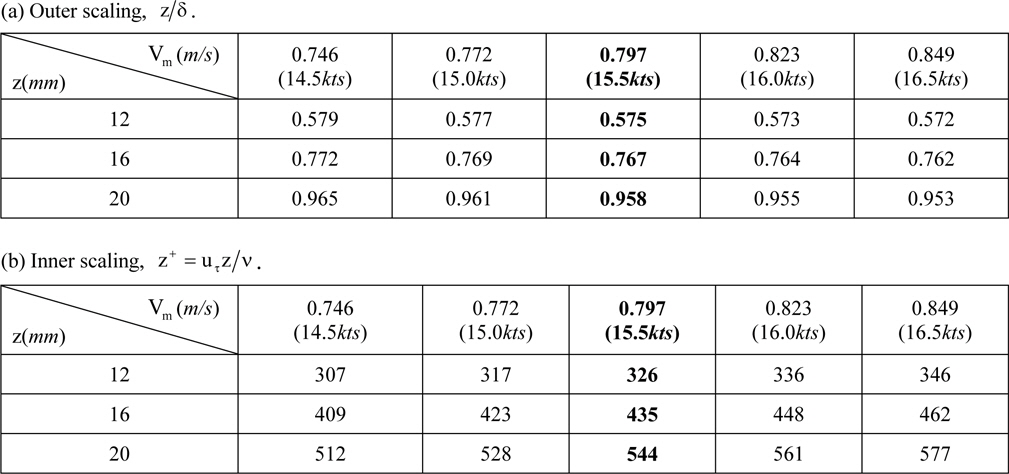
Table 3 (a) and (b) represent the nondimensional blade height with respect to the varying freestream velocity based on the outer scaling h/δ and the inner scaling uτh/ν, respectively. Similar data are tabulated in Table 4 (a) and (b) regarding the nondimensional blade spacing, z/δ and uτz /ν. The blade height was chosen to be smaller than the boundary layer thickness δ . According to Park et al. (2011), blades protruding out of the boundary layer contribute to the device drag only without any skin friction reduction effect. In this study, a total of 15 combinations resulting from 5 heights and 3 spacings were selected for towing tank. Each array is referred to by the blade height and the spanwise spacing,
[Table 3] Nondimensional blade height with respect to varying freestream velocity using.

Nondimensional blade height with respect to varying freestream velocity using.
[Table 4] Nondimensional blade spacing with respect to varying freestream velocity using.

Nondimensional blade spacing with respect to varying freestream velocity using.
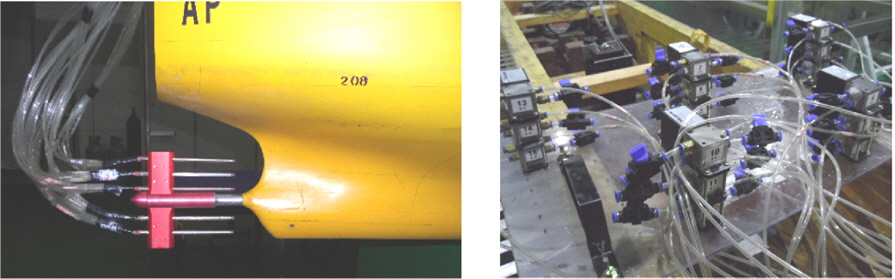
The measurements were performed in the towing tank facility of Pusan National University. The dimension of the towing tank is 100
>
Effect of geometric variation of vertical blades on the resistance reduction in model scale
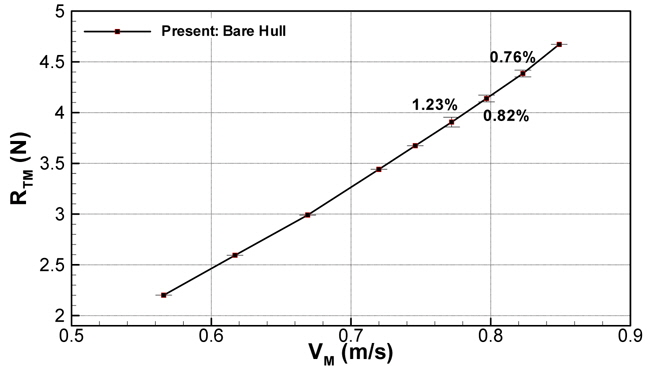
In Fig. 6, the resistance RTM of the baseline case, bare hull without the vertical array in the present study is plotted as a function of model speed VM(
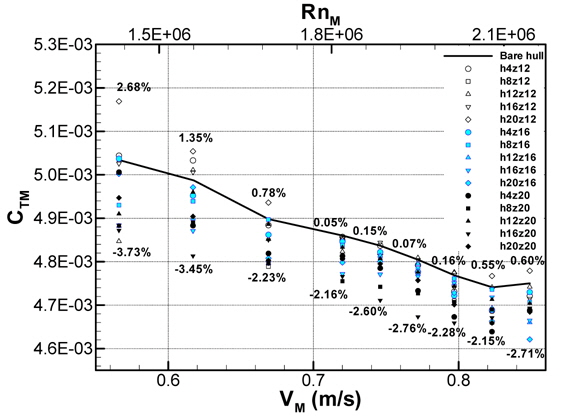
Fig. 7 shows the total drag coefficient CTM of total 15 cases with varying blades configuration along with the bare hull case. It is seen that the installation of the vertical array led predominantly to the reduction of CTM with some exceptions at lower speeds. Since the vertical blades array is located below the waterline, the variation of resistance is caused by the change of turbulent boundary layer around the ship hull. Therefore, the CTM reduction in the present study results from the skin frictional drag reduction by vertical blades array identified by Park et al. (2011). The positive and negative figure at each ship speed represent maximum percentage of CTM increase and decrease, respectively. A closer inspection of Fig. 7 indicates that maximum reduction of CTM becomes reasonably uniform for speeds VM over 0.66
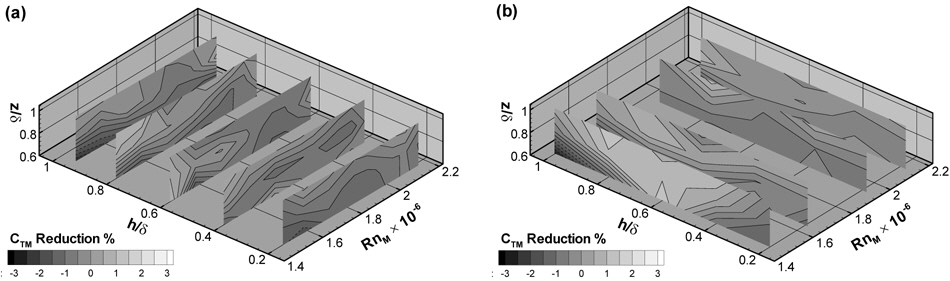
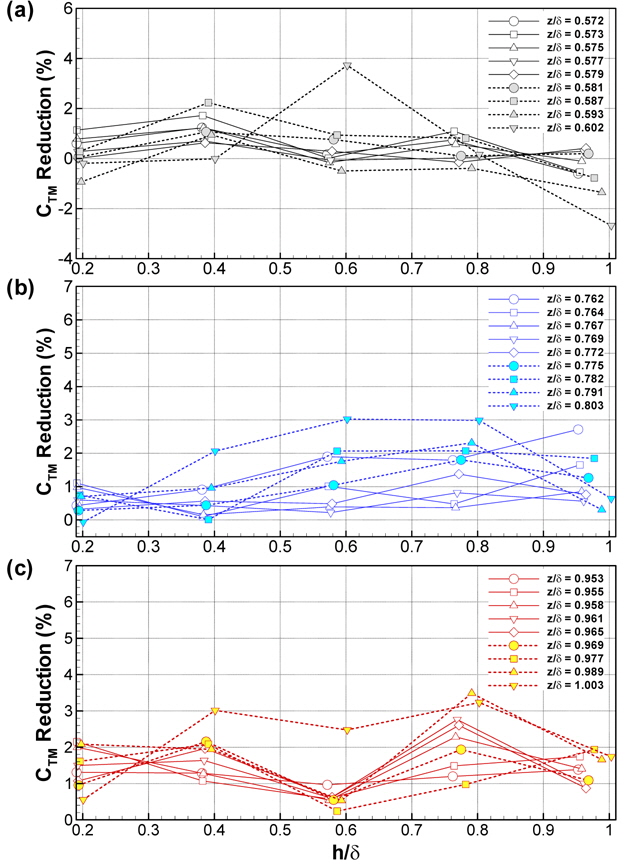
In order to delineate the effect of blades geometry on CTM, the percentage CTM reduction (1 – CTM / CTM0)×100 is depicted in Fig. 8 in a parameter space of h/δ, z/δ and Reynolds number of model RnM. The CTM of bare hull is noted as CTM0. The positive values correspond to CTM reduction. The geometric parameters are nondimensionalized using outer scaling method. This is because the optimal height h was found to scale with the outer variables such as the boundary layer thickness δ (Park et al., 2011). As seen, three-dimensional parameter spaces are divided to subplanes where the 2-D contour plots are drawn with one parameter being fixed. At a first glance, the CTM reduction effect is most noticeable for the lowest speed near 0.57
As mentioned in the introduction, the local skin friction reduction by means of vertical blades array was first demonstrated by Hutchins and Choi (2002) and Hutchins (2003). According to Fig. 1 showing their results, the local skin friction reduction effect persists up to x+ ≈ 5,000 (x/δ ≈ 12). It is also seen that the maximum local skin friction reduction becomes saturated for blade height h/δ > 0.5. However, from the aspect of downstream persistence, it is implied that the higher blade height, the longer is the skin friction reduction sustained. There are two factors affecting the resistance reduction by the vertical blades in the present study. First, the total drag reduction is an integrated effect of local skin friction reduction along the downstream distance. Second, it is notable that the distance between the vertical blades array to stern corresponds to approximately 80δ in the present study. These factors account for the optimal height h/δ = 0.6 ~ 0.8 observed in this study.
>
Effect of geometric variation of vertical blades on the wake distribution
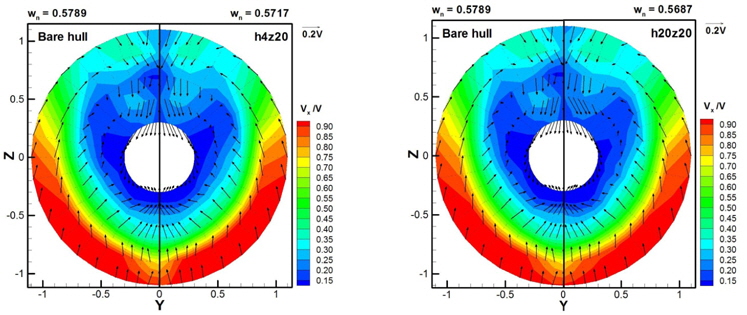
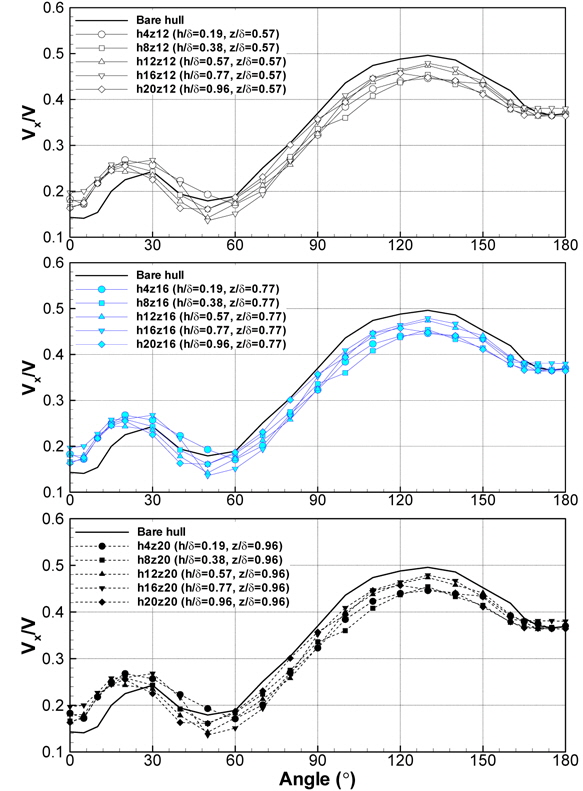
In the present study, assessment has been extended to the wake distribution affected by the vertical blades array. This is based on the assumption that the change in the turbulent boundary layer which led to the drag reduction might as well affect the wake distribution. Fig. 10 illustrates such variations in wake distributions for a couple of blade configurations, h4z20 and h20z20, in comparison with the wake in bare hull case. The nominal wake fractions wn in both cases are shown to decrease, but only slightly. The wake distributions also remain essentially the same with slightly noticeable acceleration of axial velocity component Vx (plotted in colored contours) in the dead water region near θ = 0°. Taking the distance between the blades array and the propeller plane, the marginal effect of blades on nominal wake is quite natural. With a view to investigating the effect of blades array on the wake flow, the axial velocity distributions along the azimuth angle at r = 0.7
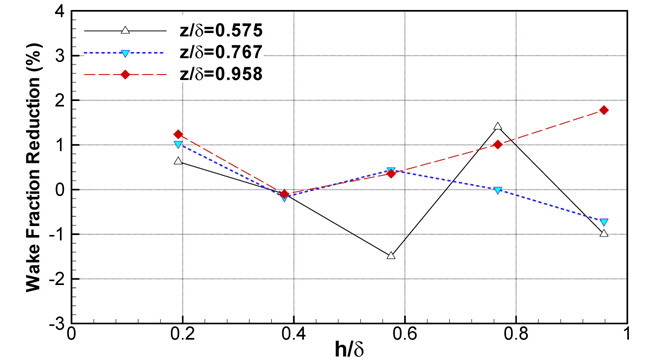
Fig. 12 gives percentage wake fraction reduction (1 – wn/wno)×100 as a function of nondimensional blade height h/δ for fixed nondimensional blade spacing z/δ. Here, wno refers to the wake fraction for bare hull case with wno = 0.5789. No conspicuous trend is found, which implies that the influence of vertical blades is not dominant enough to make a significant change in wake flow. In the overall, the effect of vertical blades on wake distribution is only marginal. Installing the blades array nearer to the propeller would lead to substantial change in wake, but that would in turn diminish the resistance reduction effect because the area of downstream influenced area becomes smaller.
In the present study, an experimental assessment in towing tank has been made of the resistance reduction and wake modification capability of the outer-layer vertical blades, which is attached to the mid-section of a 300
It is worthwhile to mention that the present vertical blades array has a scaling issue arising from the Reynolds number dependence. Together with the previous study of Park et al. (2011), however, it has been consistently found that the influence of the present outer-layer vertical blades on the boundary layer flow scales with the outer variable,