도시지역은 토지이용 변화, 교통량 증가, 인구집중, 불투수면의 증가 등으로 인하여 강우시 유출유량 및 비점오염물질 유출량이 높은 지역이다. 도시지역의 늘어난 유출유량과 비점오염물질은 하천의 수질악화 및 수생태계에 악영향을 끼치며 이러한 영향은 Low Impact Development (LID) 기법을 활용하여 물 순환 구축을 통해 저감할 수 있다. 한국은 연간 총강수량의 80% 이상이 여름철에 집중되지만 발생 강우량의 80% 이상이 10 mm 이하의 소규모 강우이다. 따라서 10 mm 이하의 소규모 강우에 대응 가능한 비점오염저감시설을 개발할 시에는 물 순환 구축을 통한 비점오염원 관리가 효율적으로 가능하다. 본 연구에서는 이러한 한국의 강우사상에 적용 가능한 침투여과시설을 개발하여 강우계급에 따른 시설의 효과검증을 수행하였다. 본 시설은 시설면적이 유역면적에 비하여 1.75%임에도 불구하고 누적 강우량 10 mm일 때 40% 이상의 높은 강우유출 저감량을 보였다. 이러한 높은 물 순환 효과는 비점오염물질 저감에도 크게 영향을 끼쳐 강우 계급 10 mm 이상에서 대부분의 오염물질이 60% 이상 저감되는 것으로 나타났다. 본 연구결과는 토지이용이 집약적인 도심지에서 약 2%의 LID 면적만으로도 효과적인 강우유출량 및 비점오염 저감으로 도시내 물환경문제를 개선할 수 있을 것으로 판단된다.
Various land uses accumulate pollutants during the dry period and these pollutants are eventually washed off with the stormwater during the rainfall event. Such NPS pollutants generated in urban areas cause water quality deterioration and affect the health of aqua-ecosystem, since they have high contents of particulates, heavy metals, chemicals and toxic materials (Boxall and Maltby, 1995; Kim et al., 2006; Maltby et al., 1995; Perdikaki and Mason, 1999; Son et al., 2008).
In order to reduce the water quality deterioration caused by NPS pollutants, the Korea Ministry of Environment (MOE) implemented various policies to manage the NPS discharges. NPS management policies and treatment facility installation in companies and application of total maximum daily load were the typically performed NPS management techniques. The pollutant mass loading of Korea's four major rivers as of 2010 was accounted for about 67% of the total water pollution, and by 2020 it was expected be greater than 70% (MOE, 2012). With continuous point source management, the biodegradable organic pollutants (e.g. BOD) in the rivers tend to decline, however the non-biodegradable organic matters continually increase. For the mentioned reason, implementation of the NPS management techniques became significantly essential (MOE, 2006).
In particular, application of low impact development (LID) techniques was ere necessary in order to control the NPS negative effects (MOE, 2012). The LID techniques have been adopted and applied by the U.S. and Europe since the 1990s, aiming at ecosystem preservation, water circulation restoration and environmental impact reduction through introducing decentralized stormwater techniques for various uses. The principle of a LID technique was to efficiently manage NPS pollutants generated after a land area development, while maintaining pre-hydrological function such as infiltration, retention and evapo-transpiration (DER, 1999). Most of the LIDs implemented were infiltration trenches, infiltration basins, vegetated swales, bioretention cells and constructed wetlands. The infiltration trenches and infiltration basins were regarded as the most basic LID structure compared to the other facilities. By adding vegetation and limiting the infiltration capabilities, a bioretention cell or a constructed wetland could be developed. This research aims to evaluate the applicability of an infiltration and filtration (IF) facility in various rainfall events based on the obtained volume and pollutant reduction capabilities from the monitored 29 events. Rainfall events in Korea were concentrated during summer and more than 80% of the annual rainfalls were 10mm and less. Based on this, the research also evaluates the volume and pollutant reduction of the IF facility during a 10 mm or less storm event. Finally, the results could suggest the design and maintenance/repair guidelines of an IF facility that could be implemented in Korea.
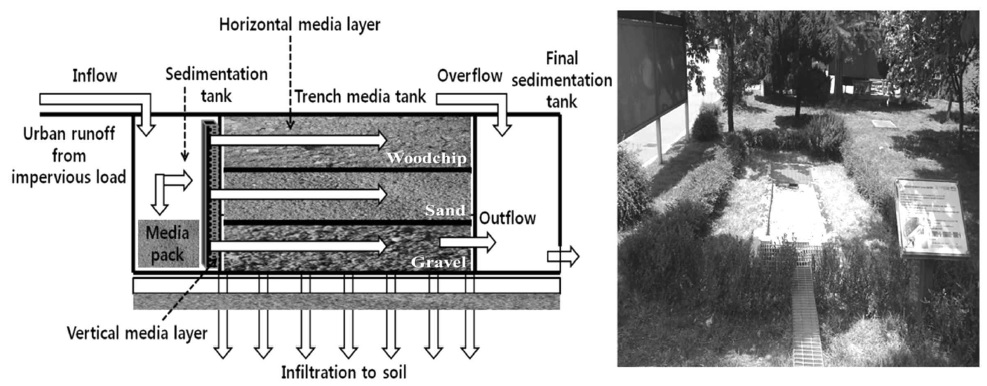
The IF facility considered in the research could primarily reduce runoff volume, adsorb and filter stormwater pollutants. To evaluate the effects of the facility's volume and NPS pollutants reduction, and the facility's performance in various rainfall events, this research built a test-bed. The test-bed was installed in the landscaping areas within a college campus for feasibility of monitoring so that it can treat rainfall runoff generated from the road surface. The IF facility structure consists of an initial stage sedimentation tank, a trench media tank to remove fine particles, soluble materials and a final stage sedimentation tank (Fig. 1). Table 1 shows the characteristics of the facility, and the facility area is 1.8% of catchment area. The initial sedimentation tank has infiltration function; woodchips and gravels were inserted to decrease the inflow (runoff) velocity and separate large particle matters. The trench media tank has multi-media layers of woodchip, sand and gravel to absorb and remove fine particles and soluble materials and to expand the active place of microorganisms.
[Table 1.] Characteristics of the IF facility

Characteristics of the IF facility
Manual grab sampling technique was utilized for all storm events. Runoff samples were collected using a 4-L container in the inflow and outflow part of the IF facility. Four samples were taken every five minutes for the first 15 min with the first sample collected as soon as runoff was evident, and two samples after 30 min and one hour, and more samples hourly thereafter until a maximum of 12 samples. For most of the shorter events, the scheme was modified by adjusting the number of samples until the runoff flow ended (Kim and Kang, 2004a). Continuous measurements were also performed to monitor the inflow and outflow flow rates every five or ten minute interval using a 5-L capacity of graduated measuring container and a timer. The rainfall data were taken from the Korea Meteorological Administration (KMA) with reference from weather stations nearby the monitoring sites. Other in situ data gathered during the monitoring include antecedent dry day (ADD), rainfall duration, average rainfall intensity, and time before effluent starts of the hydraulic retention time (HRT). For volume reduction evaluation, a water balance determination method was used as shown in Equation (1). Cumulative inflow rainfall and runoff were measured, and the difference between rainfall volume and runoff volume was regarded as the volume of infiltration, retention and evaporation.

Where,
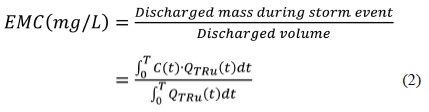
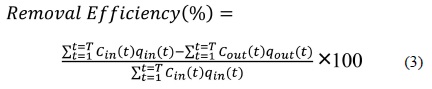
For the collected water samples, TSS, COD and metals (Cr, Fe, Ni, Cu, Zn, Cd, Pb) were analysed based on Standard Methods for the Examination of Water and Wastewater (APHA, AWWA, and WEF, 1992). Event mean concentration (EMC) for each monitored rainfall was calculated using Equation (2) (Irish et al., 1998; Sansalone and Buchberger, 1997).

Where,
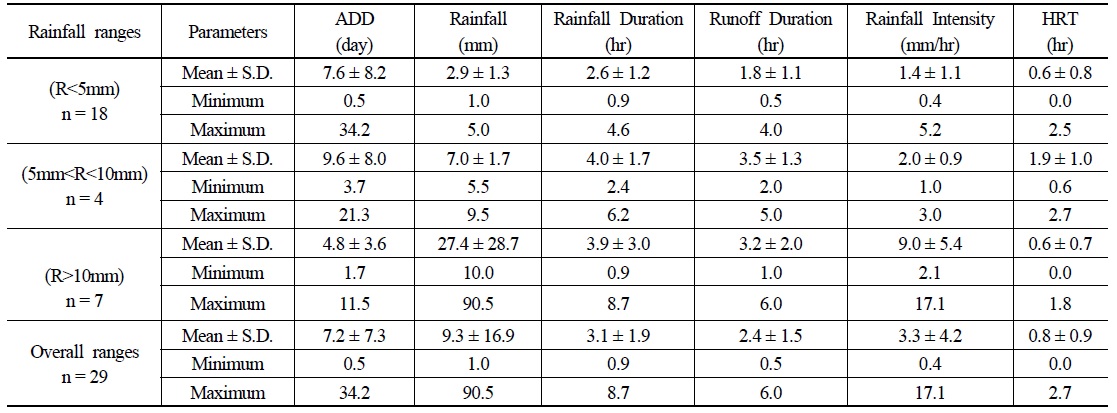
To evaluate the volume reduction and NPS pollutants removal efficiency of the IF facility, 29 times of monitoring in total were carried out from May 2009 to August 2013. Table 2 summarizes hydrological characteristics of the measured rainfall events. Mean rainfall depth of the 29 rainfall events was 9 mm. This monitoring result is judged to properly reflect climate characteristics of the study area, since 70~80% of Korea's annual rainfall events are small-scale with 10mm and less of rainfall (Maniquiz et al., 2012).
[Table 2.] Summary of the average event table based on varying rainfalls

Summary of the average event table based on varying rainfalls
3.2. Comparison of Inflow and Outflow in IF facility
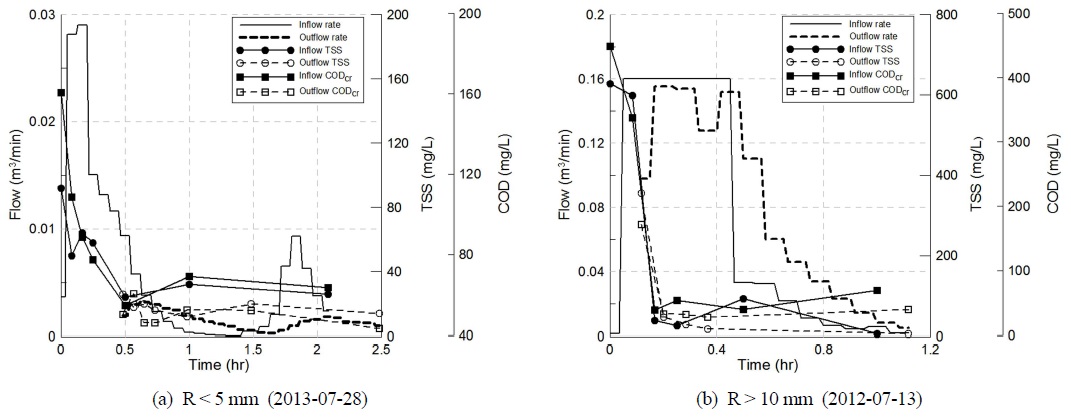
Fig. 2 showed the hydro-pollute graph of inflow and outflow part of the IF facility. The runoff entering the inflow part of the facility from the road showed a typical first flush phenomenon in which highly concentrated pollutants are discharged at the earlier part of a runoff (Kim and Kang, 2004b). The outflow concentration of the pollutants is very low and stable, compared to the inflow. Such characteristic means that the IF facility is properly constructed for pollutant removal. Reduction of water volume and peak flow can be estimated through flow curve change of inflow and outflow. The peak flow of inflow was very high, but the peak flow of outflow was very low. Thus, IF facility can reduce delay runoff time, peak flow time, runoff and peak flow volume.
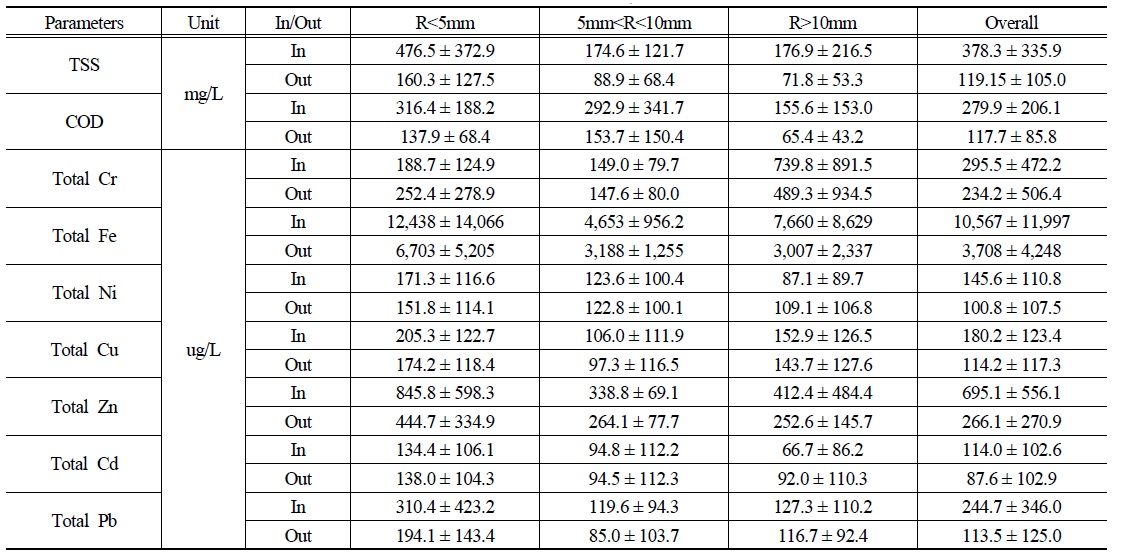
Table 3 shows the EMC calculation results of the IF facility in the three rainfall ranges (R<5mm, 5mm
[Table 3.] Summary of the EMC based on varying rainfalls (Mean ± S.D.)

Summary of the EMC based on varying rainfalls (Mean ± S.D.)
3.4. Flow Volume Reduction of the IF Facility
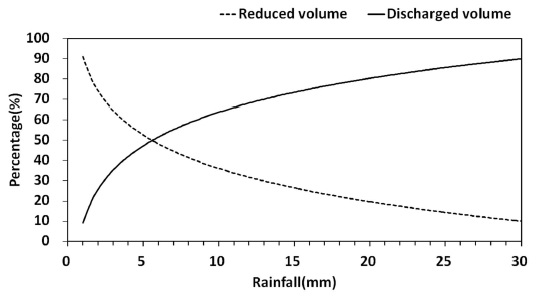
The regression plot displaying the relationship between the discharged and reduced volume with rainfall depth is presented in Fig. 3. The runoff volume reduced by the IF facility was assumed to have infiltrated the ground through the drain pipes, evaporated, and retained or stored in the system. The amount of volume reduced by the IF facility was higher compared with the volume discharged by the system up to approximately 5.5 mm rainfall wherein beyond this value, the percentage of volume discharged by the system was increased with a corresponding decrement in volume reduced by the system. Based on the storm events monitored, for rainfall of less than 5 mm, the system reduced 52% of the total runoff volume which entered the system. Meanwhile, for rainfall between 5 and 10 mm, the mean percentage of runoff volume that was reduced by the system was decreased to 36%. Beyond 10 mm, the average volume which was reduced by the system was further decreased to 26%. Since 70~80% of the total numbers of storm events per year in Korea were mostly below 10~20 mm, the IF facility is appropriate to be applied in Korea (Maniquiz et al., 2010).
3.5. Removal Efficiency of the IF Facility
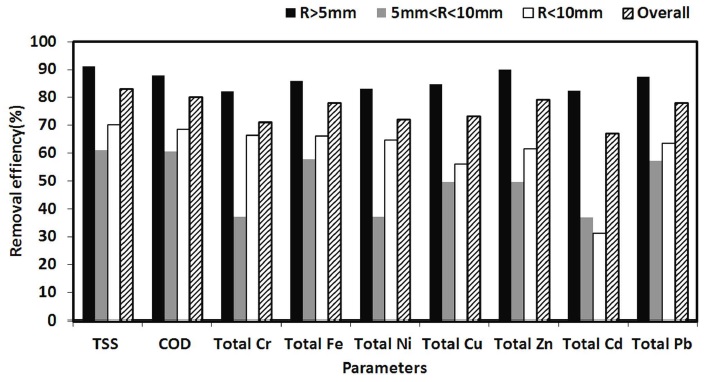
Fig. 4 shows average removal efficiency of each pollutants in the IF facility for different ranges of the rainfall depth. The average removal efficiency of pollutants in the IF facility was 83% in TSS, 80% in COD and 67~79% in metals. The removal efficiency was very high, compared to a filtration facility or constructed wetland (MOE, 2014). In the case of 5 mm and less in the rainfall range, more than 80% of removal efficiency was shown in all pollutants. On the other hand, over 10 mm in the rainfall range, at least 60% of removal efficiency was exhibited in all pollutants. This finding suggested that volume reduction through infiltration and retention mechanisms in the facility plays an important role in reducing the pollutant loads from road runoff (Geronimo et al., 2013).
Urbanization arises from many environmental, hydrological and ecological problems such as distortion of the natural water circulation system, increase in nonpoint source pollutants in stormwater runoff, degradation of surface water quality, and damage to the ecosystem. Due to the increase in impervious surface by urbanization, developed countries apply low impact development (LID) techniques as an important alternative to reduce the impacts of urbanization. Therefore, this research aims to evaluate the applicability of an infiltration and filtration (IF) facility in various rainfall events based on the obtained volume and pollutant reduction capabilities. The following conclusions were drawn through this research: