Energy and infrastructure are the pre-conditions for economic growth. Energy production and energy consumption play an important role in the process of development because it impacts both aggregate supply and aggregate demand. Energy is a factor of the production process, and without energy, all of the machines will not be able to operate. In literature, most empirical studies recognize that reliable access to energy is important to growth both in a direct or indirect manner (Stern, 1993; Halicioglu, 2007; Apergis & Payne, 2010; Tang et al., 2015). According to the International Energy Agency, the demand for the total primary energy of the world will continue increasing (about 1.4% annually until 2035), which is true for both developed and developing countries. In Vietnam, electricity production is increasing by 13% per year, but electricity consumption is increasing by 17% per year. Therefore, many manufacturing sectors will have difficulties, and the level of Vietnam’s growth is also negatively affected.
Understanding and analyzing the relationship between energy and growth is important and of high academic and policy interest for three reasons.
As a country based on agricultural development, Vietnam also encountered a shortage of energy output for development. According to Vietnam Electricity Corporation, the demand for electricity consumption in industry sectors accounted for 52% in 2016, with the rate of growth increased by 17% per year. Before 1995, the power shortage took place provinces, adversely affecting the production, business and living life of people. On the date of May 27. 1994, the 500 kV North-South transmission power line was put into operation which made the power output spike. In the period 1990-1992, the level of electricity production growth is 5-6%, to the stage 1995-1997, the growth of electricity production is up to 18-19%. The level of economic growth in these two periods also indicates a major change. Before 1995, the level of average economic growth was 5.1%. After 1995, the average economic growth rate was up to 9.5%. There are many causes of Vietnam’s economic growth, but with the task of supplying enough electricity to maintain production, electricity production and consumption have contributed to Vietnam's economic development.
The rest of the paper is as follows: Section two provides the economic literature review about the relationship between energy consumption and economic growth in various countries. The research model and methodology are described in section three. Empirical results and discussion are given in section four while conclusions and policy implications are shown in the last section.
It is not to be denied that energy is considered revolutionized in the development. The role of energy in industrial production is enormous. Energy helps to develop most of the economic sectors as traffic, communication, metallurgy... In economic literature, the energy - growth links have been intensively analyzed by a variety of studies, but the empirical evidence more often than not remains controversial and ambiguous. The empirical results are categorized into four main groups. The first group of findings identifies that there is a uni-directional causality running from growth to energy consumption, confirming the so-called conversation hypothesis. That means the development of current economic activities will affect the demand for energy consumption in the future. The second group of empirical studies suggests the existence of bi-directional causality between energy consumption and economic growth, confirming the feedback hypothesis. These conclusions imply a joint effect between economic growth and energy consumption so that one affects the other in such a way that a decrease (increase) in economic growth decreases (increases) energy consumption levels and vice versa.
The third group of previous studies shows the existence of uni-directional causality running from energy consumption to economic growth. These results confirm what is known as the growth hypothesis. According to the growth hypothesis, economic growth is affected by energy consumption. As an implication, energy is a fundamental factor for any country to achieve a high and stable economic growth rate. Last, the fourth group of empirical studies provides evidence in support of the so-called neutrality hypothesis. According to this hypothesis, there is no causal relationship between economic growth and energy consumption. That means no effect runs from economic growth to energy consumption and vice versa.
The pioneering study of this topic is studied by Kraft and Kraft (1978). By applying a classical Granger (1969) causality test, their conclusion shows that there is a uni-directional causality running from economic growth to electricity consumption in the United State for the period 1947-1974, supported conversation hypothesis. Following the study of Kraft and Kraft (1978); Akarca and Long (1980); Yu and Hwang (1984) found no causality in the case of the United State for the period 1947-1979 with the same methodology. The conversation hypothesis was supported by the study of Abosedra and Baghestani (1989) for the United State; Cheng and Lai (1997) for Taiwan; Cheng (1998) for Japan; Cheng (1999) for India; Aqeel and Butt (2001) for Pakistan; Zamani (2007) for Iran; Lise and Van Montfort (2007) for Turkey; Ang (2008) for Malaysia; Zhang and Cheng (2009) for China; Bartleet and Gounder (2010) for New Zealand. To explain to the conversation hypothesis, the authors indicate to develop economic activities, it is necessary to use machinery. So, an increase in economic activities in the present will increase the demand for energy consumption in the future.
Following the pioneer study of Kraft and Kraft (1978), various studies have investigated the topic of energy-growth links which their findings seem to be mixed and ambiguous. The absence of consensus can be explained by the application of different estimation methods and data collected from developed and developing countries. Tsani (2010) using the Toda and Yamamoto (1995) procedure, the results show that there is a uni-directional causality running from GDP to energy consumption for Greece in the period 1960-2006, respectively. But, with the same methodology, Payne (2009), Soytas and Sari (2009) found no causal relationship between GDP and energy consumption in the United State in the period 1949-2005, for Turkey in the period 1960-2000. In addition, the growth hypothesis found in the study of Paul and Bhattacharya (2004) for India; Lee and Chang (2005, 2007) for Taiwan; Ho and Siu (2007) for Hong Kong; Odhiambo (2009) for Tanzania; Abosedra et al. (2009) for Lebanon; Chang (2010) for China; Alam et al. (2012) for Bangladesh; Akadiri et al. (2019) for South Africa… by applying the Vector Error Correction Model.
Moreover, Glasure and Lee (1997); Ghali and El-Sakka (2004); Dagher and Yacoubian (2012) employed Hsiao’s Granger causality test for Korea in the period 1961-1990, for Canada in the period 1961-1997, for Lebanon in the period 1980-2009. Their results show the presence of the feedback hypothesis. Authors of feedback hypothesis are often persuaded to suggest the implementation of a dual strategy, which means that economic growth should be associated with the waste of energy consumption. Using clean energy, explore new energy sources and the development of high technology are the best illustrations of effective energy consumption and economic growth. This hypothesis was supported by the study of Hwang and Gum (1991); Oh and Lee (2004); Tang (2009); Ziramba (2009); Belloumi (2009).
Nevertheless, Halicioglu (2009) examined the relationship between GDP and energy consumption in Turkey over the period of 1960-2005 by applying the ARDL model and Granger causality test. The results show the absence of a causal relationship that is consistent with the neutrality hypothesis. Fatai et al. (2004), Payne (2009), Soytas and Sari (2009) employed the Toda and Yamamoto procedure, the authors conclude that there is no causal relationship between GDP and energy consumption in the case of New Zealand, Turkey and United State. To explain the neutrality hypothesis, Apergis and Payne (2009) emphasized the energy-growth links are only significant in developed and developing countries. Because, in underdeveloped countries most of the factors for development, such as capital, infrastructure, education and high technology are limited. Economic activities are based on nature so that the demand for energy consumption is low.
Tang et al. (2015) analyzed the energy-growth links in Vietnam using the neoclassical Solow growth framework from 1971-2011. The results revealed that energy consumption has a positive impact on GDP in the long run. There is a uni-directional causality running from energy consumption to GDP. Long et al. (2018) employed the ARDL model, Toda and Yamamoto procedure over the period of 1990-2015 in Vietnam. They found evidence to conclude that electricity consumption has a positive impact on GDP per capita in both the short-run and long run. The causality test is the same as the conclusion of Tang
The main goal of this study is to investigate the
Data was collected from International Energy Agency (IEA) and United Nations Conference on Trade and Development (UNCTAD) over the period of 1980-2016. LnGDP is the logarithm of GDP per capita (at a fixed price of 2010, unit is US dollar). LnEC is the logarithm of total electricity consumption (unit is Billion kWh). “DT” is the dummy variable. If there exists a “
If β^2≠0 and have significant, that means there exists a “
Clearly, an estimate of Eq.1 only yields the long-run effects of exogenous variables. In order to analyze the short-run and the long-run impact of energy consumption, we employed the ARDL approach, proposed by Pesaran et al. (2001). Various econometric approaches have been used for short-run and long-run estimations such as an approach by Engle and Granger (1987), Johansen and Juselius (1990), Johansen (1996). The ARDL approach has some advantages, as follows:
where: Δ is first difference
β1, β2, β3, β4 are coefficients of the long-run impacts
α1, α2, α3, α4 are coefficients of the short-run impacts
ωt is the error
After confirmation that there exists cointegration among the variables in the long-run, Eq.2 will be estimated by Error Correction Model (ECM) as follows:
Where: m1, m2, m3, m4 are the optimal lag length of the variables calculated by the ARDL model following AIC, SC criteria. In Eq.3, if Ǝλ ≠ 0 and have significant which indicated that economic growth can itself adjust to long-run equilibrium after short-run “
Using the ARDL approach, we can identify the impact of energy consumption on economic growth in the case of Vietnam in the short-run and long-run. But, these results do not guide us about the causal relationship among the variables. In this study, we used the modified Wald test (MWald), proposed by Toda and Yamamoto (1995). The Toda and Yamamoto procedure is based on the Vector Autoregressive model. Using the VAR model, the causal relationship between LnGDP variable and LnEC variable is illustrated as follows:
4. Empirical Results and Discussion
4.1.1. Overview of the 500 kV North-South Transmission Power Line
Vietnam’s economy has changed rapidly in the past few decades, from an agricultural economy to a modern mixed economy. The GDP per capita has increased nearly 20 times, from USD 114 in 1990 to USD 2,109 in 2015 (at a fixed price of 2010). As a developing country with the advantages of geographic position, Vietnam is in a favorable condition for primary energy resources development such as wind, electricity, gas, hydro, solar and geothermal. But, the energy supply is always lower than consumer demand. This status is continuous and cannot be terminated soon. In 2015, the total primary energy supply of Vietnam was 70,588 KTOE, of which commercial energy accounted for 75.5% and non-commercial energy accounted for 24.5%. The growth rate of commercial primary energy supply grew by 9.5% per year. This rate was higher than the GDP growth rate during the same period, leading to the elasticity coefficient of commercial energy to GDP, greater than 1. Among commercial energies, natural gas had the highest growth rate with 13.4%/year. The growth rate of coal, oil products, and hydropower in the same period was 12.2%, 6.2% and 27.6% per year, respectively. Vietnam’s main drives for energy consumption growth include: Industrial growth, living household, and transportation. In 2016, the industrial sector is still the largest consumer with 43.0%, followed by the residential sector with 29.6% and the transportation sector with 22,7%.
Economic development in Vietnam has driven strong growth in electricity demand, which reflects rapid industrialization, an expansion of business and services and also rising household consumption in line with rising living standards. According to Vietnam Electricity Corporation, Viet Nam's energy demand increased rapidly between 2001 and 2017 with an estimated average growth of 11.3% per year. In 2016, the total demand for electricity consumption is 143 billion kWh and was predicted to continue to grow in the next 15 years.
Since 1995, Vietnam has moved from a position of energy exporter to a net importer. The power supply is insufficient to meet demand. Vietnam faces the prospect of an electricity shortage due to rapid economic growth in the Southern provinces. Thus, Vietnam still needs to import electricity from China and Laos. In May 1995, Vietnam officially entered the 500 kV North-South transmission power line exploits, with a full length of 1,487 km through 17 cities, provinces from Hoa Binh province to Phu Lam, Ho Chi Minh city. This helps to solve the local shortage of electricity production in Northern, Central and Southern areas in Vietnam. However, Vietnam's electricity losses are still at a high rate (average of 7.47%). In addition, the intensity of Vietnamese power consumption increased rapidly in the period of 2005-2017, while the world's tendency was not changed. In 2005, the power consumption of Vietnam is lower than in China. In 2017, it is roughly doubled compared to China and it is three times higher than the average of the world. In other words, to make 1 unit of income, Vietnam has three times of electricity consumption compared to the average of the world.
4.1.2. Descriptive Statistics
Data on the electricity consumption was collected from IEA and data on the economic growth was collected from UNCTAD in the period of 1980-2016. The descriptive statistics of variables is shown in Table 1.
[Table 1:] Descriptive Statistic
Descriptive Statistic
4.2 Empirical Results and Discussion
4.2.1. Unit-root Test
In economic literature, most of the economic variables are non-stationary. In order to avoid the empirical results may be spurious, we apply the unit root test to confirm the level of stationery among involving variables.
Stationary Test
In this study, following Augmented Dickey and Fuller (1981) (ADF test), Phillips and Perron (1988) (PP test), Zivot and Andrew (2002), we use unit root which includes structural breaks. The stationary test is presented in Table 2. With the null hypothesis (H0: Data is not stationary) against alternative hypothesis (H1: Data is stationary), the unit root test shows that all of the variables are stationary at first difference with both ADF and PP test. According to the Zivot and Andrew test, there exists a structural break in 1995. This result implies that the conditions to apply the ARDL approach, the Toda and Yamamoto test are satisfied. The existence of “
4.2.2. Cointegration Test
Because all of the variables are stationary at I(1), so we have to check the cointegration among variables in the long run. Recent studies, a new econometric approach known as the Bound test and the ARDL approach proposed by Pesaran
[Table 3:] The Result of Bound Test
The Result of Bound Test
The Bound test shows that there exists cointegration among the variables, but it is not interested in structural breaks. To examine the cointegration among variables in which data have a structural break, we employed the Gregory and Hansen (1996) test. Accordingly, the value of the test statistic (-6.37) is lower the critical value (-6.02) and is significance at 1%. This result indicated although there exists a structural break, also there is cointegration among variables in the long run. The Gregory and Hansen test also shows that the break has appeared in 1995. It is time for Vietnam to enter the 500KV North-South transmission power lines to exploit. The Gregory and Hansen test is presented in Table 4.
[Table 4:] Result of the Gregory and Hansen Test
Result of the Gregory and Hansen Test
4.2.3. Error Correction Model
After confirmation of cointegration, we apply the error correction model to determine the impact of energy consumption on economic growth in the short run. The advantage of the ARDL approach is auto-choice the optimal model based on AIC, HC information criterion, and R square. With the data of Vietnam, the optimal ARDL model is ARDL(2,4,2,1). That means, m1 is 2, m2 is 4, m3 is 2 and m4 is 1, in Eq.3. The coefficients of the short-run impacts are shown in Table 5.
[Table 5:] Results of the Error Correction Model
Results of the Error Correction Model
The coefficient of ECM is λ = -0.4435 and significant at 1% level. Thus, it also validates the confirmation of the cointegration among variables. The error correction mechanism advocates that economic growth re-adjust to long-run equilibrium after each short-run “
4.2.4. Diagnostic Test
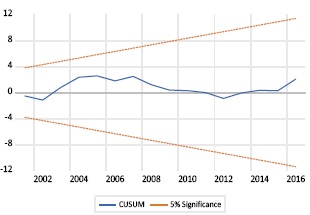
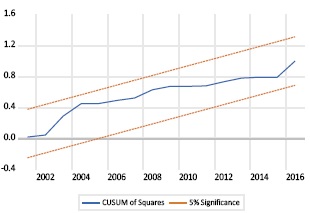
The next step is a diagnostic test. We will conduct additional diagnostic tests including: Heteroskedasticity test, autocorrelation test, distribution of residuals, functional test. In order to test the stability of the long-run coefficients and the short-run dynamics, we employed the cumulative sum of recursive residuals (
Diagnostic Test
The outcome of the four diagnostic tests of Lagrange multiplier, serial correlation, Ramsey’s misspecification, Jacque and Bera normality and the autoregressive conditional heteroscedasticity tests show that our model passed all the four diagnostics tests because we cannot reject any hypothesis and this demonstrates the consistency and efficiency of our model. Next, Figure.1a and Figure.1b show that the blue lines for both CUSUM and CUSUMSQ lie within the critical bounds and are significance at 5%. This is statistical evidence to conclude that our model is stable and the estimated results are reliable.
4.2.5. The Coefficients of Long-run Impacts
To determine the impact of energy consumption on economic growth in the long run, we also employed the error correction model. Accordingly, the coefficient of LnEC variable is positive and significant at 1% level. These results implied that economic growth is affected by energy consumption in the case of Vietnam. The coefficient of DT variable is positive and significant at 1% level. This is also evidence to conclude that the impact of electricity consumption on economic growth is different between the period of 1980-1994 and the period of 1995-2016. This conclusion is also confirmed by the coefficient of (EC.DT) variable is positive and significant at 1% level. That means the contribution of electricity consumption in economic growth is lower in the period of 1995-2016. Exactly, the contribution of electricity consumption in economic growth is 0,55% over the period of 1980-1994 and is 0,404 % (= 0,554 - 0,150) in the period of 1995-2016.
[Table 7:] The Long-run Coefficient
The Long-run Coefficient
With an estimated result in Table 7, we can confirm whether short-run and long-run cointegration exists or not. But this ARDL approach does not guide us about the causal relationship among the variables. Lastly, we employed the Toda and Yamamoto (1995) procedure to test the Granger causality. The null hypothesis is (H0: No causal relationship) against the alternative hypothesis (H1: There exists a causal relationship). According to the result in Table 8, there is bi-directional causality between electricity consumption and economic growth, supported feedback hypothesis.
[Table 8:] Result of the Causality Test
Result of the Causality Test
In recent years, Vietnam's economic strategy is to diversify and deepen into the world economy. This strategy helps Vietnam attract more foreign direct investment capital, support for domestic economic growth, while also creating enormous pressure to provide adequate and timely power output for economic activities. The investment in the construction of national power lines is absolutely right. According to the author, the contribution of electricity consumption in economic growth is lower over the period of 1995-2016 is suitable. Because the advancement of high technology helps the production process and smart electricity equipment will consume less electricity.
5. Conclusion and Policy Implications
The main goal of this study is to investigate the impact of energy consumption on economic growth in the case of Vietnam. With the data collected from 1980-2016, we employed the ARDL approach proposed by Pesaran et al. (2001) for short-run and long-run cointegration dynamics. We also applied some diagnostic test, CUSUM and CUSUMSQ test show that our model is stable and suitable for policymaking. Lastly, to check the causal relationship among the variables, we applied the Toda and Yamamoto (1995) procedure. The empirical result of this study affirms the three following main findings:
Based on the empirical results, the authors suggest some consideration when applying these results in practice, as follows: