For the construction of coastal harbor structures, there is a need to build offshore structures on the sea, unlike in the land. The foundation works of an offshore structure entails a considerable construction cost, the workability drops to a significantly low level, and in particular, the foundation works at the deep waters is a very difficult task. If the foundations of that structure are replaced with the suction piles, it will be advantageous as they can greatly save the construction costs and shorten the construction period, and make the construction works at the deep sea easier. The offshore structures built by the conventional construction method are very difficult to demolish once their construction has been completed. However, the structures which constructed with suction piles can be rapidly demolished or reconstructed if faults are found or if it is necessary to demolish them.
Suction piles, one of the foundation types used for offshore structures, can support the structure under or above the water by connecting mooring lines up to the suction pile. Up to date, there are a few studies on the bearing capacity of the suction pile considering the dimension, pullout angle, and loading point, etc. There have been several studies on the maximum resistance of the suction pile under the horizontal load with respect to different loading points, but little studies have been conducted on the movement patterns of the suction pile under the horizontal load.
Therefore, the laboratory model tests on the short piles to simulate the suction piles were conducted in this study, to investtigate the behavior characteristics of the suction pile. After embedding a short pile with a very small ratio of the pile length/ diameter into sands under the water, then the horizontal load test was conducted. From the results of model tests, the horizontal pullout resistance of the short pile was evaluated and the characteristic of lateral movements was also investigated.
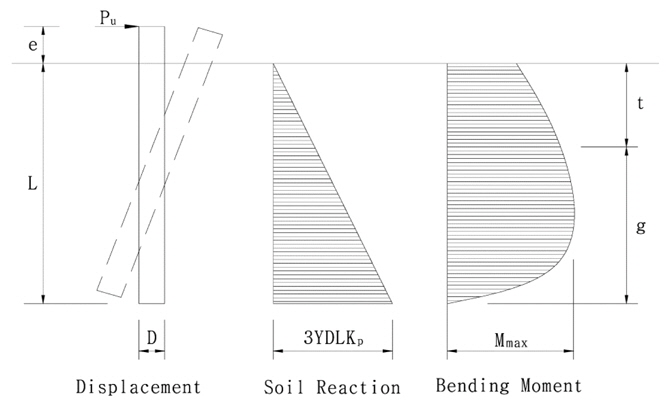
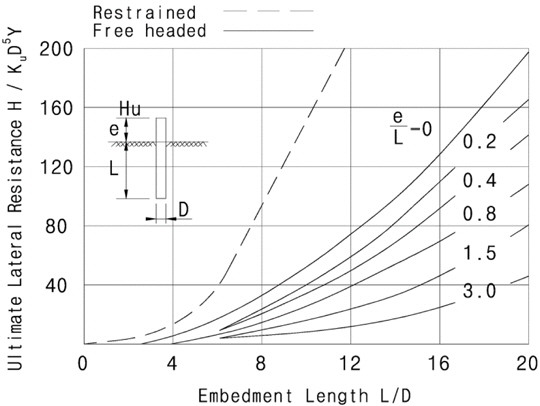
The conventional studies on estimating the horizontal pullout resistance of the pile embedded in sands have been conducted by Raes (1936), Broms (1964), Petrasovits and Award (1972), Meyerhof (1995), Prasad and Chari (1999), etc., and the bearing capacity of the suction pile was studied by Cho (2000), Bang and Cho (2002), Cho and Bang (2002), Kim and Jang (2011), etc. The Broms method is generally referred to as a representative method for calculating the lateral resistance of the pile in practice. Broms (1964) assumed the distributions of the deformation modes, soil reactions, and bending moments of a short pile under the horizontal load in sands, as shown in Fig. 1, where
[Fig. 2] Broms’s solution for ultimate lateral resistance of the short piles in sands (Broms, 1964).
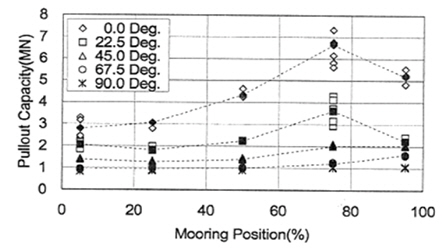
Bang and Cho (2002) reported that the pullout resistance of the suction anchor was affected by various factors, such as the soil type, loading direction, loading point, embedment depth, and anchor size etc. They reported, as the results of the study on the suction anchor under the lateral load, that the maximum lateral resistance occurred when the lateral load was acted at a depth of 0.8
MODEL TEST APPARATUS AND PROCEDURES
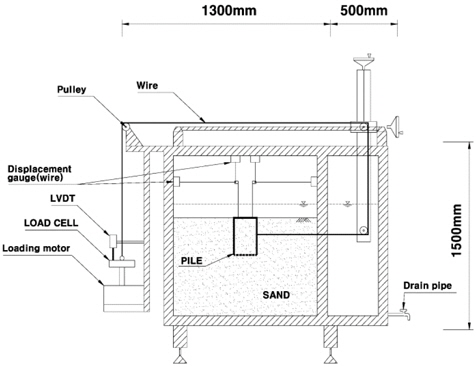
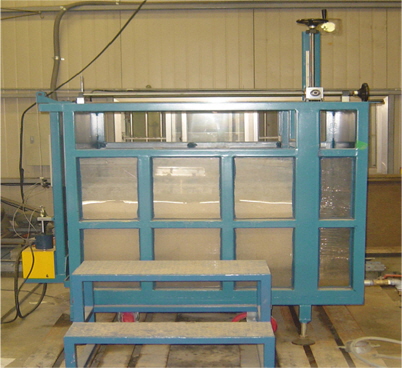
In this study, the laboratory model tests were conducted to investigate the pullout behavior characteristics of the suction pile which was embedded in sands under the water. The model soil chamber was manufactured using steel materials and acrylic to prevent the frame from being deformed by the loading. The size of the model apparatus was 1,280
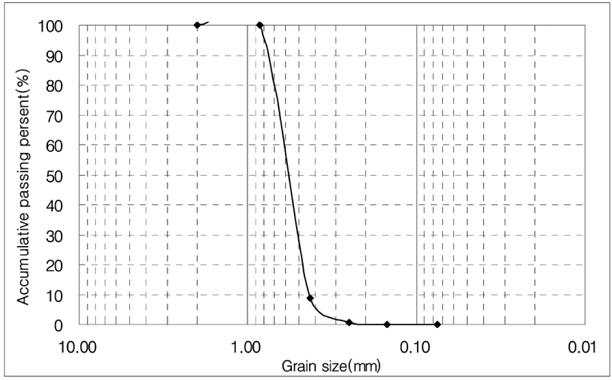
The Jumunjin standard sands were used in the model test. The grain size distribution curve of the sands as shown in Fig. 7 was classified as SP according to the Unified Soil Classification System (USCS), with a uniformity coefficient (Cu) of 1.38, a coefficient of curvature (Cc) of 0.97, and specific gravity (Gs) of 2.62. The relative density of the sands was determined by measuring the unit weight using the cans installed in the sand layer. The minimum dry unit weight (γdmin) of the sands was measured by falling the sand particles free in the water, and the maximum dry unit weight (γdmax) was measured by the Bowles method (Bowles, 1978). The minimum and maximum dry unit weight was 13.43 and 16.37
The piles used in the model test were made of the acrylic with three different diameters (D = 100, 150, and 200
The procedures of model test were as followed. First, the sand layer was built up in the model chamber by pouring the sand particles under the water. The model pile was embedded to the desired location, and then the model pile was connected to the pullout loading system with the wire. And four wire displacement transducers were separately connected at two positions of the pile top, in the vertical and horizontal directions respectively. The horizontal and vertical displacements of the pile were measured during loading the pullout to investigate the moving behavior of the pile. As the pile moved in the vertical and horizontal directions and simultaneously rotated during the horizontal load test, at least the coordinates at two points of the pile should be measured to investigate the exact moving path of the pile. For such purpose, in this study, two steel bars were connected to the top of the model pile to measure the coordinates at two points, and the exact moving path of the model pile was investigated using the measured coordinates. The pullout load was applied at a speed of 2
MODEL TEST RESULTS AND DISCUSSION
In this study, the model tests were executed to investigate the behavior characteristics of the suction pile embedded in sands under the horizontal pullout load. The short pile with a small ratio of L/D to simulate the suction pile was used in the model tests, and the horizontal loading test was executed with varying the diameter and length of the pile, and loading point. The pile with a diameter of 200
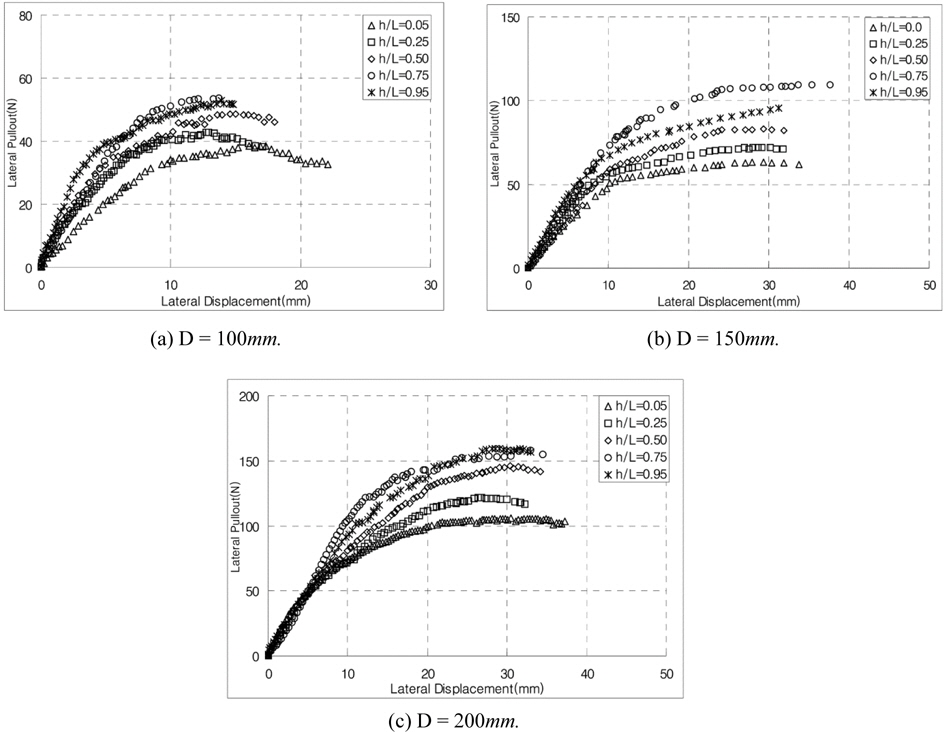
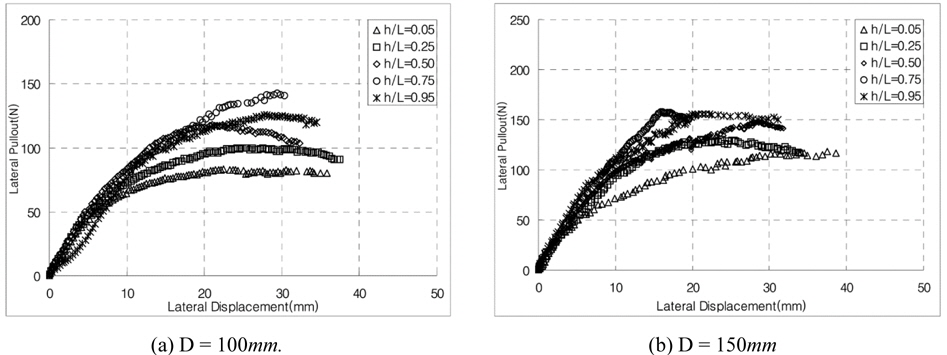
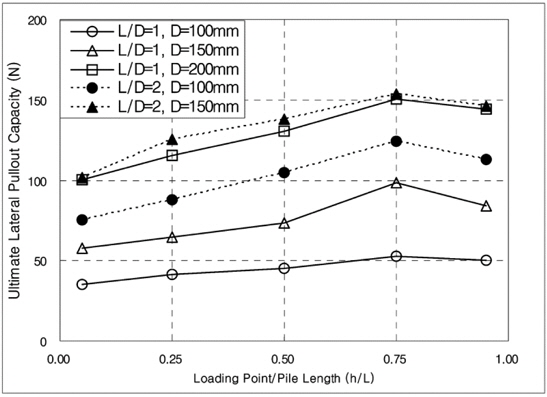
Figs. 8 and 9 show the horizontal pullout load vs. displacement curves in various cases from the model test. Fig. 8 presents the case with the ratio of L/D of 1, and Fig. 9 the case with the ratio of L/D of 2. These figures show the relationships between the horizontal pullout load and displacement at the different loading points. As a result of model tests, the ultimate horizontal pullout load increased in all cases, regardless of the pile length and diameter, as the loading point moved down to the bottom of the pile from the top, then the maximum value was occurred at approximately h/L = 0.75, and decreased afterwards. Such results coincided with the results of the centrifuge model tests conducted by Kim and Jang (2011), and appeared similar to the results of Cho (2000). And as the pile diameter and length increased, the ultimate horizontal pullout load increased, and the initial slope of the horizontal pullout load vs. displacement curve also increased slightly. Table 1 presents the ultimate horizontal pullout load evaluated from the horizontal pullout load vs. displacement curves by the model tests. In this study, the ultimate horizontal pullout load was evaluated using three methods: the maximum load method, Davisson (1972) method, and Δ = 0.1
[Fig. 8] Relationship between the horizontal pullout load and displacement of the pile with L/D = 1.

[Fig. 9] Relationship between the horizontal pullout load and displacement of the pile with L/D = 2.

[Table 1] Ultimate horizontal pullout load (Pult) from the model tests.
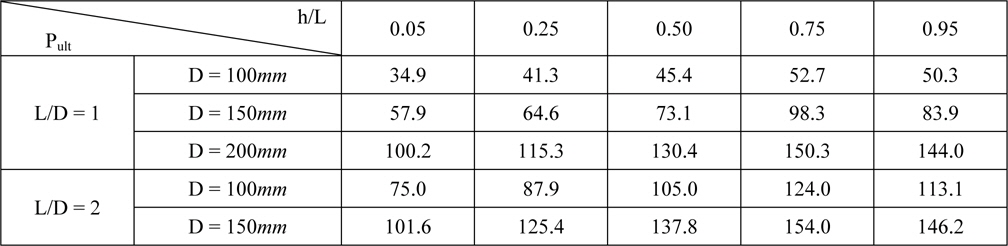
Ultimate horizontal pullout load (Pult) from the model tests.
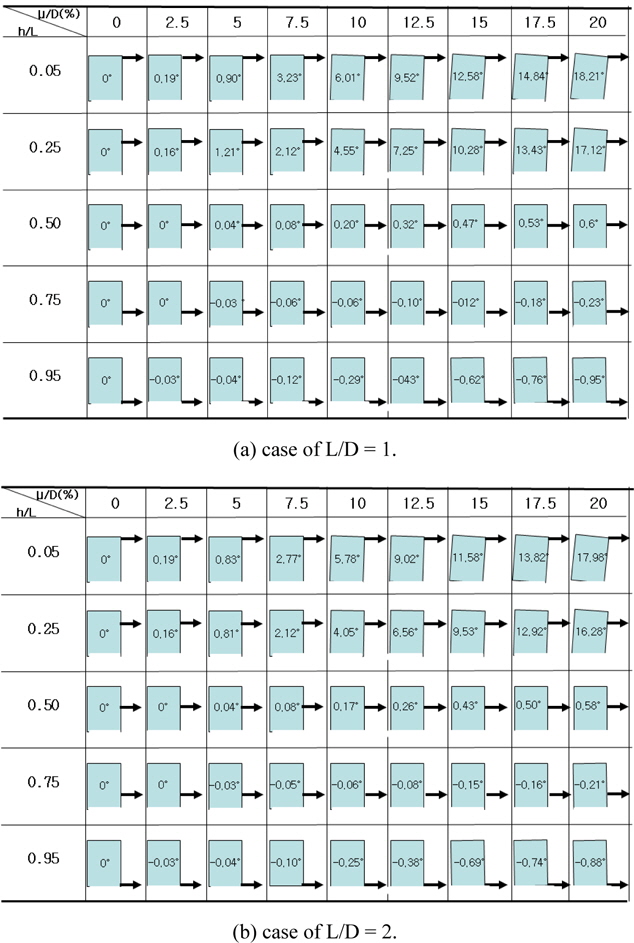
In this study, to investigate the movement pattern of the pile during loading the horizontal pullout precisely, the wire displacement transducers were separately connected to the two points at the top of the model pile in the horizontal and vertical directions, and the coordinates at the two points were measured. When the horizontal pullout load applied to the pile, the pile moved towards the pullout direction and rotated simultaneously. Fig. 11 shows the rotational and translational movements of the pile during loading the horizontal pullout, which are the result of the model test on the pile with a diameter of 150
[Table 2] Rotational angles at the displacement corresponding to 10% of the pile diameter.

Rotational angles at the displacement corresponding to 10% of the pile diameter.
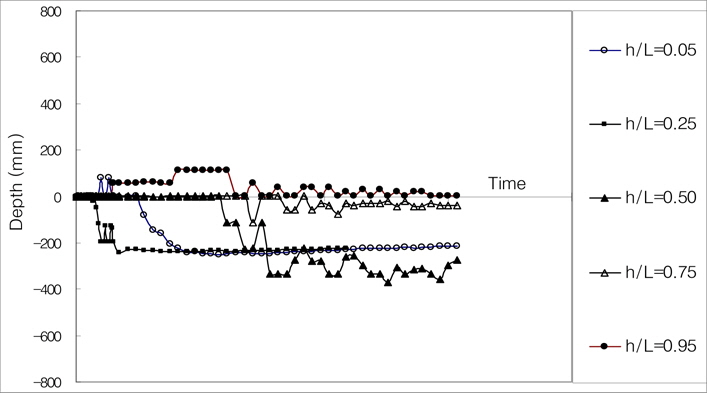
When the horizontal pullout load acted at the side surface of the pile, the pile generally moved to the pullout direction and rotated simultaneously. As explained earlier, the movement patterns of the pile are varied depending on the loading position where the pullout load acts. Fig. 12 shows the translational and rotational movement pattern of the pile in the case of loading on the top end (h/L = 0.05) of the pile. As shown in Fig. 12, the pile under the horizontal pullout load appeared to have been moving while rotating around a certain pivot point. Such tendency was similarly observed at all the piles that were used for the model test. The pivot point of the pile under the horizontal pullout load can be calculated using the coordinate values at the two points measured during the horizontal loading test. The movement path of the pivot points calculated with such method is presented in Fig. 13, which is the case of a pile of 150
Table 3 presents the position of the pivot point of the pile under the horizontal pullout load according to the diameter and length of the pile, and the loading point. When the horizontal pullout load acted at the upper part above the middle of the pile, the pivot point of the pile was positioned at 150-360
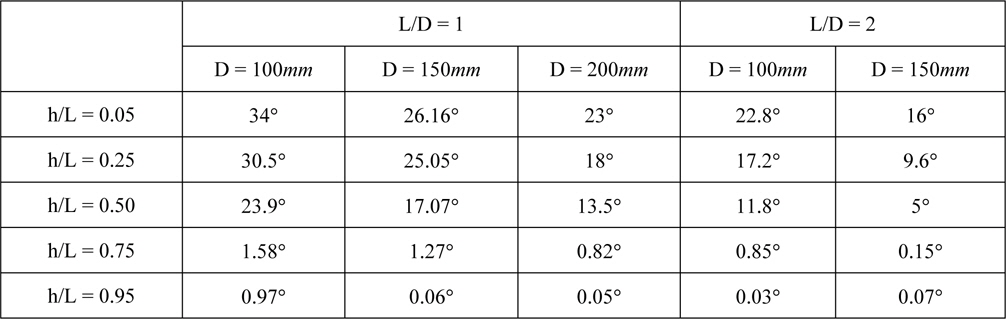
[Table 3] Depth of the pivot point under the horizontal pullout load.
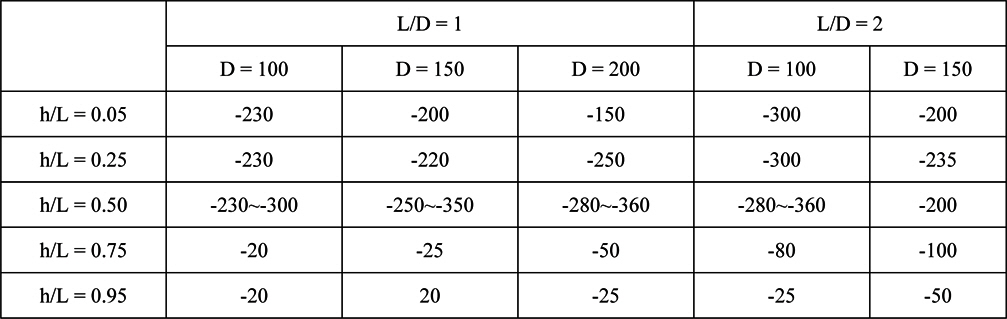
Depth of the pivot point under the horizontal pullout load.
From Fig. 13 and Table 3, the pivot point of the pile was positioned below the ground when the horizontal pullout load acted at the upper part above the middle of the pile, while the pivot point moved close to the ground surface when the load acted at the lower part of the pile. This means that the translational and rotational movements of the pile under the pullout load were irregularly occurred at the initial stage, but when the load increased to some extent, the pile rotated and moved around a certain pivot point. That is, when the horizontal pullout load acts at the pile, the pile doesn’t rotate from the beginning. The pile is located to a certain position in the soils as the other part of the pile not to be acted the pullout load moves slightly towards the opposite direction to the pullout direction, then the pile moves to the pullout direction. And afterwards, the pile rotates and moves around a pivot point.
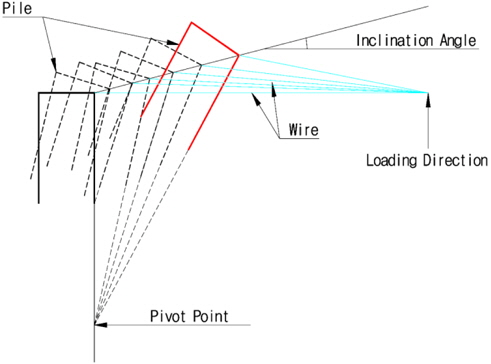
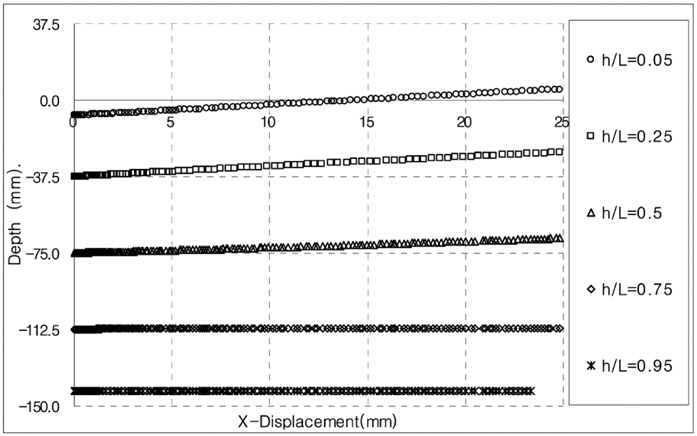
The pile under the horizontal pullout load rotates and moves horizontally, and the loading points always vary non-parallel to the ground surface during loading the pullout. The position of loading point can be calculated from the coordinates at two points of the pile under the horizontal pullout load. Fig. 14 shows the movement path of the loading points calculated from the results of the horizontal load test on the pile of 150
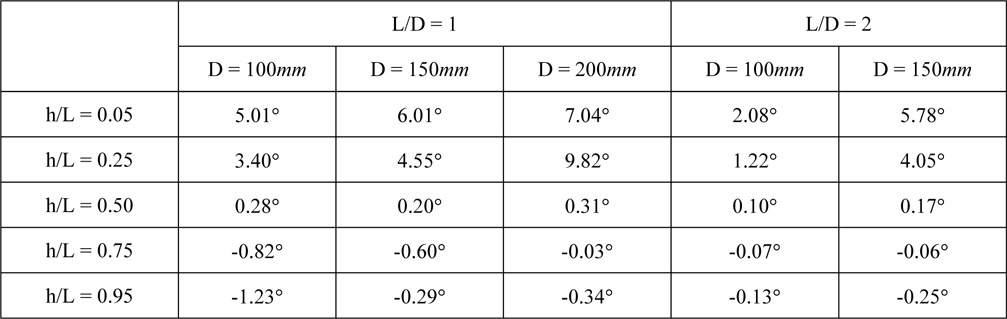
[Table 4] Inclination angle of movement path of the loading point under the horizontal pullout load.

Inclination angle of movement path of the loading point under the horizontal pullout load.
The lateral behavior characteristics of the suction pile installed in sands was investigated in this study. The laboratory model tests were conducted on the pile with small ratio of L/D, to simulate the suction pile. From the tests which were varied the diameter and length of the pile and loading points, the horizontal pullout load and the translational and rotational movements of the pile were investigated, and the following conclusions were obtained.
As a result of model tests, the ultimate horizontal pullout load of the pile embedded in sands increased as the loading point (h/L) moved down to the bottom from the top of the pile, regardless of the ratio of L/D, presented the maximum value at h/L = 0.75, and decreased afterwards. When the horizontal pullout load acted on the upper part above the middle of the pile, the pile rotated clockwise and moved to the pullout direction, and the pivot point of the pile was positioned at 150-360