Heterotrophic dinoflagellates are ubiquitous protists in marine environments and major components in marine ecosystems (Lessard 1984, 1991, Jacobson and Anderson 1986, Jeong et al. 2010b, Yoo et al. 2013a). They play diverse ecological roles in the marine ecosystems as effective grazers on diverse prey items, including bacteria, phytoplankton, heterotrophic nanoflagellates, other heterotrophic dinoflagellates, ciliates, and eggs and early naupliar stages of metazoans (Jeong 1999, Jeong et al. 2010b, 2015, Yoo et al. 2013a, 2013b), and are important prey items for large ciliates, metazooplankton, and larval fish (Klein Breteler 1980, Gifford and Dagg 1991, Jeong et al. 2007b). They also sometimes control populations of red tide species (Jeong et al. 2005a, 2015, Yoo et al. 2013a). Therefore, to understand the cycling of materials in marine ecosystems and red tide dynamics, the interactions between heterotrophic dinoflagellates and their prey or predators and the impact of grazing by heterotrophic dinoflagellates on populations of red tide species must be elucidated.
Before 2015, 7 genera, Amyloodinium, Cryptoperidiniopsis, Luciella, Paulsenella, Pfiesteria, Stoeckeria, and Tyrannodinium, had been established in the family Pfiesteriaceae (Landsberg et al. 1994, Steidinger et al. 1996, 2006, Jeong et al. 2005b, Litaker et al. 2005, Marshall et al. 2006, Mason et al. 2007, Calado et al. 2009). The kind of prey that can be consumed and the maximum growth and ingestion rates for a given prey species differ among pfiesteriacean species, even though they have the same feeding mechanism, peduncle feeding (e.g., Lim et al. 2014). Thus, the ecological niche and roles in marine ecosystems differ among pfiesteriacean species. The kind of prey and maximum growth and ingestion rates have been suggested to be related to the evolution of the species in this family (Lim et al. 2014). Therefore, when a new genus or species in the family Pfiesteriaceae is discovered, its feeding behavior, kind of prey, and maximum growth and ingestion rates should be explored to understand its ecological roles in marine ecosystems and evolution in the family.
Recently, a new heterotrophic dinoflagellate from the waters of Masan Bay, Korea, was isolated. This dinoflagellate had thin plates arranged in a Kofoidian series of Po, X, 4′, 2a, 6′′, 6c, PC, 3 + s, 5′′′, 0p, and 2′′′′, similar to species in the family Pfiesteriaceae (Kang et al. 2015). Furthermore, this dinoflagellate genetically belonged to the family Pfiesteriaceae, although it had a conspicuous apical hook (finger-like projection) on the epitheca, unlike the other species in the family. Therefore, based on its morphology and genetics, it was assigned to be a new species in a new genus, Aduncodinium glandula, in the family Pfiesteriaceae. It is worthwhile to explore its feeding capability and then compare the results to those for other pfiesteriacean species.
In the present study, the feeding behavior of A. glandula was investigated. Several feeding experiments were conducted to determine: 1) the kind of prey that A. glandula can feed on, and whether it is similar to that of other species in this family; 2) whether A. glandula feeds on prey in the same way as species in other genera; and 3) the growth and ingestion rates of A. glandula on the optimal and suboptimal prey species, and whether the maximum growth and ingestion rates of A. glandula are comparable with those of species in other genera on the same prey species. The results of this study provide a basis for understanding the interactions and population dynamics occurring between A. glandula and its prey species; and the role of A. glandula in marine communities.
A. glandula (GenBank accession No. LK934662) isolated from plankton samples collected from Masan Bay, Korea, in March 2013 was used in this study (Kang et al. 2015). Dense cultures of A. glandula were transferred to 250-mL polystyrene cell culture Petri flasks (BD Falcon, Bedford, MA, USA) containing fresh prey, Akashiwo sanguinea (ca. 1,000-2,000 cells mL−1) or Heterocapsa triquetra (ca. 2,000-5,000 cells mL−1), each week. These culture flasks were capped and placed lying on a shelf at 20℃ under an illumination of 20 µE m−2 s−1 of cool white fluorescent light on a 14 : 10 h light-dark cycle.
To ensure that none of the established cultures were contaminated, DNA extracts of each culture were analyzed using species-specific primers for A. glandula, Stoeckeria algicida, Stoeckeria changwonensis, Pfiesteria piscicida, and Luciella masanensis as in Kang et al. (2015). This screening confirmed that each culture comprised only the target species.
Phototrophic cells were grown in enriched f/2 seawater media without silicate in 2-L polycarbonate (PC) bottles (Guillard and Ryther 1962). The bottles were placed on shelves and incubated at 20℃ in a controlled-temperature chamber under a 14 : 10 h light-dark cycle at 20 µE m−2 s−1.
The strain of H. triquetra used in the present study was isolated from Shiwha Bay, Korea in 2012. The strain of A. sanguinea was originated from Scripps Institution of Oceanography, University of California, San Diego, CA, USA. Perch blood cells, obtained by cutting the tailfin of live adults (ca. 50 cm), were maintained at 4℃. The experiments on the perch blood cells were started within 2-3 h of the cells being obtained.
The carbon contents of H. triquetra (0.22 ng C cell−1), A. sanguinea (2.23 ng C cell−1), and the perch blood cells (0.009 ng C cell−1, n > 2,000) were used according to Jeong et al. (2006, 2007a).
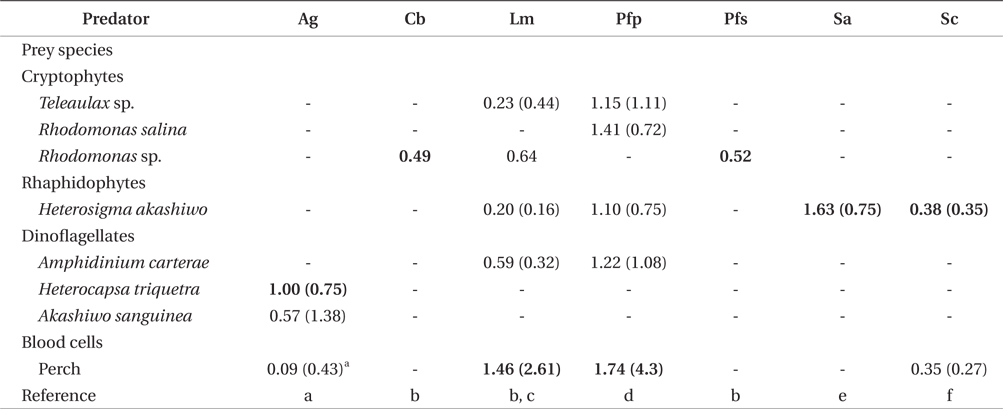
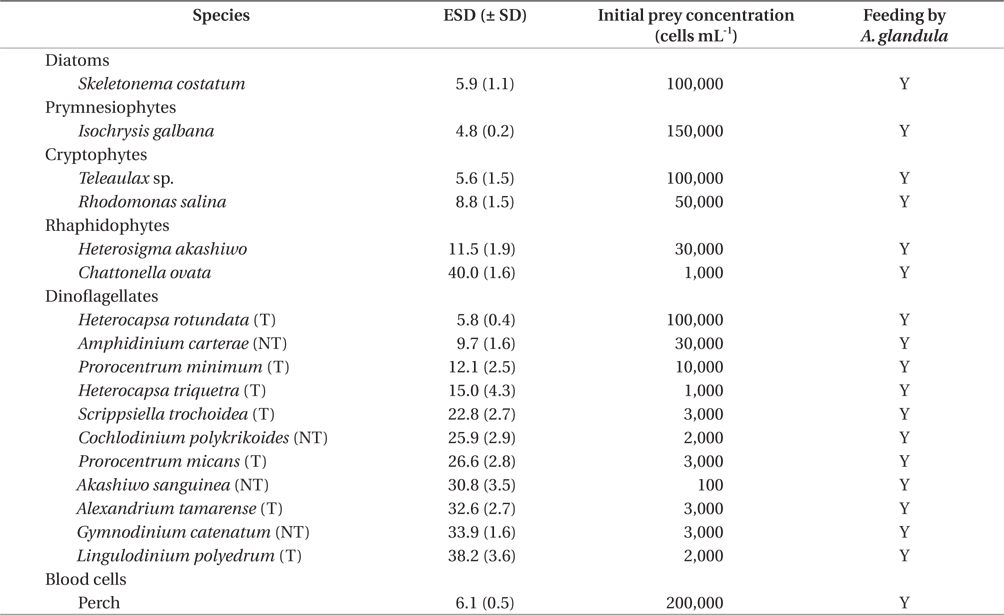
Experiment 1 was designed to investigate the ability of A. glandula to feed on individual target species when unialgal diets of diverse algal species were provided (Table 1). The initial concentrations of each algal species had a similar carbon biomass.
A culture of approximately 2,000 cells mL−1 of A. glandula growing on A. sanguinea was transferred to a single 50-mL culture flask containing freshly filtered seawater after A. sanguinea became undetectable. This culture was maintained for 1 d. Three 1-mL aliquots were then removed from the flask and examined with a light microscope to determine the concentration of A. glandula.
The initial concentrations of A. glandula (ca. 500 cells mL−1) and each of the target algal species were established using an autopipette to deliver a predetermined volume of culture with a known cell density into the experimental flasks. For each algal species, triplicate 50-mL culture flasks containing 5-mL mixtures of A. glandula and the prey, and duplicate predator control flasks containing a 5-mL culture of A. glandula only were set up. The flasks were placed lying on a shelf and incubated.
After 6, 12, 24, and 48 h, >30 A. glandula cells in the flask were monitored under a dissecting microscope with a magnification of ×40-63 to determine the ability of A. glandula to feed on the target prey species. A. glandula cells feeding on the target prey cell using their peduncle were transferred to a slide, and photographs of the feeding were taken using digital cameras on an epifluorescence microscope (Zeiss-Axiovert 200M; Carl Zeiss Ltd., Göttingen, Germany) at a magnification of ×100-400.
Experiment 2 was designed to investigate the feeding behavior of A. glandula when provided with unialgal diets of H. triquetra and A. sanguinea as prey. The initial concentrations of predator and prey used in Experiment 2 were the same as those described above for Experiment 1.
For each target species, a single 50-mL culture flask containing a mixture of A. glandula and the prey was set up. After 1 h of incubation, all of the feeding processes from the time a prey cell was captured to the time that the prey was completely ingested by the predator were observed by monitoring the behavior of >60 unfed A. glandula cells for each prey species under a light microscope at a magnification of ×100-630.
The feeding process of an A. glandula cell was photographed using a video analyzing system (Sony DXC-C33; Sony Co., Tokyo, Japan) mounted on a compound microscope at a magnification of ×100-630. The time lag (n = 5) between the deployment of a peduncle of A. glandula and the time for a prey cell to be completely ingested by an A. glandula cell after the predator had deployed its peduncle to the prey cell were measured when H. triquetra was provided as prey. In addition, the feeding process of A. glandula on A. sanguinea (n = 5) was recorded.
Experiment 3 was designed to measure the growth and ingestion rates of A. glandula on H. triquetra and A. sanguinea as a function of prey concentration. In the preliminary test, A. glandula grew well on H. triquetra and A. sanguinea, but did not grow on Amphidinium carterae, Heterosigma akashiwo, Rhodomonas salina, or Teleaulax sp.
For the experiment on H. triquetra prey, cultures of 1,000-2,000 cells mL−1 of A. glandula growing on H. triquetra were transferred to a single 250-mL culture flask containing freshly filtered seawater after H. triquetra became undetectable. This culture was maintained for 1 day. Similarly, for the experiment on A. sanguinea prey, cultures of 2,000-3,000 cells mL−1 of A. glandula growing on A. sanguinea were transferred to a single 250-mL culture flask containing freshly filtered seawater after A. sanguinea became undetectable. This culture was maintained for 1 day. Three 1-mL aliquots were then collected from the flask and examined using a light microscope to determine the concentration of A. glandula.
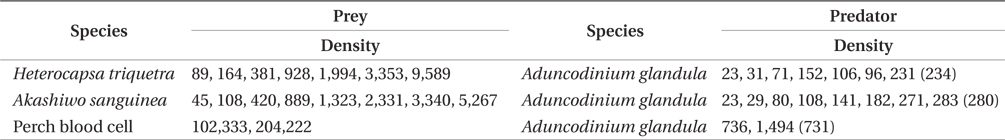
The initial concentrations of A. glandula and each of the target prey species were established by using an autopipette to deliver predetermined volumes of known cell concentrations to the bottles (Table 2). For each predator-prey combination, triplicate experimental 50-mL culture flasks (containing a 10-mL mixture of predator and prey) and triplicate control flasks (containing a 10-mL culture of prey only) were set up. Triplicate control flasks containing a 10-mL culture of only A. glandula were also established at a single predator concentration. To ensure similar water conditions, the water of the predator culture was filtered through a 0.7-µm GF/F filter, and this was added to the prey control flasks at the same volume as the predator culture added into the experimental flasks for each predator-prey combination. To determine the actual predator and algal prey concentrations at the start of the experiment and after 2 days, a 5-mL aliquot was removed from each bottle and fixed with 5% Lugol’s solution; all or >200 predator and prey cells in triplicate 1-mL Sedgwick-Rafter chambers were then counted. Only 5 mL of water in each 50-mL flask was incubated to increase encounter rates between predators and prey because A. glandula swam near the bottom of the flask (i.e., to make a shallow depth in the flasks).
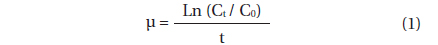
The specific growth rate of A. glandula was calculated as follows:
, where C0 is the initial concentration of A. glandula and Ct is the final concentration after time t. The period was 2 days. The mean prey concentration was calculated using the equation of Frost (1972). The ingestion and clearance rates were calculated using the equations of Frost (1972) and Heinbokel (1978).
The carbon content of A. glandula was estimated from the cell volume according to the method of Menden-Deuer and Lessard (2000).
Data for A. glandula growth rate were fitted to the following equation:
, where µmax is the maximum growth rate (d−1), x is the prey concentration (cells mL−1 or ng C mL−1), x' is the threshold prey concentration (i.e., the prey concentration where µ = 0), and KGR is the prey concentration sustaining 1/2 µmax. Data were iteratively fitted to the model using Delta-Graph (SPSS Inc., Chicago, IL, USA).
Ingestion rate (IR) data were fitted to a Michaelis-Menten equation:
, where Imax is the maximum ingestion rate (cells predator−1 d−1 or ng C predator−1 d−1), x is the prey concentration (cells mL−1 or ng C mL−1), and KIR is the prey concentration sustaining 1/2 Imax.
A culture of A. glandula of approximately 2,000 cells mL−1 growing on A. sanguinea was transferred into a 500- mL PC bottle. When prey was undetectable, an aliquot from the bottle was added to a 50-mL cell culture flask and allowed to acclimate for 30 min. The video camera focused on an individual field viewed as a single circle in a cell culture flask under a dissecting microscope at 20℃. The swimming of A. glandula cells was then recorded at a magnification of ×40 by using a video analyzing system (SV-C660; Samsung, Seoul, Korea) and a charge-coupled device camera (KP-D20BU; Hitachi, Tokyo, Japan). The mean and maximum swimming velocities for all swimming cells viewed during the first 10 min were analyzed. The average swimming speed (n = 20) was calculated based on the linear displacement of cells in 1 s during single-frame playback.
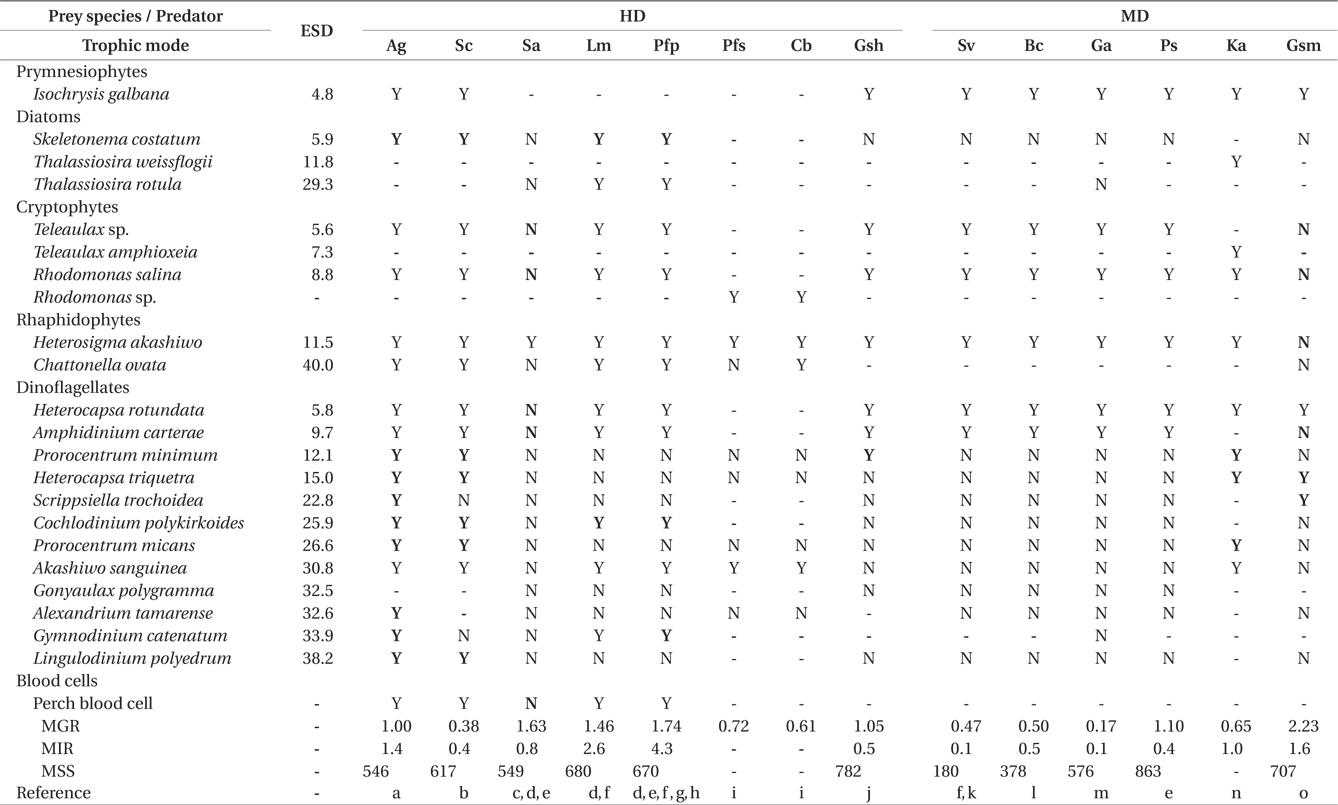
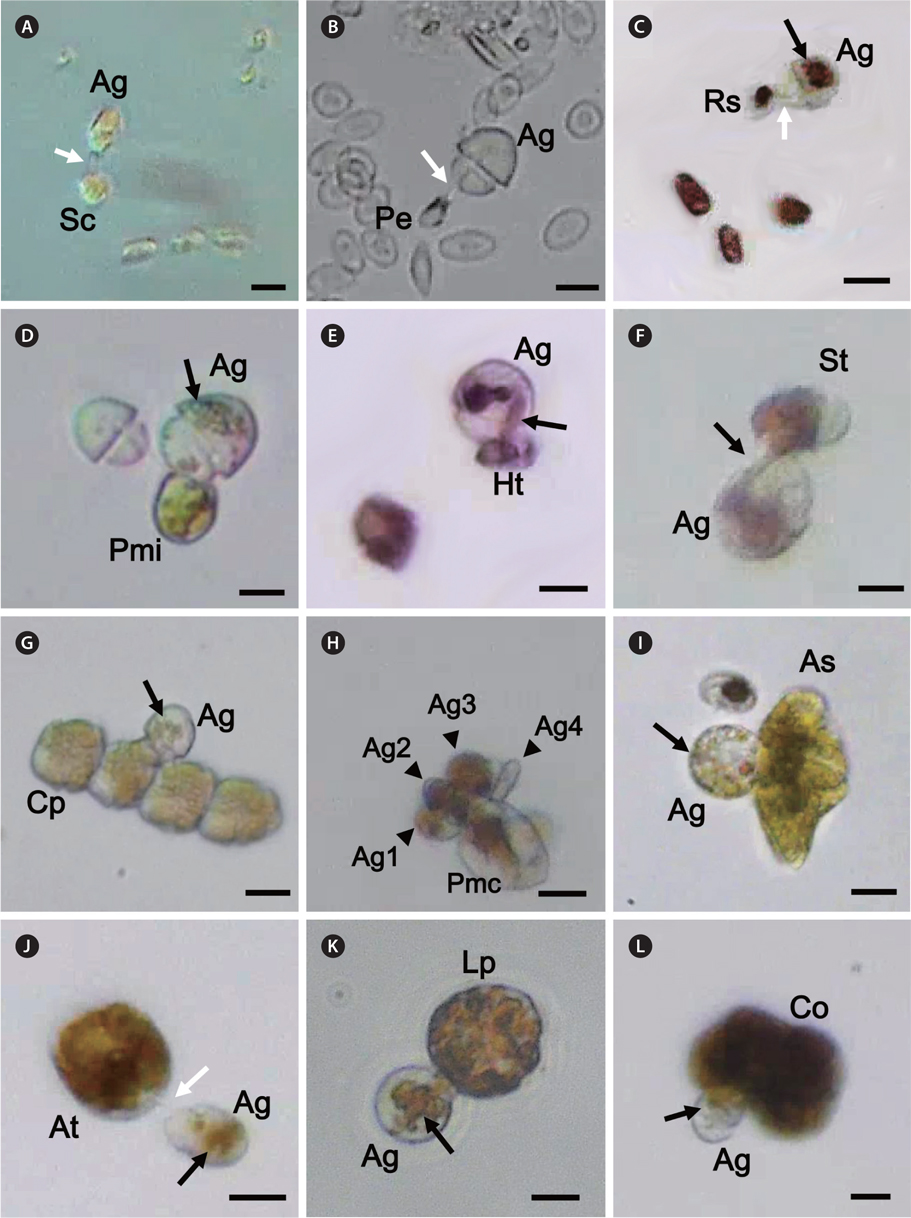
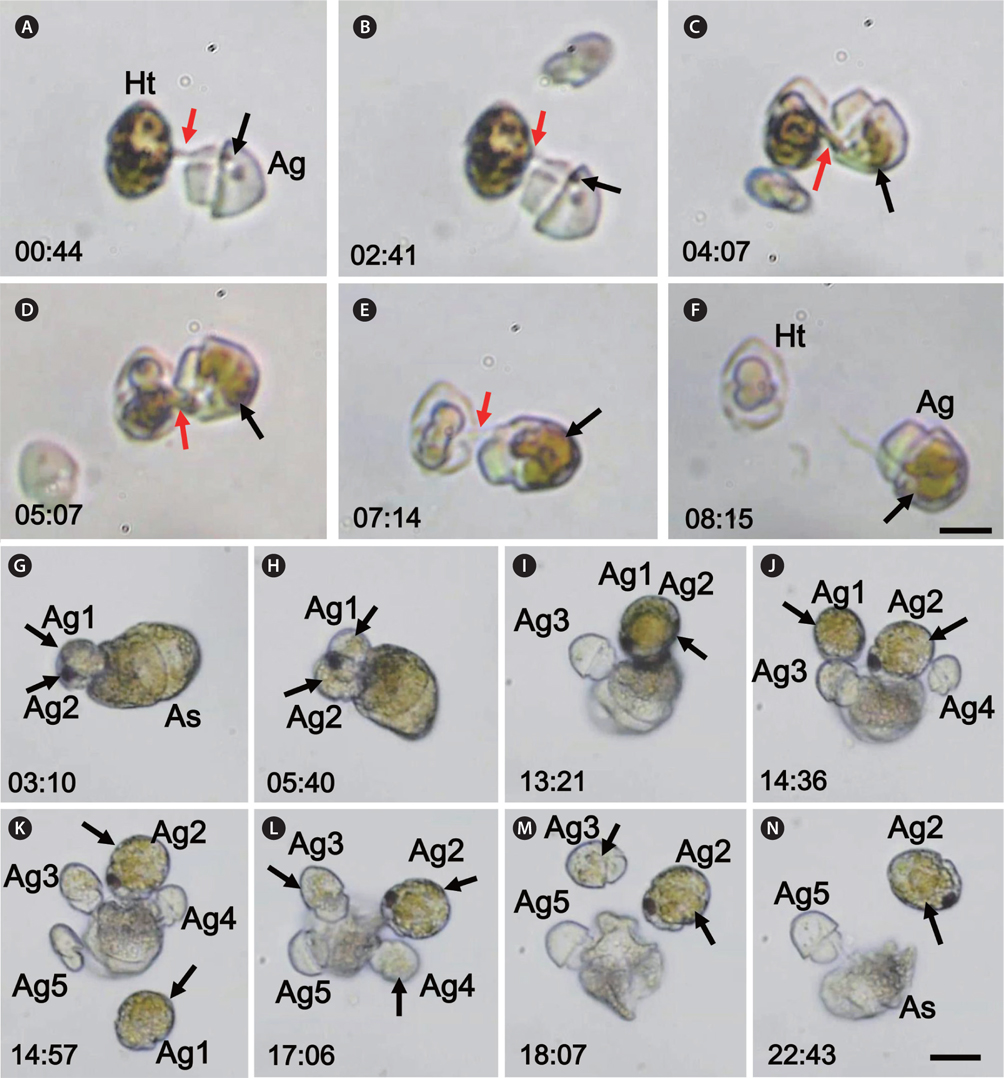
A. glandula ingested all of the algal prey species offered as food (i.e., the diatoms Skeletonema costatum; the cryptophytes Teleaulax sp. and R. salina; the raphidophytes H. akashiwo and Chattonella ovata; and the dinoflagellates Heterocapsa rotundata, A. carterae, Prorocentrum minimum, H. triquetra, Cochlodinium polykrikoides, Scrippsiella trochoidea, P. micans, A. sanguinea, Gymnodinium catenatum, and Lingulodinium polyedrum) and perch blood cells (Table 1, Figs 1 & 2, Supplementary Videos 1 & 2). A. glandula fed on its prey through a peduncle after anchoring to the prey cell using a tow filament. Typically, several A. glandula cells attacked a prey cell together (Fig. 2). In particular, it took a long time for A. glandula cells to ingest a large A. sanguinea cell, so several predator cells would approach and collectively attack the prey cell after one A. glandula cell deployed its peduncle (Fig. 2).
[Fig. 1.] Feeding of Aduncodinium glandula (Ag) on diverse prey species. Ag cells feeding on Skeletonema costatum (Sc) (A), perch blood cell (Pe) (B), Rhodomonas salina (Rs) (C), Prorocentrum minimum (Pmi) (D), Heterocapsa triquetra (Ht) (E), Scrippsiella trochoidea (St) (F), Cochlodinium polykrikoides (Cp) (G), Prorocentrum micans (Pmc) (H), Akashiwo sanguinea (As) (I), Alexandrium tamarense (At) (J), Lingulodinium polyedrum (Lp) (K), and Chattonella ovata (Co) (L). An A. glandula cell sucking materials (black arrows) from a prey cell through a peduncle (white arrows). Arrowheads in panel H indicate Ag cells. Scale bars represent: A-L, 10 μm.
The time (mean ± standard error [SE], n = 5) for a larger naked prey A. sanguinea cell to be completely ingested by two A. glandula cells, after the first attacking predator had deployed its peduncle to the prey cell (1,040 ± 184 s), was longer than that for the thecate but smaller prey H. triquetra (538 ± 57 s, n = 4). However, the time (mean ± SE, n = 5) for an A. sanguinea cell to be completely ingested by five A. glandula cells after the first attacking predator had deployed its peduncle to the prey cell (566 ± 147 s, n = 5) was shorter than the time taken by two A. glandula cells.
A unialgal diet of H. triquetra or A. sanguinea supported the positive growth of A. glandula. By contrast, a unialgal diet of A. carterae, R. salina, or Teleaulax sp., or perch blood cells did not support growth (Table 3).
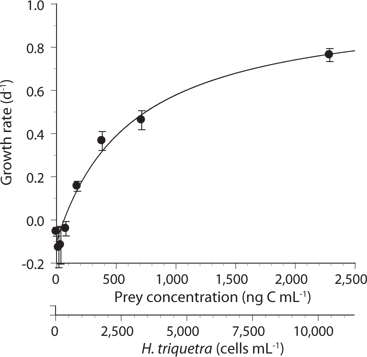
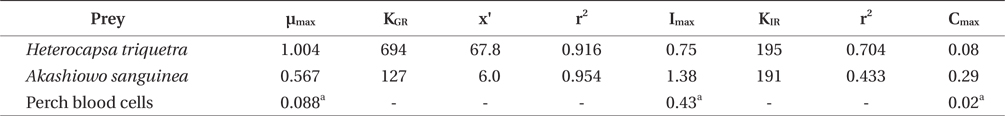
With increasing mean prey concentration, the specific growth rates of A. glandula increased rapidly at H. triquetra concentrations less than 714 ng C mL−1 or 3,245 cells mL−1 and then more slowly at higher prey concentrations (Fig. 3). When the data were fitted to Eq. (2), the maximum specific growth rate of A. glandula on H. triquetra was 1.004 d−1; the KGR was 694 ng C mL−1or 3,154 cells mL−1; and the threshold prey concentration was 67.8 ng C mL−1 or 315 cells mL−1.
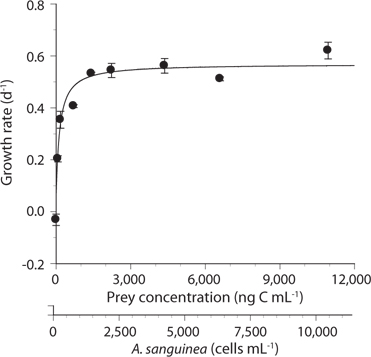
With increasing mean prey concentration, the specific growth rates of A. glandula increased rapidly at A. sanguinea concentrations less than 638 ng C mL−1 or 286 cells mL−1 (Fig. 4). When the data were fitted to Eq. (2), the maximum specific growth rate of A. glandula on A. sanguinea was 0.567 d−1; the KGR was 127 ng C mL−1 or 57 cells mL−1; and the threshold prey concentration was 6.0 ng C mL−1or 2.7 cells mL−1.
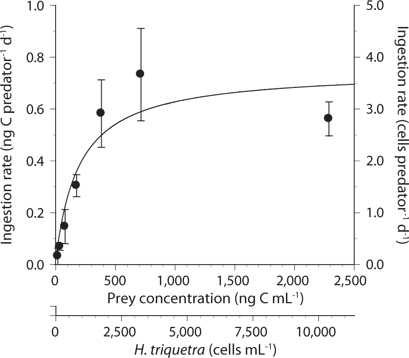
With increasing mean prey concentration, the ingestion rates of A. glandula increased rapidly at H. triquetra concentrations less than 383 ng C mL−1 or 1,740 cells mL−1, but became saturated at higher prey concentrations (Fig. 5). When the data were fitted to Eq. (3), the maximum ingestion rate of A. glandula on H. triquetra was 0.75 ng C predator−1 d−1 or 3.4 cells predator−1 d−1; and KIR was 195 ng C mL−1 or 886 cells mL−1. The maximum clearance rate of A. glandula on H. triquetra was 0.08 µL predator−1 h−1.
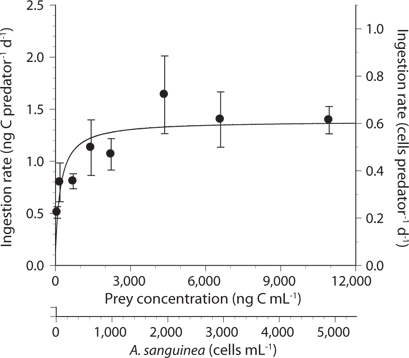
With increasing mean prey concentration, the ingestion rates of A. glandula increased rapidly at A. sanguinea concentrations less than 1,424 ng C mL−1 or 638 cells mL−1, but became saturated at higher prey concentrations (Fig. 6). When the data were fitted to Eq. (3), the maximum ingestion rate of A. glandula on A. sanguinea was 1.38 ng C predator−1 d−1 or 0.6 cells predator−1 d−1; and KIR was 191 ng C mL−1 or 86 cells mL−1. The maximum clearance rate of A. glandula on A. sanguinea was 0.29 µL predator−1 h−1.
The average (±SE, n = 20) and maximum swimming speeds of A. glandula under the experimental conditions were 439 (±12) and 546 µm s−1, respectively.
A. glandula fed on all algal prey and perch blood cells tested. Prior to this study, in the family Pfiesteriaceae, S. changwonensis was the species that could feed on the most diverse prey species (Table 4). However, A. glandula feeds on S. trochoidea and G. catenatum, while S. changwonensis does not. Therefore, now A. glandula is the species can feed on the most diverse prey species among the pfiesteriacean species. The ranking of the pfiesteriacean species tested in terms of the number of prey species consumed was A. glandula (18/18 species eaten) > S. changwonensis (15/17 species eaten) > L. masanensis (12/19 species eaten) > P. piscicida (12/19 species eaten) > Cryptoperidiniopsis brodyi (4/8 species eaten) > Pfiesteria humwayae (3/8 species eaten) > S. algicida (1/19 species eaten) (Table 4). Furthermore, A. glandula could eat more species than could the similar-sized heterotrophic dinoflagellate Gyrodiniellum shiwhaense (7/16 species eaten) and the mixotrophic dinoflagellates Biecheleria cincta (previously Woloszynskia cincta; 6/16 species eaten), Symbiodinium voratum (6/16 species eaten), Gymnodinium aureolum (6/18 species eaten), Paragymnodinium shiwhaense (6/16 species eaten), and Gymnodinium smaydae (4/16 species eaten) in other families, but the same as Karlodinium armiger could eat (10/10 species eaten) (Table 4). The maximum swimming speed of A. glandula is lowest among the pfiesteriacean dinoflagellates, so factors other than swimming speed (and in turn the rate of encounter between predator and prey cells) may be responsible for its having the most diverse prey species (Lim et al. 2014, our unpublished data) (Table 4). A. glandula may have enzymes that are more diverse than those of other species in the Pfiesteriaceae. In the phylogenetic trees based on small subunit and large subunit ribosomal DNA, A. glandula is divergent from the clade consisting of Pfiesteria spp., Luciella spp., and Cryptoperidiniopsis spp. and another clade consisting of Stoeckeria spp. (Kang et al. 2015). Therefore, A. glandula may have prey-related genes that differ from those of the other species in the family Pfiesteriaceae. Based on the diversity of its prey, A. glandula is likely to have more diverse prey-related genes than the other pfiesteriacean dinoflagellates. The high diversity of prey species for A. glandula may mean that it is present in more diverse marine environments than are other species.
A. glandula can feed on S. trochoidea and Alexandrium tamarense, which are not eaten by the other pfiesteriacean species. Furthermore, besides S. changwonensis, A. glandula is the only pfiesteriacean dinoflagellate that can feed on the common red-tide dinoflagellates P. minimum, H. triquetra, Prorocentrum micans, and L. polyedrum (Table 4). Moreover, besides P. piscicida, A. glandula is the only pfiesteriacean species that can feed on the toxic dinoflagellate G. catenatum. Therefore, A. glandula may be the only pfiesteriacean species present during A. tamarense blooms, while it is expected to be one of only two pfiesteriacean species present during P. minimum, H. triquetra, P. micans, L. polyedrum, and G. catenatum blooms.
A. glandula feeds on algal prey and fish blood cells through a peduncle after anchoring to a prey cell using a tow filament. This feeding mechanism is similar to that of species in the other genera in the family Pfiesteriaceae (Burkholder et al. 1992, Burkholder and Glasgow 1997, Jeong et al. 2005a, 2006, 2007a, Baek et al. 2010). Because the morphology of A. glandula is considerably different from those of the other genera in the family, it was originally allocated to another genus and family (Katodinium in the family Gymnodiniaceae). However, A. glandula has the same feeding mechanism as all pfiesteriacean species.
It took longer for an A. sanguinea cell to be completely ingested by two A. glandula cells after the first attacking predator had deployed its peduncle to the prey cell than it took to ingest an H. triquetra cell. The size of A. sanguinea (equivalent spherical diameter [ESD] = 30.8 µm) is ca. twice the size of H. triquetra (ESD = 15.0 µm). Therefore, the time for a prey cell to be completely ingested by A. glandula cells is likely to be proportional to the cell size of the prey. Furthermore, the time for an A. sanguinea cell to be completely ingested by five A. glandula cells was shorter than that by two predators. Thus, the time for a prey cell to be completely ingested by A. glandula cells is likely to be affected by the number of predator cells.
H. triquetra and A. sanguinea supported relatively high positive growth of A. glandula, but A. carterae, H. akashiwo, R. salina (or Rhodomonas sp.), Teleaulax sp., and perch blood cells, which are known to support relatively high positive growth of Pfiesteria spp., L. masanensis, C. brodyi, and Stoeckeria spp., did not support growth or only supported very low positive growth for A. glandula (Table 5). Furthermore, the optimal and suboptimal prey species for A. glandula are different from those of the other pfiesteriacean species. Therefore, the feeding of A. glandula is clearly different from those of the other pfiesteriacean species, so it has an ecological niche different from those of the other pfiesteriacean species in marine food webs. In addition, A. glandula is expected to be abundant during or after H. triquetra and A. sanguinea red tides, while the other pfiesteriacean species are abundant during or after A. carterae, H. akashiwo, and cryptophyte red tides.
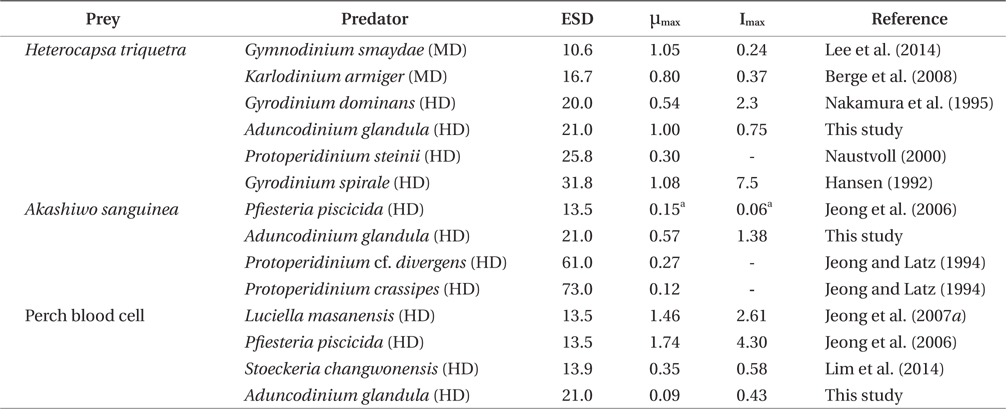
The maximum ingestion rate of A. glandula (1.4 ng C predator−1 d−1) is intermediate among those of pfiesteriacean species (Tables 4 & 5); the maximum ingestion rate of A. glandula is lower than those of L. masanensis and P. piscicida, but greater than those of S. changwonensis and S. algicida. The prey species supporting the maximum ingestion rate of A. glandula is A. sanguinea, while that for L. masanensis and P. piscicida is perch blood cells. A. glandula may have difficulty in capturing, handling, ingesting, and digesting large and actively swimming A. sanguinea cells, while L. masanensis and P. piscicida may not have difficulty in capturing, handling, ingesting, and digesting motionless perch blood cells. Furthermore, the maximum growth rate of A. glandula (1.00 d−1) is also intermediate among those of pfiesteriacean species (Tables 4 & 5); the maximum growth rate of A. glandula is lower than that of L. masanensis, P. piscicida, and S. algicida, but greater than C. brodyi, P. shumwayae, and S. changwonensis. The maximum ingestion rate of A. glandula is much lower than those of L. masanensis and P. piscicida, but greater than those of S. changwonensis and S. algicida, and these differences may be responsible for the differences in the maximum growth rates. Moreover, the ratio of the maximum growth rate relative to the maximum ingestion rate of A. glandula on the thecate dinoflagellate H. triquetra (1.3) is lower than that of S. algicida on the naked raphidophyte H. akashiwo (2.2). Therefore, the conversion of H. triquetra prey cells to A. glandula predator cells may be smaller than that of H. akashiwo prey cells to S. algicida predator cells.
The maximum ingestion rate of A. glandula on H. triquetra is 2 to 3 times greater than that of the mixotrophic dinoflagellates G. smaydae and K. armiger on the same prey (Table 6). A. glandula is considerably larger than G. smaydae and K. armiger. Therefore, A. glandula is likely to have a higher maximum ingestion rate than those of G. smaydae and K. armiger. In addition, the maximum ingestion rates of heterotrophic dinoflagellates are generally higher than those of mixotrophic dinoflagellates (Jeong et al. 2010b). Therefore, the heterotrophy of A. glandula may be partially responsible for its having maximum ingestion rates higher than the mixotrophic G. smaydae and K. armiger. However, the maximum growth rate of A. glandula on H. triquetra is comparable to that of G. smaydae on the same prey (Table 6). G. smaydae feeding on H. triquetra may have a growth rate slightly higher than A. glandula on the same prey because possible phototrophic growth during feeding may elevate the maximum growth rate (i.e., mixotrophic growth). Moreover, the maximum ingestion rate of A. glandula is considerably lower than that of Gyrodinium dominans, even though the sizes of A. glandula and G. dominans are similar. A. glandula is a peduncle feeder, while G. dominans is an engulfment feeder. Therefore, the peduncle of A. glandula may be a less effective tool for feeding on H. triquetra than the engulfment of G. dominans. However, the maximum growth rate of G. dominans on H. triquetra is considerably lower than that of A. glandula. G. dominans ingests whole H. triquetra cells including the theca, while A. glandula sucks prey materials excluding the theca. Therefore, the conversion of ingested H. triquetra cells to G. dominans mass may be less effective than that for A. glandula. Alternatively, engulfment feeding may require more energy than peduncle feeding. During H. triquetra red tides, A. glandula is likely to be as abundant as G. smaydae and Gyrodinium spirale and more abundant than G. dominans.
The maximum ingestion rate of A. glandula on A. sanguinea is much greater than that of P. piscicida on the same prey (Table 6). A. glandula is much larger than P. piscicida, which may be the reason for the difference in the maximum ingestion rate; the larger A. glandula may have less difficulty in handling large A. sanguinea cells than do the smaller P. piscicida. In turn, the much greater maximum ingestion rate of A. glandula is likely to cause its higher maximum growth rate than that of P. piscicida. The much larger sizes of the heterotrophic dinoflagellates Protoperidinium crassipes and P. cf. divergens may be partially responsible for their having growth rates lower than that of A. glandula. During A. sanguinea red tides, A. glandula is likely to be more abundant than P. piscicida, P. crassipes, and P. cf. divergens.
The maximum ingestion rate of A. glandula on perch blood cells was slightly greater than that of S. changwonensis, but much lower than those of P. piscicida and L. masanensis. In the phylogenetic tree based on large subunit ribosomal DNA, A. glandula, the clade consisting of Stoeckeria spp., and the clade consisting of Pfiesteria spp. and Luciella spp. are clearly divergent from each other (Kang et al. 2015). A. glandula and Stoeckeria spp. may not have genes for enzymes related to detecting, ingesting, and digesting blood cells, whereas Pfiesteria spp. and Luciella spp. have them.
In conclusion, the results of this study show that 1) A. glandula has the most diverse prey species among the pfiesteriacean dinoflagellates; 2) H. triquetra and A. sanguinea are the optimal and suboptimal prey species for A. glandula, and these are different from those for the other pfiesteriacean dinoflagellates; 3) the maximum growth and ingestion rates of A. glandula are intermediate among those of pfiesteriacean species; and, therefore, 4) the ecological niche of A. glandula is likely to be different from that of other pfiesteriacean dinoflagellates in marine food webs.


![Specific growth rates of Aduncodinium glandula on Heterocapsa triquetra as a function of the mean prey concentration (x, ng C mL?1). Symbols represent treatment means ± 1 standard error. The curve was fitted by a Michaelis-Menten equation [Eq. (2)] using all treatments in the experiment. Growth rate (d?1) = 1.004 {(x - 67.8) / [694 + (x - 67.8)]}, r2 = 0.916.](http://oak.go.kr/repository/journal/20928/JORHBK_2016_v31n1_17_f003.jpg)
![Specific growth rates of Aduncodinium glandula on Akashiwo sanguinea as a function of the mean prey concentration (x, ng C mL?1). Symbols represent treatment means ± 1 standard error. The curve was fitted by a Michaelis-Menten equation [Eq. (2)] using all treatments in the experiment. Growth rate (d?1) = 0.567 {(x - 6.0) / [127 + (x - 6.0)]}, r2 = 0.954.](http://oak.go.kr/repository/journal/20928/JORHBK_2016_v31n1_17_f004.jpg)
![Ingestion rates of Aduncodinium glandula on Heterocapsa triquetra as a function of the mean prey concentration (x). Symbols represent treatment means ± 1 standard error. The curve was fitted by a Michaelis-Menten equation [Eq. (3)] using all treatments in the experiment. Ingestion rate (ng C grazer?1 d?1) = 0.75 [x / (195 + x)], r2 = 0.708.](http://oak.go.kr/repository/journal/20928/JORHBK_2016_v31n1_17_f005.jpg)
![Ingestion rates of Aduncodinium glandula on Akashiwo sanguinea as a function of the mean prey concentration (x). Symbols represent treatment means ± 1 standard error. The curve was fitted by a Michaelis-Menten equation [Eq. (3)] using all treatments in the experiment. Ingestion rate (ng C grazer?1 d?1) = 1.38 [x / (191 + x)], r2 = 0.433.](http://oak.go.kr/repository/journal/20928/JORHBK_2016_v31n1_17_f006.jpg)