It is required that the pH of the containment sump solution should be above 7.0 to retain iodine in a liquid phase and be within the material compatibility constraints under post-LOCA conditions of PWR [1]. Various acidic and basic materials are produced in the containment sump solution by the hydrolysis reaction related to boric acid (H3BO3), which is a soluble poison, and tri-sodium phosphate (TSP, Na3PO4) or sodium hydroxide (NaOH), which are neutralizing agents, and the radiolysis reaction related to irradiation of organic materials in the containment. It would be possible to determine the pH of the containment sump solution by chemical equilibrium constants or Gibbs free energy minimization between these acidic and basic materials produced in the containment sump solution. It is a general practice in the pH calculation that equilibrium constants have been used to calculate the sump pH and the chemical equilibrium only between boric acid and tri-sodium phosphate or between boric acid and sodium hydroxide.
The acidity or basicity of the containment sump solution will be determined by a lot of materials introduced into containment due to Loss-Of-Coolant Accident (LOCA) and/or a severe accident. These materials are boric acid, hydriodic acid (HI), nitric acid, hydrochloric acid, which are acidic, while cesium hydroxide, calcium oxide (CaO), potassium oxide (K2O), sodium oxide (Na2O), tri-sodium phosphate, sodium hydroxide are basic. The whole system is too complex to apply the equilibrium constant technique to these various compounds. Therefore, a computer program, SOLGASMIX-PV code, which calculates the chemical equilibrium using Gibbs free energy minimization and the Lagrange multiplier method, is more adequate for this problem. However, since there is no subroutine to calculate the amount of acidic and basic materials produced by the radiolysis reaction and pH, these calculation subroutines were incorporated in the Fortran source. The modified SOLGASMIX-PV code was verified by comparing the computed pH with measured by the ORNL experiment. In addition, radiolysis effect on pH was completed.
Finally, the modified SOLGASMIX-PV code was applied to the ShinKori Nuclear Power Plant Units 3&4 (SKN 3&4) and the Ulchin Nuclear Power Plant Units 1&2 (UCN 1&2). There were no significant differences between the result by the advanced technique and that by the conventional equilibrium constant technique. Thus the calculation by the advanced technique is predicted well.
2.1 Chemical Equilibrium Calculation and pH Value
The chemical equilibrium is calculated by Gibbs free energy minimization and Lagrange multiplier method. A computer program based on this technique is SOLGASMIXPV code.
The total Gibbs free energy of a system can be expressed [2]:

where GT is the total Gibbs free energy, ni is the moles of species i, Gio is the standard Gibbs free energy of species i, R is the ideal gas law constant, T is the absolute temperature, and Ai is the activity of species i.
The total free energy can be conveniently written as the dimensionless quantity GT/RT, and assuming ideality [2],
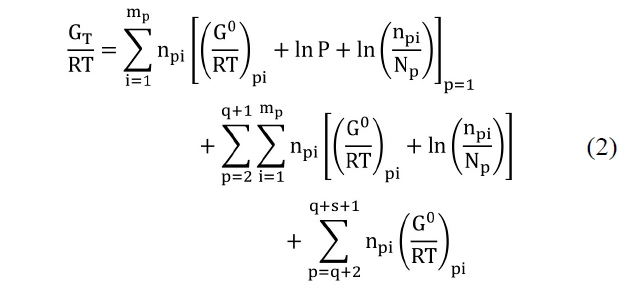
where mp is the number of species in phase p, P is the total pressure, and Np is the moles of phase p.
The phases are numbered consecutively from p = 1 for the gaseous phase, to p = 2 to p = (q + 1) for condensed phase solutions, up to p = (q + s + 1) for the last invariant condensed phase. In variable P and constant total gas volume (V) calculations, P is derived from [2]:

The constraint that the masses of all elements must be conserved is provided by the subsidiary relationship [2]:

where Apij is the coefficient on element j of species i in phase p and bj is the g-atom of element j.
The minimum total Gibbs free energy is calculated by solving the above set of equations using Lagrange’s multipliers method and Taylor expansions about an arbitrary point (the moles of each species), neglecting terms involving derivatives of second and higher orders. The activity coefficient, γpi, from the relationship

can be introduced in the calculations for the purpose of including deviations from ideality [2].
The pH model is used to calculate the activity of the hydrogen ion and the value is derived from its definition [3]

where
The Gibbs free energy for the major compounds at the sump operating temperature is shown in Table 1. Data for the free energies of formation of these compounds are obtained from the reference of National Institute of Standards And Technology. All free energy data are cast into a cubic form,

where ΔG0 is the standard Gibbs free energy of formation, T is the absolute temperature. The best fit regression constants b, c, d, and e are given in Table 1.
2.2 Production of Acidic Materials in Containment
The most important acids produced in containment are nitric acid (HNO3), produced by irradiation of water and air, and hydrochloric acid (HCl), produced by irradiation or heating of electrical cable insulation.
2.2.1 Calculation of HCl Generation
The rate of HCl generation can be written as [4]:

where R is the total HCl generation rate from γ and β radiolysis of electrical cable insulation, and RγH and RβH are the HCl generation rates due to gamma and beta radiolysis, respectively. The units for the rates are g-mols/s.
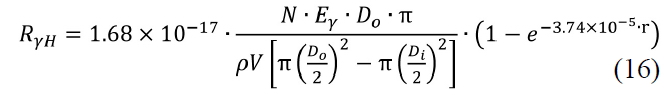
The HCl generation rates due to gamma rays can be expressed [4]:

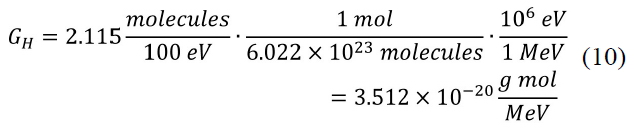
where, GH is the radiation G value (molecules HCl/100eV) for radiolysis of electrical cable insulation, φγC is the gamma radiation energy flux (MeV/cm2s) on the surface of electrical cable insulation, S is the total surface area, cm2, of the cables, and AγH is the absorption of gamma radiation energy by electrical cable insulation.
The G value is 2.115 molecules HCl/100eV
The gamma radiation energy flux is given by

where Eγ is the total gamma energy release rate (MeV/s), and r is the radiation length in containment air (cm) [4].
The magnitude of S varies for each containment cable inventory. It is given by
[Table 1.] Gibbs Free Energy for The Major Compounds at the Sump Operating Temperature [10, 11]
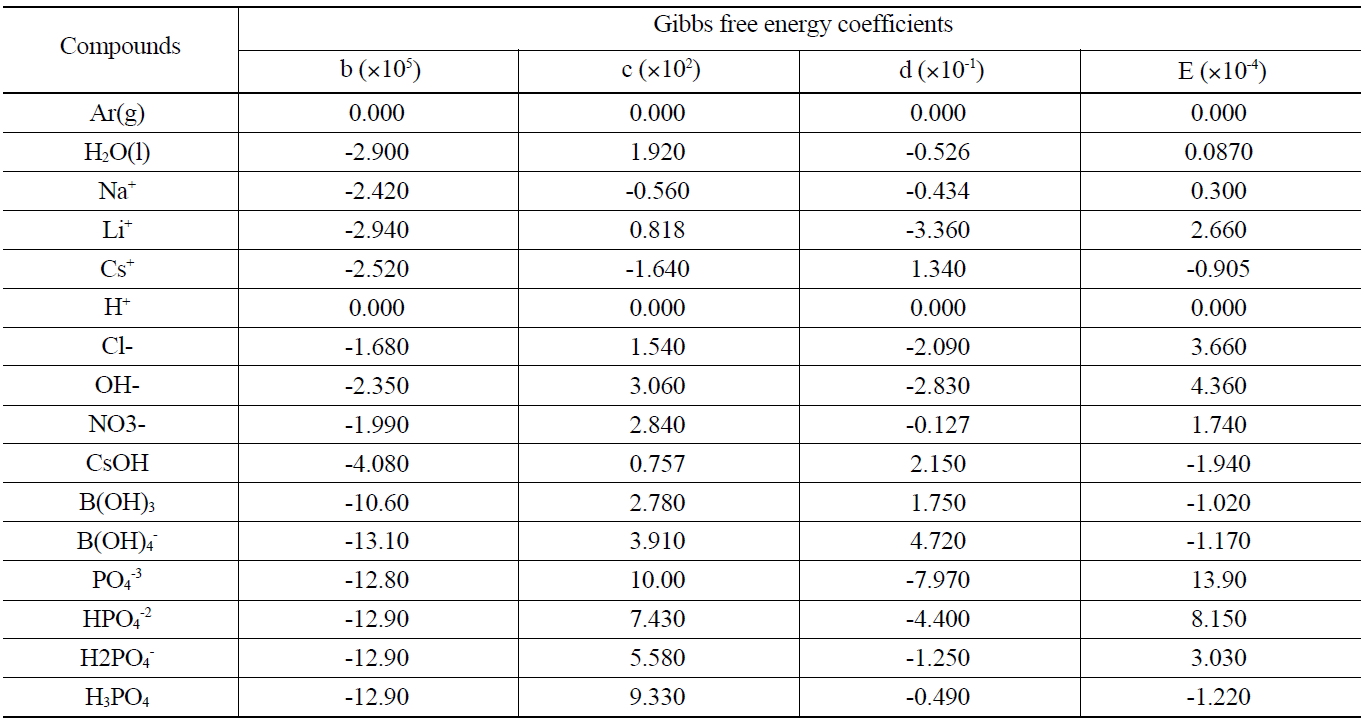
Gibbs Free Energy for The Major Compounds at the Sump Operating Temperature [10, 11]

where
The volume of electrical cable insulation can be equated with the dimensions of the cable as:


where N is the total mass of electrical cable insulation (grams), and ρ is the weighted density of electrical cable insulation (g/cm3) [4].
The value of S is computed from this.

Then,
where V is the net free volume of the containment building (cm3) [4].
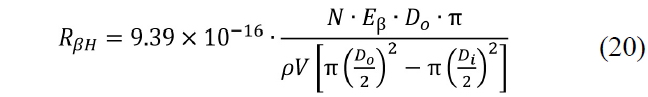
The expression for RβH is obtained in a similar manner [4].

The definitions of GH and S are as above, and φβC and AβH are the beta analogs of φγC and AγH.
The magnitude of φβC is

and AβH is given by:

Then RβH can be written as [4]:
2.2.2 Calculation of Nitric Acid Formation
The concentration of hydrogen ions produced by the radiolytic generation of HNO3 can be written as [5]:

where [H+] is the concentration of hydrogen ions (mol/L), g(HNO3) is the rate of HNO3 production due to irradiation (molecules/100eV), Edep is the total energy deposition due to fission product decay (MeV), VL is the volume of the sump water (L), and Na is the 6.022 × 10²³(molecules/mol). g(HNO3) is 0.007 molecules HCl/100eV [5].
3.1 Modification of SOLGASMIX-PV Code
SOLGASMIX-PV code is a computer program to calculate equilibrium relationships in complicated chemical systems. Chemical equilibrium calculations involve finding the system composition, within certain constraints, which contains the minimum free energy. The constraints are the preservation of the masses of each element present and either constant pressure or volume. SOLGASMIX-PV can calculate equilibria in systems containing a gaseous phase, condensed phase solutions, and condensed phases of invariant and variable stoichiometry. Either a constant total gas volume or a constant total pressure can be assumed. The detailed principles of which this program is composed are handled in Section 2.1 [2].
However, since there is no subroutine to calculate the amount of acidic and basic materials produced by the radiolysis reaction and pH, these calculation subroutines were incorporated in the Fortran source, from which the pH is derived from its definition given by Equation (6).
3.2 Validation of the Modified SOLGASMIX-PV Code
The modified SOLGASMIX-PV code was applied to several chemical systems in which the pH is well known and verified. A comparison of calculated and measured pH values in these systems, given in Table 2, shows that this technique is quite effective in yielding good calculated values of pH since each error is within about 0.3 pH unit.
3.3 Application of ORIGEN 2.1 Code
The ORIGEN 2.1 code is a versatile point-depletion and radioactive-decay computer code for use in simulating nuclear fuel cycles and calculating the nuclide compositions and characteristics of materials contained therein [6].
By using this code, it can calculate the mass and radioactivity for each radionuclide contained in the burned fuel at the time of an accident.
The procedure to determine pH of the sump solution is as follows;
(1) Calculate the boron and TSP molarities, for nuclear power plants which used TSP as the pH buffer, or boron and NaOH molarities, for nuclear power plants which used NaOH as the pH buffer, through the water source data of Final Safety Analysis Report (FSAR).
(2) Compute the mass and radioactivity for each radionuclide that is contained in the burned fuel at the time of an accident by using the ORIGEN 2.1 code and
[Table 2.] Comparison of Measured and Calculated pH Values
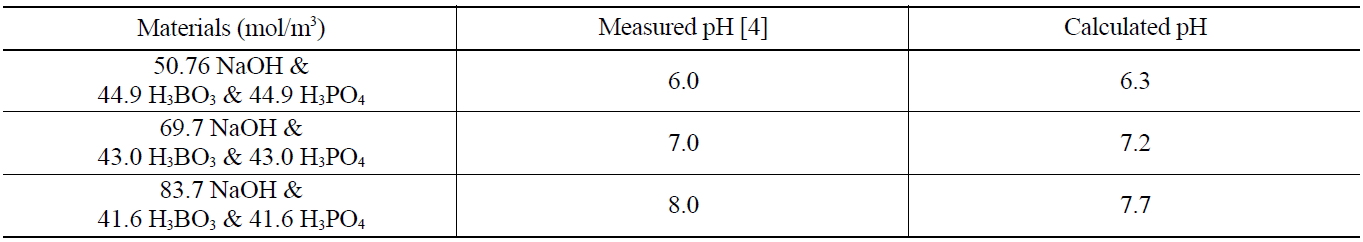
Comparison of Measured and Calculated pH Values
calculate the mass and radioactivity for each radionuclide that is introduced into containment by multiplying the fission product release fractions given in Table 7.
(3) Calculate the HCl, HNO3, and Cs molarities by applying the mass and radioactivity for each radionuclide to the equations in Section 2.2.
(4) Determine the pH of the containment sump solution by applying the molarities of all substances to the modified SOLGASMIX-PV code.
3. MATERIALS INFLUENCING ON PH OF SUMP SOLUTION
4.1 Acidic Materials in Containment
4.1.1 Boric Acid
Boric acid enters containment from accumulators, refueling water storage tanks, sprays, and the reactor coolant system. The Boron concentration attained in the sump is higher than any other acidic material.
4.1.2 Iodine as HI
Hydriodic acid (HI) is a strong acid, but very small amounts are produced in containment. It is important to retain iodine, generated chemically from this material, in liquid phase by maintaining above pH 7 of the sump solution.
4.1.3 Nitric Acid
Nitric acid is produced by the irradiation of water and air.
4.1.4 Hydrochloric Acid
The radiolysis reaction of electrical cable insulations which contain chlorine produces mostly HCl. This is known as de-hydro chlorination. This material is a strong acid and can have some influence on the pH of the containment sump solution.
4.2 Basic Materials in Containment
4.2.1 Basic Fission Product Compounds
Cesium enters containment in the form of cesium hydroxide, cesium borate, or cesium iodide. Cesium hydroxide and cesium borates are basic materials. Cesium hydroxide and cesium borates are basic materials. The concentrations of these materials in the sump depend on the volume of solution in containment.
4.2.2 Chemical Additives to Control pH
The pH buffer materials for use in containment must be borate or phosphate. Generally, the phosphate is in the form of TSP that is held dry in baskets located in containment. Borate buffers are made up of sodium hydroxide and boric acid stored separately and combined in spray systems.
After it is checked that the modified SOLGASMIXPV code is valid by comparing with measured pH values for ORNL experiments, the modified SOLGASMIX-PV code is applied to the SKN 3&4 and UCN 1&2.
5.1 ShinKori Nuclear Power Plant Units 3&4
5.1.1 Assumptions
The following conditions are assumed to compute the pH of the containment sump solution with consideration of the SKN 3&4 systems:
(1) A LOCA is postulated as a design basis accident,
(2) Following a LOCA, the following sources of water combine to form the maximum expected recirculated containment spray solution:
· In-containment Refueling Water Storage Tank (IRWST),
· Reactor Coolant System (RCS), including the pressurizer, 4 Safety Injection Tanks (SITs),
· Safety Injection System (SIS) piping, and Containment Spray System (CSS) piping,
(3) The minimum pH value is calculated with consideration of the maximum water source volume and the maximum initial boron concentration,
(4) The maximum pH value is calculated with consideration of the minimum water source volume and the minimum initial boron concentration,
(5) The dissolution rate of TSP is high enough to dissolve all TSP as soon as it is submerged into water. It is assumed that the TSP dissolution rate is constant and independent of the pH value,
5.1.2 Determination of Boron and TSP Molarity
Table 3 and 4 indicate various information on the volumes, chemical content and so on of the water sources in the SKN 3&4 in order to the compute minimum and maximum pH [7]. The minimum and maximum values of boron and TSP molarities are determined by such information. The minimum and maximum values of boron molarity are 0.407 mol/L and 0.3145 mol/L, respectively. The minimum and maximum values of TSP molarity are 0.021059 mol/L and 0.026528 mol/L, respectively.
[Table 3.] Information of the Water Sources in the SKN 3&4 to Calculate Minimum pH
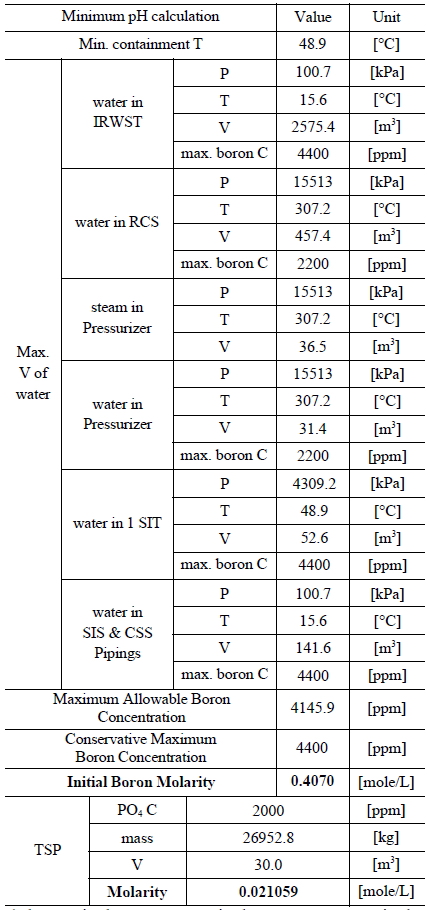
Information of the Water Sources in the SKN 3&4 to Calculate Minimum pH
5.2 Ulchin Nuclear Power Plant Units 1&2
5.2.1 Assumptions
The following condition is assumed to compute the pH of the containment sump solution with consideration of the UCN 1&2 systems:
[Table 4.] Information of the Water Sources in the SKN 3&4 to Calculate Maximum pH
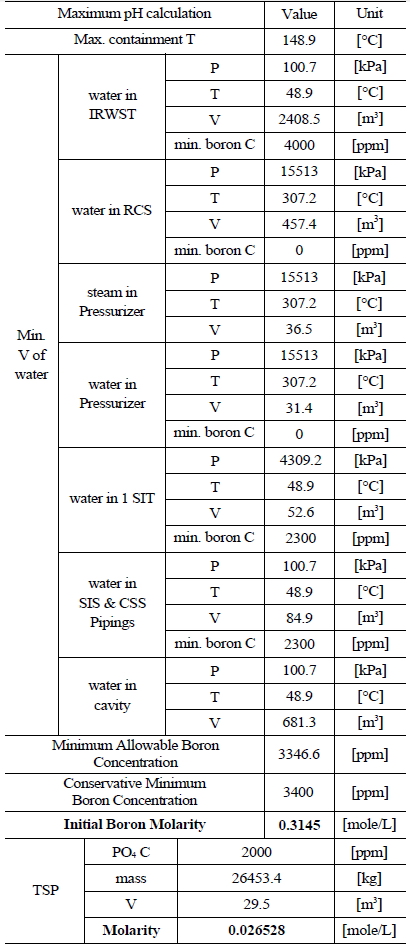
Information of the Water Sources in the SKN 3&4 to Calculate Maximum pH
(1) Following a LOCA, the following sources of water combine to form the maximum expected recirculated containment spray solution:
· Refueling Water Storage Tank (RWST), Reactor Coolant System (RCS),
· 3 Accumulators, Boron Injection Tank (BIT), and Boron Injection Surge Tank (BIST),
(2) All NaOH in the Chemical Additive Tank (CAT) is mixed with the water in the sump.
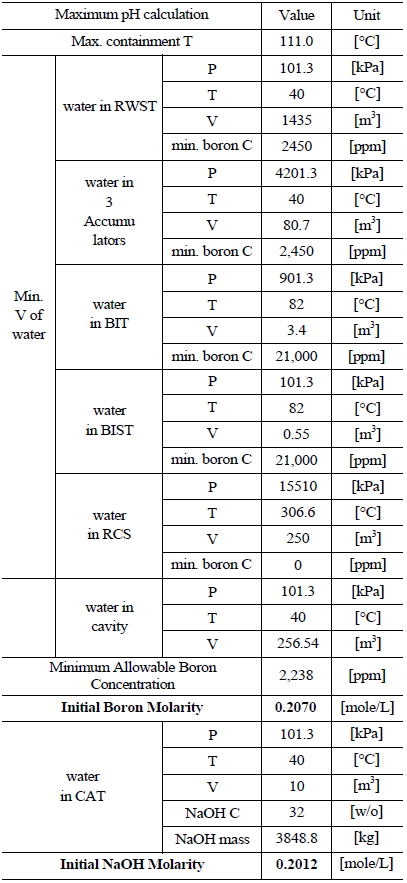
5.2.2 Determination of Boron and NaOH Molarity
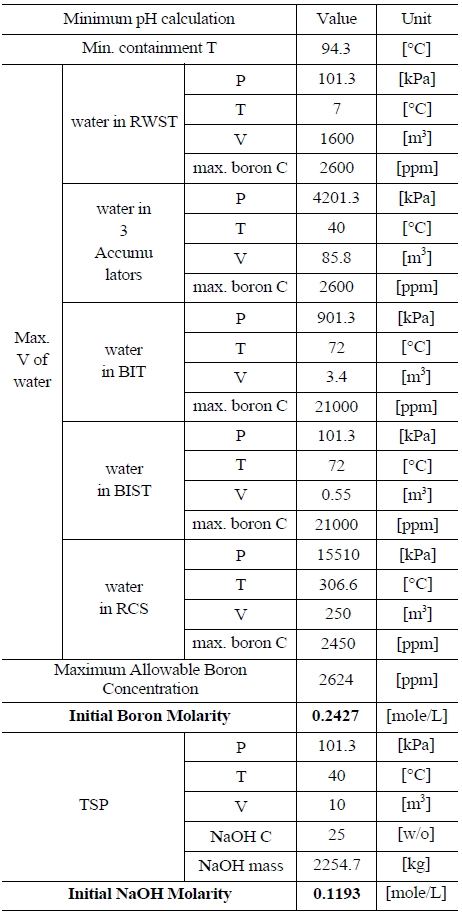
Table 5 and 6 indicate various information on the volumes, chemical content and so on of the water sources in the UCN 1&2 in order to compute the minimum and maximum pH [8]. The minimum and maximum values of boron and NaOH molarities are determined by such information. The minimum and maximum values of boron molarity are 0.2427 mol/L and 0.207 mol/L, respectively. The minimum and maximum values of NaOH molarity are 0.1193 mol/L and 0.2012 mol/L, respectively.
5.3 Effects on Fission Products and Radiolysis Reactions
5.3.1 Mass and Radioactivity of Each Fission Product
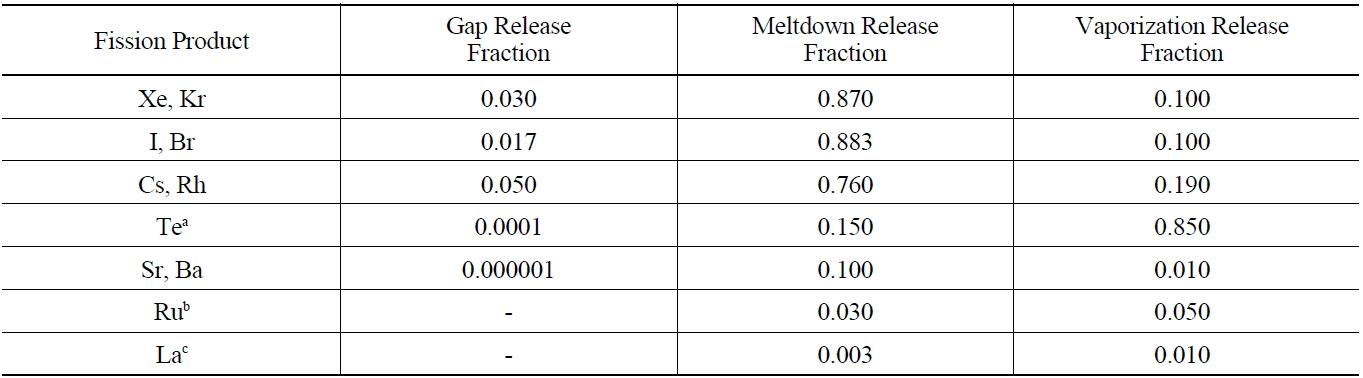
By using the ORIGEN 2.1 code, it can calculate the mass and radioactivity for each radionuclide that is contained in the burned fuel at the time of an accident. The extent to which fission products and actinides are released from reactor fuel and escape from the primary system is determined primarily by their volatility, with their chemical properties also playing a significant role. As in the Reactor Safety Study, it is useful to classify fission product releases into three groups and typical best estimates for the total gap release fraction are given in Table 7 for water-cooled reactor fuel elements [9]. The radionuclides released from the fuel gap have an influence on radiolysis due to the energy release rates of β-ray and γ-ray emitted by their radioactive decay. Since the energy release rates of β-ray and γ-ray of Iodine-131, Iodine-132, Iodine-133, Cesium- 134, and Cesium-137 are very high, these radionuclides are a great significance to radiolysis reaction. 100% Inert gases and 50% Iodine of the radionuclides within the coolant emitted by LOCA are released into the air of containment, but half of the released iodine adheres to equipment and the surface of the wall in containment.
5.3.2 Calculation of HCl Generation
The radiolysis reaction of electrical cable insulations which contain chlorine is caused by irradiations of beta and gamma rays that are emitted from the real radionuclides introduced into containment. This reaction leads to generate some hydrochloric acid in containment. The method for calculation of HCl generation is given in Section 2.2.1, resulting in 2.5 × 10?3mol/L.
5.3.3 Calculation of Nitric Acid Formation
Nitric acid is also produced by the irradiation of water and air since beta and gamma rays are emitted from the real radionuclides introduced into containment. The method
[Table 5.] Information of the Water Sources in the UCN 1&2 to Calculate Minimum pH

Information of the Water Sources in the UCN 1&2 to Calculate Minimum pH
for calculation of HNO3 formation is given in Section 2.2.2, resulting in 1.6 × 10⁻⁴ mol/L.
5.3.4 Calculation of Cesium
Cesium of the real radionuclides introduced into containment is mostly in the form of cesium hydroxide or cesium borate. It is possible to obtain the mass of cesium from the output of the ORIGEN 2.1 code, and recalculate it to the molarity of cesium, resulting in 6.9 × 10⁻⁴ mol/L.
[Table 6.] Information of the Water Sources in the UCN 1&2 to Calculate Maximum pH
Information of the Water Sources in the UCN 1&2 to Calculate Maximum pH
The containment sump solution contains the calculated quantities of substances, including tri-sodium phosphate (TSP) for the SKN 3&4 or sodium hydroxide for the UCN 1&2 as well as boric acid, hydrochloric acid, nitric acid, and cesium compound. The relationship between these materials is in the chemical equilibrium and then the pH of
[Table 7.] Fission Product Release Source Summary - Best Estimate Total Core Release Fractions

Fission Product Release Source Summary - Best Estimate Total Core Release Fractions
the sump solution is determined by the modified SOLGASMIX- PV code. The computational results are obtained for two nuclear power plants.
For the SKN 3&4, when all TSP is dissolved, the minimum pH is 7.02 and the maximum pH is 7.45 by the computation of the modified SOLGASMIX-PV code. For the UCN 1&2 on condition that very low concentration of lithium hydroxide (LiOH) is added in order to control the pH, when all sodium hydroxide is mixed, the minimum pH is 8.07 and the maximum pH is 9.41.
In this study, the SOLGASMIX-PV code was modified to accommodate the materials produced by radiolysis reactions. Also, the modified code was performed to calculate the pH of the sump solution applied to the SKN 3&4 and UCN 1&2. Through this study, the following conclusions were drawn.
(1) The modified SOLGASMIX-PV code is quite effective in finding the equilibrium state since all errors are within about 0.3 pH unit.
(2) The calculated pH of the sump solution for the SKN 3&4 is between 7.02 and 7.45 by the computation of the modified SOLGASMIX-PV code, while between 7.12 and 8.08 by the equilibrium constant technique. For the UCN 1&2, the calculated pH is between 8.07 and 9.41, while is between 8.3 and 9.5 by the equilibrium constant technique. Thus, the difference between the advanced technique and the conventional equilibrium constant technique is small.
(3) Also it was shown that radiolysis reactions have insignificant effects on pH because the relative concentrations of HCl, HNO3, and Cs are very low on the order of 10-3 to 10-4 mol/L.
(4) All the pH calculated for two domestic nuclear power plants are above 7.0, which meets the regulation of the U.S. Nuclear Regulatory Commission (NRC).

![Gibbs Free Energy for The Major Compounds at the Sump Operating Temperature [10, 11]](http://oak.go.kr/repository/journal/12572/OJRHBJ_2013_v45n1_107_t001.jpg)