It is generally acknowledged that economic growth is driven by the accumulation of knowledge-based factors of production such as human capital, R&D and innovation. Moreover, such knowledge-based production factors determine a nation’s long-term competitiveness in a global world (Grossman & Helpman, 1991). In this context, the so-called endogenous growth theory argues that technological advancement is particularly stimulated by R&D activities of profit-maximizing firms (Romer, 1994). R&D enters the production process as a factor of production and is used in conjunction with other inputs. On the other hand, as with any investment decision, R&D is not undertaken unless there is an opportunity for profit.
In many OECD countries specific tax incentives aimed at stimulating firms’ R&D investment activities have traditionally been kept (and even expanded) as an important measure of technology and innovation policy, although the majority of developed countries have carried out a series of ‘tax-rate-cut-cumbase-broadening’ corporate tax reforms in last two decades.1 This fact suggests that there has also been a sort of tax competition among the OECD countries regarding R&D promotion. In addition, the finding that social rates of return to R&D are substantially above private rates of return provides one of the main justifications for such government subsidies to R&D. Many believe that the lower private rates of return than the social rates cause the under-investment in R&D (Griffith, 2000). Furthermore, a tax-base subsidy appears to be the marketoriented response, since it leaves the choice of how to conduct and pursue the R&D programs in the hands of the private sector (Hall & van Reenen, 2000).
Another attractive feature of these instruments is that tax incentives can be more predictable and accessible for businesses than direct subsidies. A possible drawback of fiscal instruments is that firms will not concentrate on projects with a high social rate of return. An additional shortcoming was believed to be ‘that fiscal incentives are simply ineffective in raising private R&D spending – the response elasticity is so low it would take a huge tax change to generate the socially desirable level of spending. This [used to be] the conventional wisdom […]’ (Hall & van Reenen, 2000, p. 449). Such theoretical considerations for the preferential tax treatment of R&D investment are supported by a large number of previous empirical investigations, which suggest its positive impact on firms’ R&D spending in many OECD countries (see Table 1).
Compared with the case with usual fixed capital investment, financing constraints seem to apply more seriously to R&D investments (Bagella
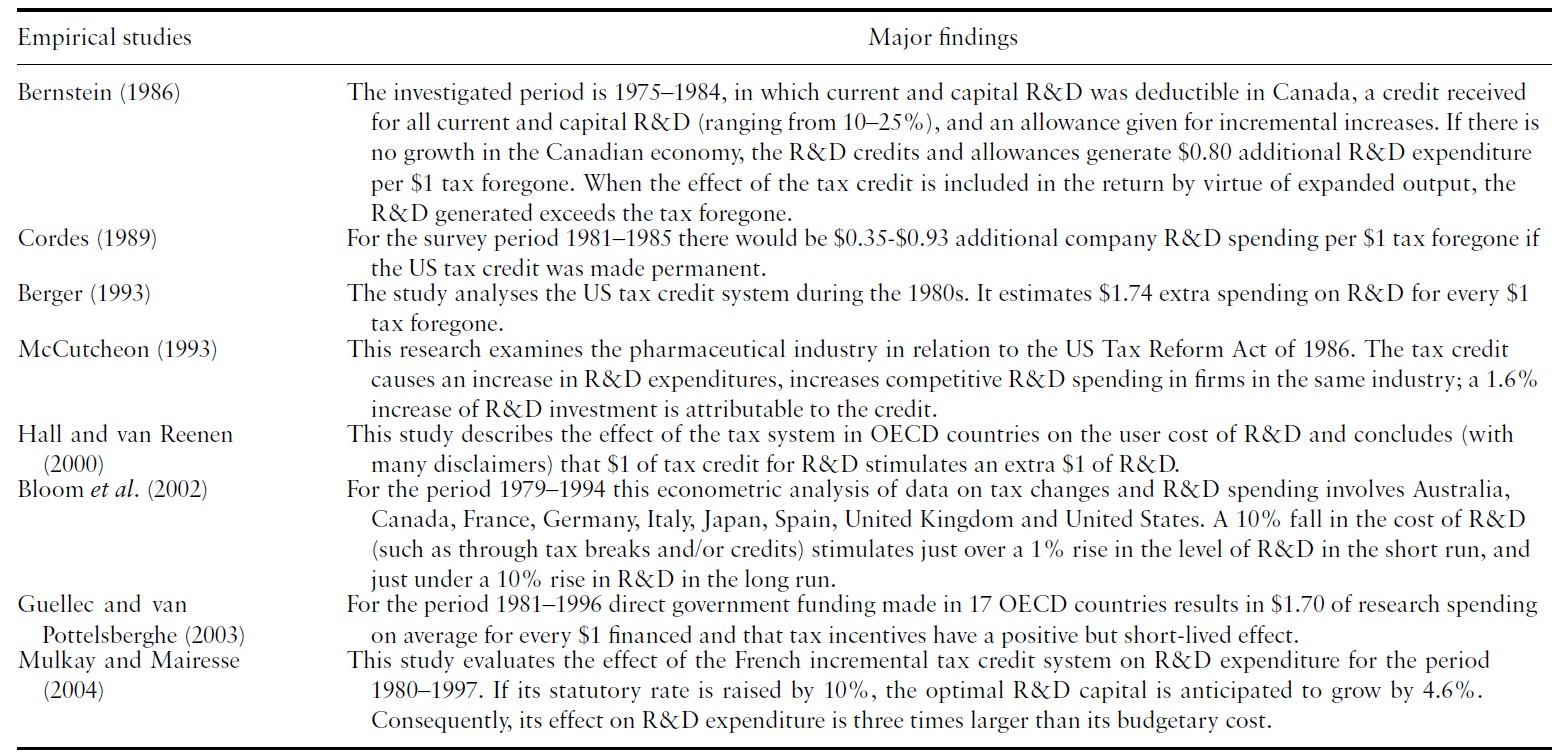
Positive effects of R&D-specific tax incentives revealed by selected empirical investigations
As a large number of studies have already shown, the tax system is acknowledged as:
Under the clear distinction between internal equity and debt finance, this study examines the generosity of various types of corporate tax incentives implemented in OECD countries to promote firms’ R&D investments on the basis of a net present value (NPV) model – a popular ‘forward-looking’ dynamic investment decision model.2 In other words, this study deals with a narrow scope of aspects related to corporate profit taxation and argues that discrete R&D investment decisions of profit maximising firms are dependent on the post-tax NPV. As with manyother previous research outcomes this study also confirmsthat the corporate tax system favours debt finance, since by a given tax depreciation scheme the absolute amount of after-tax NPV with debt finance is larger than that with internal equity finance. However, the explanation for the reasons is not only limited to the conventional, sole argument that corporate interest payments are deductible from the tax base, which in turn create extra tax savings. With debt finance, annual gross profits are also reduced by the amount of interest payments, from which the entire corporate tax burden is subtracted to calculate the posttax profits.3 Moreover, other than the case of financing investment cost by firms’ internal equity, the present value of debt-financed investment cost which is taken into accountwhen computing the after-taxNPVbecomes lower, since discounting (with the real interest rate) takes place for the repayment of the entire debt sum at the end of the given maturity years. The compound effect of all these features determines the superiority of debt finance. Yet, the preponderance of internal equity finance for R&D investment appears to be hardly explained in relation to the corporate tax incentive system, because the additional promotion effects (also expressed in terms of the post-tax NPV) of generous R&D-specific tax incentives over the normal depreciation rules (allowed for usual fixed capital investments) in the individual OECD countries remain the same, regardless of the different types of financial coverage of investment costs. Furthermore, with tax allowances and tax credits leading to the greatest R&D investment promotion effects in OECD countries, the after-tax NPV ceteris paribus increases with the corporate tax rate. This fact, in turn, suggests the possibility of stronger R&D investment promotion by adopting a sort of ‘tax-rate-
The structure of this paper is as follows. Section 2 explains the current R&D-oriented tax incentive systems in the OECD countries. After revisiting the Modigliani-Miller theorem of capital structure irrelevance, the third section technically describes the major nature of the present value model applied for the calculation of R&D investment promotion effects of the aforementioned tax policy measures. Section 4 illustrates the empirical results based on the calculated after-tax NPV under the plausible parameter assumptions and compares the international competitive position of individual countries led by the different R&D-promoting tax schemes. The final section summarises the major findings of the study and concludes.
1The lower corporate tax rate tends to increase the incentive to invest, while the lower allowance is likely to decrease it. Therefore, the combined effect appears to depend on the details of each tax-rate-cut-cum-base-broadening reformin the individual OECD countries (Devereux et al., 2002). 2The superior features of NPV over the calculation of effective (marginal and average) corporate tax rates (King & Fullerton, 1984; Devereux & Griffith, 2003; Sørensen, 2004; Devereux, 2004) include, for example, that (i) the development of gross return generated by an investment can be more adequately considered, (ii) the true economic depreciation rate is not assumed but endogenously derived from the trend of gross return, and (iii) firms most widely apply this method in practice, especially when carrying out the so-called feasibility study for checking overall profitability of investment projects (see also Nam & Radulescu, 2007). 3Consequently this leads to the reduction of the after-tax NPV.
2. Current Tax Treatment of R&D Investment in OECD Countries
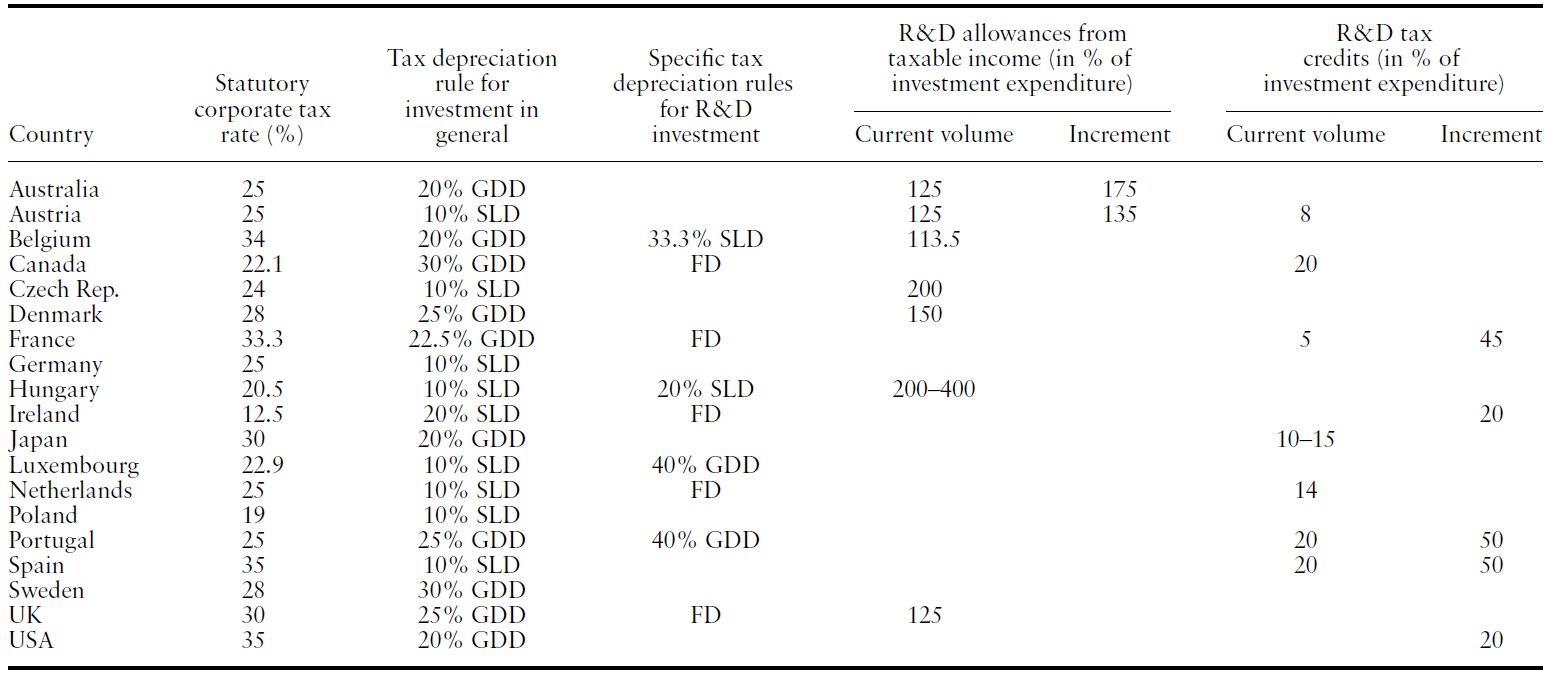
The statutory corporate tax rate is certainly important in determining the overall profit tax burden. However, this tax rate does not, in itself, establish the ultimate tax burden on a firms’ R&D investment activity. Equally crucial are the effects of depreciation and other investment promotion schemes that determine the tax base (Sørensen, 2004). In the practice of corporate tax policy, different tax depreciation rules are employed that do not typically ensure the true economic depreciation (Samuelson, 1964). Furthermore, their generosity has been extended to stimulate R&D investment activity of a firm. Similarly, the R&D tax allowances provide an additional deduction from taxable income of a firm, which indirectly lowers the amount of tax owed. In addition, the R&D tax credits are more widely applied in OECD countries that allow a deduction from the tax a firm must pay to tax authorities (Warda, 2006). Yet there are also countries that do not have any of the three types of R&D-specific tax incentive schemes, as was the case in Germany, Poland and Sweden in 2006 (Table 2).4
Apart from the different statutory corporate tax rates that vary from 12.5% (Ireland) to 35% (Spain) in 2006, Table 2 also delivers an overview of the R&D specific depreciation rules applied in selected OECD countries, when the normal tax life for equipment is assumed to be 10 years. For example, free depreciation (

Tax incentive measures for R&D equipment investment in selected OECD countries when normal tax life = 10 years (2006)
In 2006, R&D tax allowances were offered in some OECD countries, including Australia, Austria, Belgium, the Czech Republic, Denmark, Hungary and the UK. Most are volume-based, while Australia and Austria allowed a combination of both level-based and incremental allowances (see also Table 2). For a firm’s R&D investment made in collaboration with public research institutions, a special allowance of 400% (of investment spending) was possible in Hungary.
Several selected OECD countries allowed R&D tax credits in 2006. As also shown in Table 2, a larger share of countries (e.g. Austria, Canada, Japan and the Netherlands) offered this type of tax incentive based on the total volume of the firm’s R&D investment. On the other hand, purely incremental tax credits were popular in Ireland and the United States, of which amounts are determined as a percentage share of a firm’s R&D spending increase over some base period. France, Portugal and Spain had a mixed system of volume-based and incremental tax credits.5 According to Warda (2006), there has been a shift away from incremental towards volume-based tax credits over time. None of the east European OECD members had such an R&D promotion measure.
4In addition, the Slovak corporate tax system has not recently provided any specific preferential tax-treatment for R&D investment at all (see Mennel, 2007). According to OECD (2007), Sweden and Germany have traditionally been the OECD countries with the highest GDP share of business expenditures in R&D (BERD), while Poland and Slovakia are positioned at the bottom of the ranking in the period 2001–2005. 5South Korea also offers both a volume-based and an incremental tax credit, but these two credits are mutually exclusive, which means that a firm can claim only one of these credits (Warda, 2006).
3.1 Modigliani?Miller Theorem of Capital Structure Revisited
According to Modigliani and Miller (1958), the market value of a firm does not depend upon its capital structure, when conditions are satisfied, such as perfect markets (i.e. no taxes or transaction costs); the cash flows that are independent of financial structure; and riskless debt such that firms and individuals can borrow and lend at a risk free interest rate.
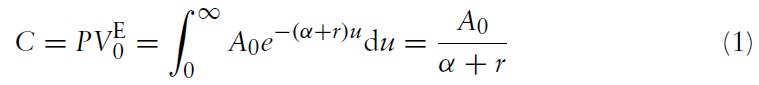
When (i) an investment costing C generates an infinite stream of future gross return; (ii) the return exponentially declines at rate α (0 < α < 1); and (iii) all prices are constant over time, an internal equity-financed investment project is on the margin of acceptance at the year of investment

if

where

= present value of asset at year 0 with equity finance. Under the assumption of perfect competitive market structure mentioned above, only one real interest rate exists in the financial market. Additionally, α is the same as Samuleson’s true economic depreciation rate (Samuelson, 1964; Atkinson & Stiglitz, 1980; Nam & Radulescu, 2007).
In the case of financing the investment cost

can be expressed:

Since the annual interest payment reduces the future gross return for

where

= present value of asset at year 0 with debt finance.With debt finance,

when

Rearranging equations (2) and (3) leads to

Hence, the traditional Modigliani-Miller theorem applies (see also Nam & Radulescu, 2005).
3.2 Effects of Tax Incentives for R&D Investment
In tax policy practice, various tax depreciation measures are employed that do not ensure true economic depreciation. Moreover, their generosity has been extended to stimulate private investment (Atkinson & Stiglitz, 1980; Sinn, 1987; Nam & Radulescu, 2005). For example, in the case of introducing the corporate tax rate t in combination with straight-line depreciation (
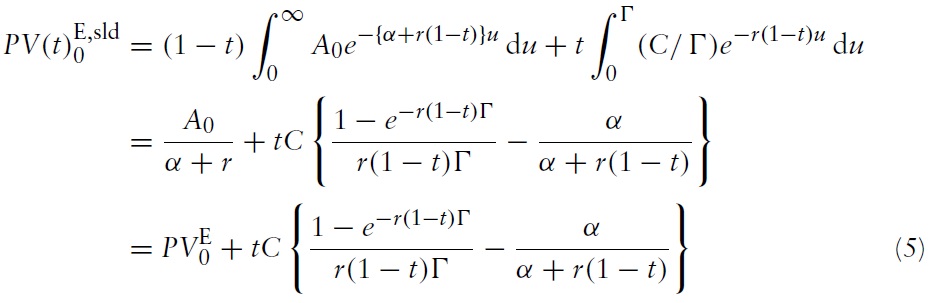
The application of
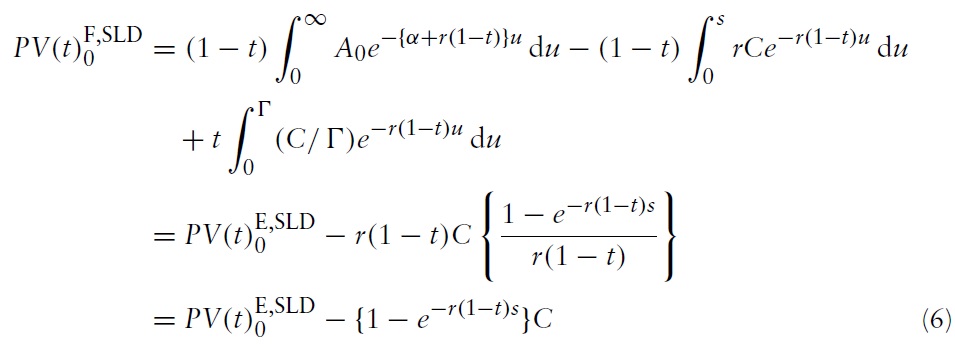
If the same investment is financed by debt completely, then
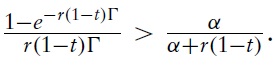
With 0 <

Furthermore

When 0 <

is always larger than

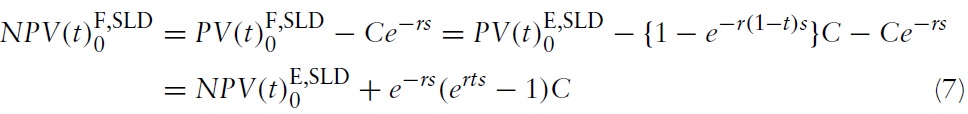
As shown in Table 1, R&D investment of firms is most commonly promoted in OECD countries by allowing specific tax allowances and tax credits, which are often combined with one of more generous tax depreciation rules (i.e. geometricdegressive and free depreciations) than those applied for ‘normal’ investments. In 2006, for instance, the British R&D-specific tax concession consisted of tax allowance (
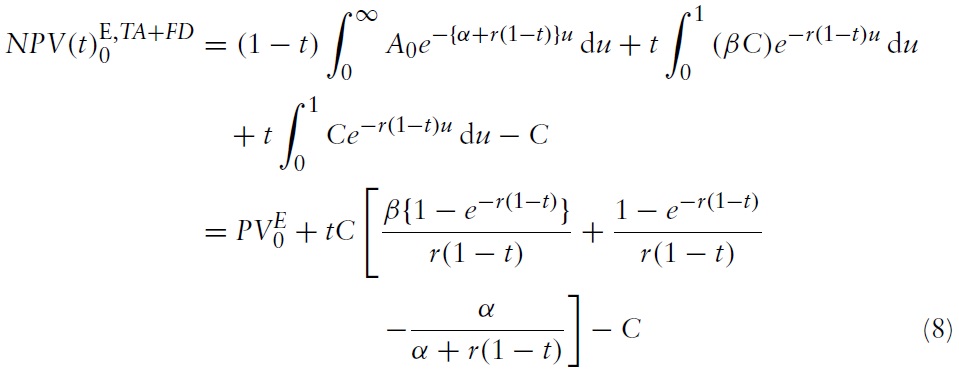
where
Analogous to equation (7), with debt financing

Hence, the ‘additional’ investment promotion effect of an R&D-specific tax concession over
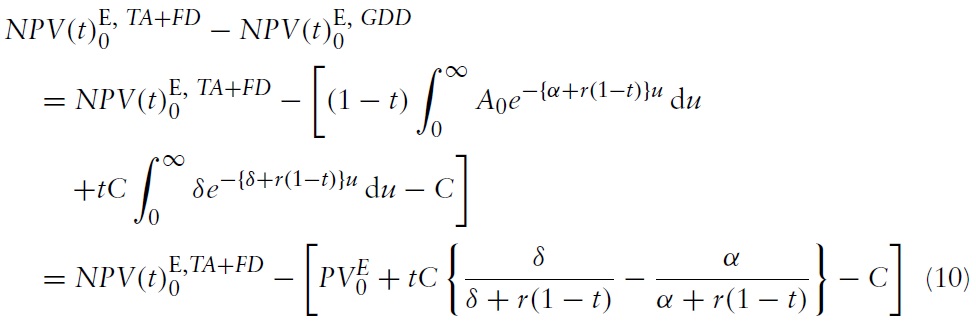
where δ = the
On the other hand, with debt finance
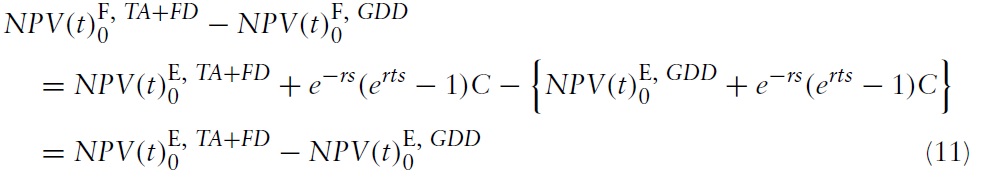
Taking the UK as an example, the comparison of equations (10) and (11) demonstrates that the additional investment promotion effect of generous R&D-specific tax concessions (and their combinations) over that of other standard tax depreciations allowed for normal investment projects remains unchanged, regardless of whether investment cost is covered by internal equity or debt.
6Analogously, the present value of tax saving that is generated by the deduction of an R&D-specific tax credit (TC) as a percentage share of current investment volume C from the payable tax amount at year 0 can be described as where γ = the rate of TC (0 < γ < 1). Similar to the case with TA, equation (F.1) can also be combined with various tax depreciation rules. For example, with FD (as was the case in Canada, France and the Netherlands in 2006) equation (8) can be modified correspondingly to In the case of adopting incremental TA and/or TC, their amounts are determined as a percentage share of a firm’s R&D spending increase (Y) over some base period, instead of C. 7If δ = α, then When δ < α, the corporate tax system does not provide any incentives at all regardless of the level of tax rate (0 < t < 1) and, therefore, the condition prevails. With δ > α, applies, which, in turn, means that GDD provides incentives in combination with t. In this case a corporate tax rate tmax exists, which maximises (see also Nam & Radulescu, 2005):
4. Major Results of Model Simulation
Under the consideration of different financial methods of R&D investments, this empirical section compares the effects of R&D-specific tax incentives on a firm’s after-tax NPV in 19 selected OECD countries for the year 2006. Two types of tax policy measures – statutory corporate tax rates and preferable tax treatment of R&D investment shown in Table 2 – differ from one country to another in the model simulation, whereas other relevant parameters such as real interest rate, economic depreciation, etc are given. Common assumptions made in the simulations are
Basically two different types of calculations on investment promotion effects are carried out in this empirical part: the first after-tax NPV computation for the case when the amount of R&D tax allowance and tax credit is measured on the basis of current investment volume
First, taking the British R&D promotion system as an example, Table 3 illustrates the changes of after-tax NPV according to the variation of the corporate tax rate

reaches maximum.With δ = 25%, column (II) shows that
is a ∩–shaped function of
when free depreciation is introduced as a R&D-specific incentive measure. For a given

Column (III) additionally highlights that ceteris paribus
continuously grows with
changes, when

as well as

in columns (V), (VI) and (VII) in the same table, for which the positive effect of 125% R&D-specific tax allowances play a dominant role in particular. These empirical findings have a somewhat adverse tax policy implication, namely that by given depreciation rules or R&D-specific tax incentives, a more intensive promotion of firms’ (R&D-specific) investments can be achieved in combination with a higher
[Table 3.] Effects of tax incentives for R&D investment classified into corporate tax rate
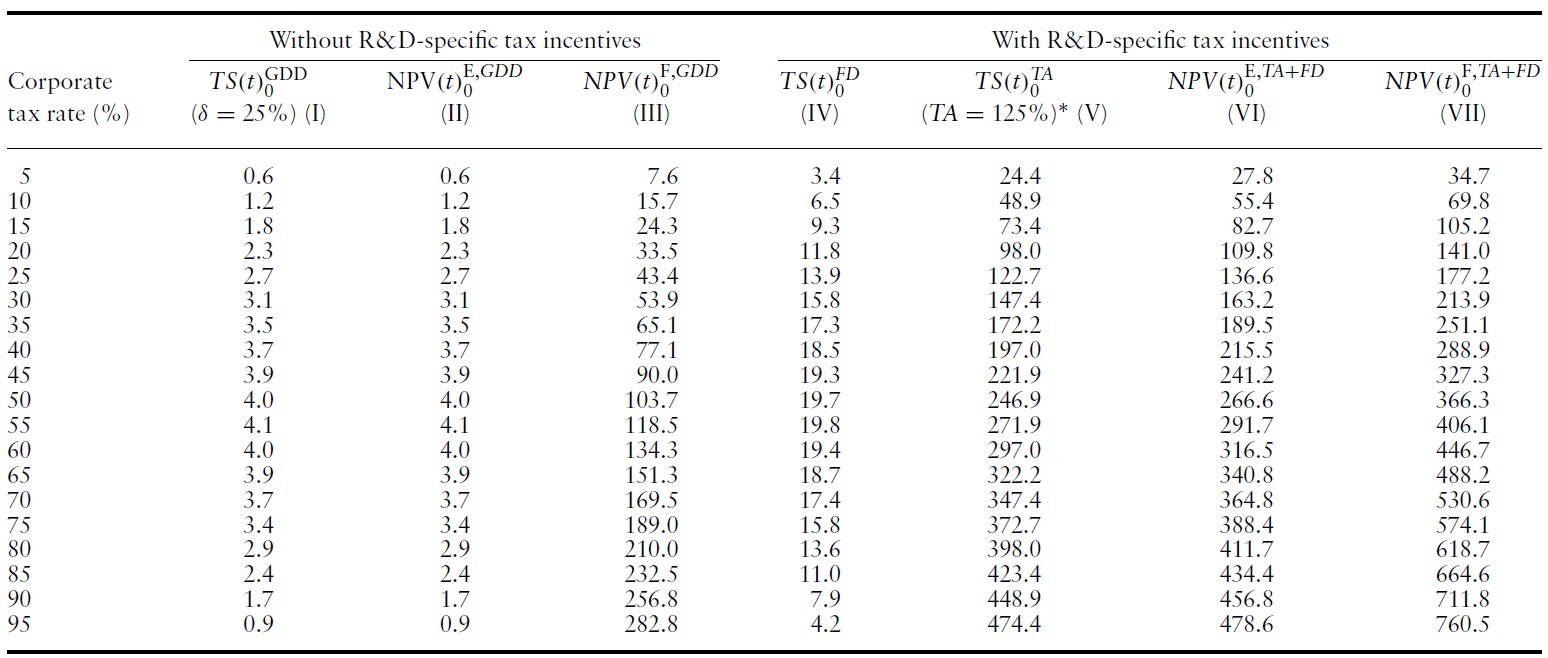
Effects of tax incentives for R&D investment classified into corporate tax rate
Among the surveyed OECD countries, Germany, Poland andSweden treated the R&D investment activities of private firms the same as different types of capital formation in 2006. Under the assumption of relevant parameters made above, the German and the Polish corporate tax rules did not provide any incentives at all when the R&D investment is financed by internal equity – a fact that is expressed in terms of negative
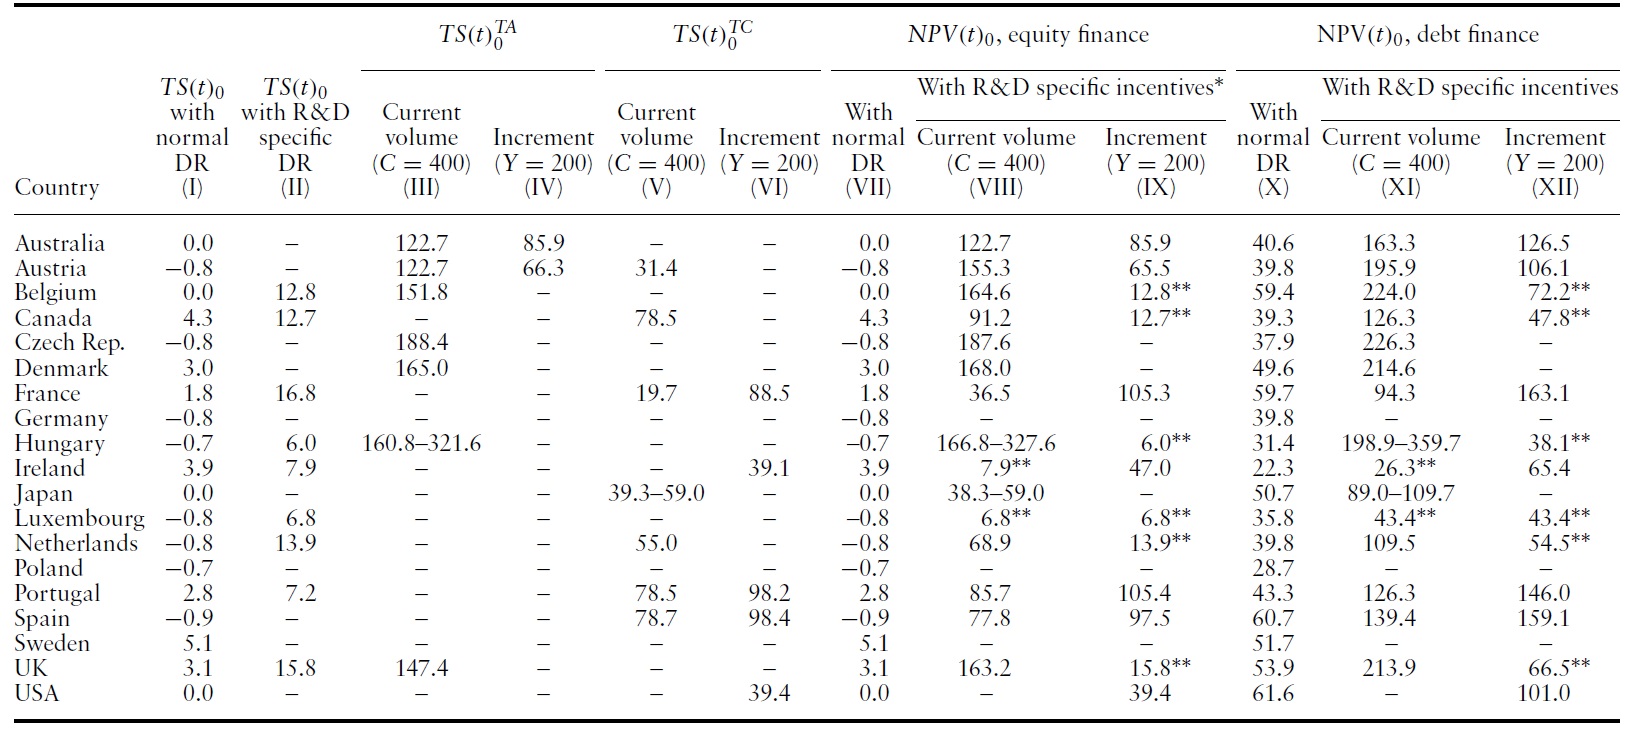
Columns (VIII) and (XI) of Table 4 demonstrate the after-tax NPV of OECD members when the rates of R&D tax incentive measures are calculated on the basis of current investment volume (i.e.
If the rates of tax allowance and tax credit are exclusively imposed on the incremental sum of investment (
[Table 4.] Comparison of effects of tax incentives for R&D investment in OECD countries in 2006

Comparison of effects of tax incentives for R&D investment in OECD countries in 2006
This study deals with the preferential tax treatment of R&D investment in selected OECD countries. Many member countries have exceptionally kept and even extended such a tax-base subsidy system as an important technology and innovation policy measure, although they have recently carried out a series of ‘taxrate-cut-cum-base-broadening’ corporate tax reforms. This fact suggests that there has been a sort of tax competition among the OECD countries regarding R&D promotion.
Clearly differentiating financing methods between internal equity and debt finance, this study computes and compares the after-tax NPV in order to identify the generosity of various types of tax incentives implemented in OECD countries that are aimed at stimulating firms’R&Dinvestments in the context of a corporate tax system. Analogous to many other previous research findings, this study also confirms that the corporate tax system favours debt finance, since by a given tax depreciation scheme the absolute amount of after-tax NPV with debt finance exceeds that with internal equity finance.Yet, the major reasons for the superiority of debt finance encompass more than the conventional deductibility of interest payment from the tax base, which creates extra tax savings. For example, with debt finance, annual gross profits are also reduced by the amount of interest payments, from which the entire corporate tax burden is subtracted to calculate the post-tax profits. Moreover, compared to the investment cost covered by firms’ internal equity, the present value of debt-financed investment cost considered in the calculation of the after-tax NPV is lower, since discounting (with the real interest rate) occurs for the repayment of the entire debt sum at the end of the given maturity years. However, the preponderance of internal equity finance for R&D investment can hardly be explained in relation to the corporate tax incentive system, because the additional promotion effects (also expressed in terms of the post-tax NPV) of generous R&D-specific tax incentives over the standard depreciation rules (allowed for usual fixed capital investments) in the individual OECD countries, remain unchanged regardless of the financing method.
The OECD comparison demonstrates that R&Dtax allowanceswere the incentive measure that generated the most substantial tax savings in 2006. In this year the top after-tax NPV ranking group was led by the Czech Republic, followed by Belgium, the UK, Denmark, Hungary and Austria as well as Australia – all these countries had a R&D allowance scheme. Endowed with R&D tax credit, Canada, Portugal, Spain and the Netherlands belong to the middle ranking group. Notably, with such tax allowances and tax credits, the after-tax NPV ceteris paribus increases with the corporate tax rate. This positive correlation, in turn, suggests the possibility of achieving a stronger R&D investment promotion by adopting a ‘tax-rate-