Rapid advances in electronics technology have led to a reduction in the size of electronic devices: integrating the electronic circuit [1], reducing size of a pixel [2], etc. These technical trends have in turn resulted in a reduction in power consumption [3], an increase in the speed of devices [4], and convergence between technologies. However, these advantages have been accompanied by problems, such as heat generation, fabrication issues, the short-channel effect, and cross talk. In particular, cross talk refers to interference caused by the coupling of energy between signal transmission lines [5], and it is a major problem that make it difficult to distinguish between pixels in the display or from an image sensor. In other words, cross talk leads to users’ image information that is different from the original images.
In color filters of imaging devices, one pixel is consisted of three or four sub-color pixels which transmit the light only in the primary color range, red, green, or blue. For example, a red light passes through the red -sub pixel while it is shielded by the other sub pixel region. As the aperture of the primary light becomes smaller, the wavefront of the light is distorted by diffraction phenomenon and results in cross talk [6]. A dye- or color-resist-based conventional color filter (CRCF) increases the cross talk for pixel sizes less than 2 µm [7, 8]. CRCFs are weakened by heat, chemicals and ultraviolet (UV) light. Thus the degradation from those environmental factors reduces the lifetime of the device in which it is used. In addition, since the absorption coefficient of photoresists is small, it is difficult to reduce the thickness of devices containing CRCFs [9]. Therefore, it is impractical to use CRCFs for small imaging applications.
A nano sized thin metal film hosts a unique optical phenomenon, surface plasmons (SPs), which is a collective oscillation movement of the free electrons of the metal surface at the metal-dielectric interface [10]. When a metal surface is corrugated periodically, SPs enhances the oscillation movements with a specific frequency, called the surface plasmon resonance (SPR), in particular, if the grating is formed into holes, SPR causes extraordinary optical transmission (EOT) at the resonance frequency (or wavelength range). In this way, plasmonic color filters (PCFs) can be used as optical band pass filters [9, 11-20]. PCFs have advantages over CRCFs. They are easy to design because the filtering range in which the SPR phenomenon occurs is controlled only by the physical dimensions of the structure rather than the absorption properties of materials. In addition, they are highly stable against heat and UV radiation. In this regard, many studies on PCFs have reported that the filtering function is an alternative to CRCFs with a sub-micron size.
Most studies on PCFs have focused on improving the transmission efficiency. The decreasing pixel size has facilitated the achievement of high-resolution, and cross talk verification is necessary before PCFs are used. In this study, we investigated the cross talk in these filters through simulations. Even when the pixel size became sufficiently small, we attempted to examine the robustness of the filters against cross talk. The results of this study are expected to be useful for the application of filters in high-resolution displays or image sensors. Thus, the results can serve as guidelines for the practical use of PCFs.
The Finite Difference Time Domain method (FDTD: simulation software developed by Lumerical Solution Inc., CANADA) was used for all experimental processes. The monitor was positioned 2 to 10 µm from the filter. The simulation was conducted in two dimensions with two unit pixels, and the boundary conditions were set to
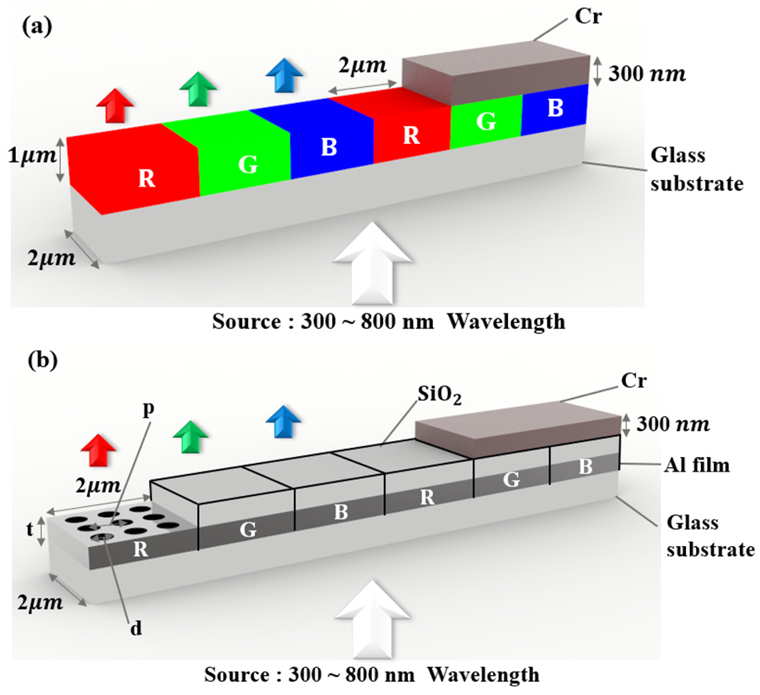
Figure 1 shows the structure of each filter. For the comparison of the PCF and CRCF in the presence of a large amount of cross talk, the sub-pixel size of both filters was set to 2 µm×2 µm. In order words, the unit pixel size was 6 µm×2 µm. The substrate was glass, and color resists with high transmittance in each red (R), green (G), and blue (B) wavelength ranges were deposited on the top of substrate. The designed CRCF was taken from previous works (the structure [21] and the refractive index values of the materials [22]). These color resist materials allowed narrow transmittance and only at the transmission wavelength corresponding to each color. The color resist thickness in the CRCF was set to 1 µm, since the cross talk was severe at a distance of 2~10 µm from the filter when resist thickness was 1 µm [23]. For the PCF, the metal film causing SPs was an aluminum (Al) film. Al was used along with a high plasma frequency for achieving a short central wavelength [20]. For the PCFs to be similar to the optical properties (central wavelength, narrow bandwidth, and similar peak transmittance) of the CRCFs, they are designed as follows. Metal films with thickness (
As mentioned above, when the thickness of color resist is 1 µm [23], a large amount of cross talk appeared at a distance of 2~10 µm from the filter. Therefore, the monitor position was set to measure the cross talk in this distance range (step: 1 µm).
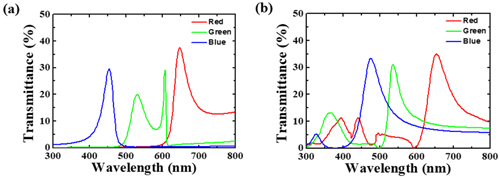
Figure 2 illustrates each designed filter’s transmission spectrum. For CRCFs, the main peak wavelengths are 645 (R), 530 (G), and 455 nm (B), and the main peak values are 37.0% (R), 19.9% (G), and 29.6% (B). The full-width-at-half-maximum (FWHM) values of the main peaks are 53 (R), 49 (G), and 35 nm (B). The spectrum corresponding to green has two peaks at 530 and 605 nm, with the sub-peak at 605 nm being very steep and having a peak value of 29%. Furthermore, the red filter spectrum contains a tail in the right side of the peak. The smallest intensity in that wavelength region is one-third the value of the main peak at 700 nm. The spectrum of the blue filter decreases more gradually to the left area of the peak compared to the right.
For the case of the PCF, peak wavelengths are 650 (R), 535 (G), and 475 nm (blue), and the main peak values are 34.5% (R), 31.2% (G), and 23.5% (B). The FWHM values of the main peaks are 83 (R), 46 (G), and 69 nm (blue). The PCFs had a lager bandwidth than the CRCFs. The CRCFs had only the transmission wavelength corresponding to each color. On the other hand, the PCFs shows a non-zero transmittance intensity that shares not only the corresponding color wavelength, but also some of the different color wavelength. The gradually decreasing tail to the right area of each peak contains the other wavelength region. The blue filter had a transmittance of 13.5% at 535 nm, which is about 40% of the main peak of the green filter. The green filter had a transmittance of 8.63% at 655 nm, a quarter of the main peak of the red filter. Furthermore, there are small peaks in the short wavelength region.
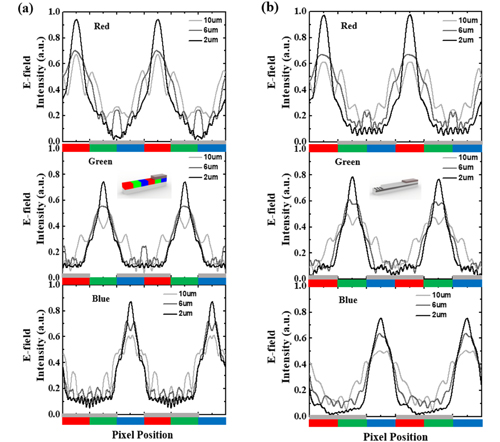
Figure 3 shows the electric field profile for different monitor positions. For each filter, all profiles correspond to the peak wavelength of the filter. The profiles were used to examine the cross talk phenomenon for the case of the peak wavelength light. All filters had the highest intensity at the pixel area where they were not blocked by the shield. The unwanted intensities in the shielding are cross talk and work as noise information for a distinction between pixels. Firstly, we examined the cross talk phenomenon by checking the spatial profile in the pixel region. All measured peak values were those of the first unit pixel.
The electric field intensity for the case of the red pixel aperture resulted in broader spatial profiles. For the 2 µm distance from the top surface of the red CRCF for example, the distance from the position having highest intensity value to the position having minimum intensity value of the peak is about 2.7 µm. As a result, the red light provide information through all the pixel region even though the spatial intensity is highest in the red pixel region. The distance between the maximum and minimum values of the profile peak reduces as the wavelength of the transmitted light becomes shorter, about 1.6 µm and 1.4 µm for the green and blue filters, respectively. For PCFs, the widths of the peaks of the profiles are narrower compared to those of CRCFs. At the 2 µm distance, the distance from the maximum and minimum values of the peak were about 2 µm (R), 1.3 µm (G) and 1.3 µm (B).
In a comparison of the cross talk at different distances from the filter in the green pixel, the peak intensity value in the non-shielding areas of the CRCF was 0.741 at a distance of 2 µm, and the peak intensity values in the shielding areas were 0.111 (R) and 0.112 (B). The difference between the peak intensity values of the shielding and the non-shielding areas was calculated from the difference between the higher intensity of the shielding area pixels and the intensity of the non-shielding area pixels. For the blue and green pixels, the difference between peak intensity values was 0.629. Furthermore, the ratio of the peak value in the shielding area to that in the non-shielding area was 15.11%.
At a distance of 2 µm for the PCF, the peak intensity value of the green pixel, which was in the non-shielding area, was 0.784. The peak values in the shielding area were 0.118 (R) and 0.108 (B). The difference between the red pixel with higher intensity and the green pixel in non-shielding areas was 0.666, and the ratio of the peak value in the shielding area to that in the non-shielding area was 15.05%. At the distance of 2 µm, the difference between the peak values of the non-shielding and shielding areas for the PCF was greater than that for the CRCF. PCFs also showed a smaller amount of cross talk than CRCFs.
For the CRCF, for the case of the green pixel at the distance of 10 µm, the peak intensity values were 0.331 (R), 0.496 (G), and 0.335 (B). In particular, the difference between the peak intensity values of the green and the blue pixel was 0.161. Furthermore, the ratio of the peak value in the shielding area to that in the non-shielding area was 67.54%. For the PCF, for the case of the green pixel at distance of 10 µm, the peak intensity values were 0.315 (R), 0.497 (G) and 0.323 (B), and the difference between the peak intensity values of the green and the blue pixels was 0.174. Furthermore, the ratio of the peak value in the shielding area to that in the non-shielding area was 64.99%.
At the distance of 10 µm, the peak intensity value difference for the PCF was greater than that for the CRCF. The PCFs also showed a smaller amount of cross talk than the CRCFs. With an increase in the distance from the filter, the difference between the intensity of the shielding area and that of the non-shielding area decreased. In other words, the cross talk increased with distance from the filter. When the cross talk was calculated as a peak value, the PCF had a smaller amount of cross talk than the CRCF.
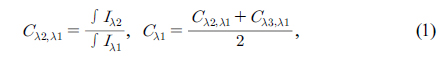
The analysis with a peak value, i.e., the maximum value of the unwanted intensities has a limit to the extent to which a qualitative analysis can be used to compare the cross talk of the CRCFs and the PCFs. Therefore, a quantitative analysis was also performed by considering all pixel areas. The following equations were used for the analysis:

where
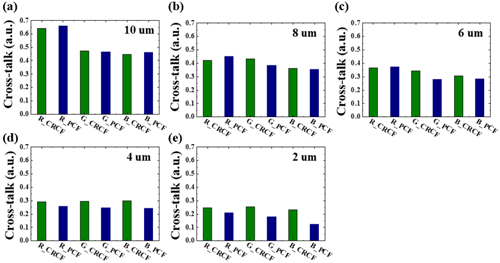
Figure 4 presents cross talk values calculated using Eq. (1) for the CRCFs and the PCFs for different distances of the profile monitor from the filter (2~10 µm; step size: 2 µm). Although the PCFs showed a smaller amount of cross talk than the CRCFs for most distances, the reverse was observed for the red pixels for some distances. When the distance of the profile monitor from the filter was 2 µm, the cross talk values for the CRCFs were 0.2450 (red pixel), 0.2555 (green pixel), and 0.2324 (blue pixel). The values for the PCFs were smaller for all sub-pixels, amounting to 0.2112 (red pixel), 0.1795 (green pixel), and 0.1229 (blue pixel). At the distance of 4 µm, the PCFs again showed lower cross talk values for all sub-pixels. However, when the distance is 6 µm, the CRCFs showed smaller cross talk values than the PCFs for the red pixels (CRCF: 0.3656; PCF: 0.3747). Even for the distance of 8 µm, CRCFs showed smaller cross talk values for the red pixels, with the cross talk values being 0.4234 (CRCF) and 0.4524 (PCF). In addition, at the distance of 10 µm, the CRCFs resulted in smaller cross talk values than PCFs for the blue and red pixels: 0.6422 (CRCF_
Table 1 presents the cross talk values for each filter for the various positions considered in this study. A total of nine distance (2~10 µm) were considered, and the cross talk values were obtained for 27 cases including 9 distances with 3 sub-pixels (R, G, and B) for each distances. The CRCFs showed a smaller amount of cross talk than the PCFs for the red pixel at the distance of 6, 8, and 9 µm At the distance of 10 μm, the CRCFs showed a smaller amount of cross talk than the PCFs for the red and blue pixels. At 22 cases, excluding the aforementioned five cases, the PCFs showed a smaller amount of cross talk. In other words, the PCFs showed less cross talk than the CRCFs at approximately 82% of the results measured at a distance of 2~10 μm. Thus, the PCFs were more robust against cross talk. In addition, the further the distance from the filter, the more cross talk there was. For the case of the PCF, the average cross talk of three sub-pixels at the distance of 2 μm was 0.1712. For the distance of 6 and 10 μm, the average cross talk of three sub-pixels was 0.3122 and 0.5291, respectively, which are 1.82 times (at 6 μm) and 3.09 times (at 10 μm) higher than the value at the distance of 2 μm.
[TABLE 1.] Cross talk value of each sub-pixel for each filter according to monitor position
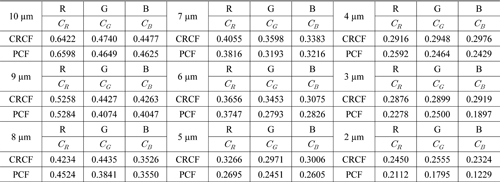
Cross talk value of each sub-pixel for each filter according to monitor position
With the exception of partial positions, the PCFs showed a smaller amount of cross talk than the CRCFs. The reason for the reverse observation at red pixels for some distances is that the green and blue filters in the PCFs partially transmit in the red wavelength region. As shown in Fig. 2, the spectral of the blue and green PCFs have long tail shapes in the right side of the peak and it results in non-zero transmittance at 655 nm. For the PCF, the green filter was transmitting 8.63% in the red wavelength areas and the blue filter had 6.7% transmittance in red wavelength areas. These transmittances were 25.0% (G) and 19.4% (B) of the peak transmittance of the red filter at 655 nm. The shorter lifetime of SPs make slow decay of the transmission spectra in the right side of the peak [24]. This means that the blue and green pixels are still weakly affected by SPs even at 655 nm, which does not exactly correspond to the dominant SPR wavelength. And finally the enhanced SPs in the blue and green areas propagate through the surface of the metal-dielectric interface and possibly couples to the light directly passing through the red pixel.
The broadness of the electric field profile is also the cause of the cross talk effect. The spatial pattern of the electric field profile at each distance originates from the diffraction pattern. The larger wavelength results in the wider space between high intensities approximated by the sinc function of the wavelength. Thus, a larger wavelength results in a broader intensity profile, and consequently the red light showed more cross talk for other sub-pixel areas as a whole. Small additional transmission due to SPs in the blue and green pixels and the broader intensity profile of the red light would have caused the results all at once.Nevertheless, for the PCF, a smaller amount of cross talk compared with that for the CRCF was observed for the red pixel at five of the nine distances. In other words, PCFs are superior in terms of robustness against cross talk, despite their worse filtering properties. Furthermore, owing to their metallic structure, they are highly stable under UV or high heat conditions. For high-resolution displays, PCFs can be used as an alternative to conventional color filters.
For the implementation of high-resolution imaging applications, cross talk is an important factor that should be addressed. In this study, we show that PCFs are robust against cross talk from adjacent filters of different colors under the conditions in which conventional color filters show a large amount of cross talk. The PCFs showed less cross talk than the CRCFs at about 82% of the results measured at a distance of 2~10 μm. With great filtering properties, cross talk phenomenon in the PCFs could be reduced. Owing to their robustness against cross talk, the PCFs offer an alternative to conventional color filters and are better suited for high-resolution imaging applications.