검색 전체 메뉴
PDF
맨 위로
OA 학술지
Prediction of Glucose Concentration in a Glucose-Lactose Mixture Based on the Reflective Optical Power at Dual Probe Wavelengths
  • 비영리 CC BY-NC
  • 비영리 CC BY-NC
ABSTRACT
Prediction of Glucose Concentration in a Glucose-Lactose Mixture Based on the Reflective Optical Power at Dual Probe Wavelengths
KEYWORD
High glucose concentration , Correlation coefficient , Glucose-lactose mixture , Reflective optical power
  • I. INTRODUCTION

    The detection of high concentrations of glucose in complicated mixtures has attracted an abundance of attention in the food, beverage, and fermentation industries, as well as in the treatment of disease in domestic animals, where glucose mostly acts as a vital substance and is present in high concentrations, from 1 to 10 g/dL [1-8]. Schemes employing highly efficient liquid chromatography and glucose oxidase have been used to predict high glucose concentrations in a complex situation [2-8]. However, most previous approaches were susceptible to several critical disadvantages, including sample destruction, short enzyme lifetime, long measurement time caused by either the catalytic reaction or substance separation process, and high cost resulting from immobilization of the enzyme. To mitigate these issues, optical detection schemes have been adopted for their salient features, including an enzyme-free process, fast response, and the potential for noninvasive detection. Absorption spectroscopy based on Beer’s Law assumes a linear relationship between glucose concentration and absorbance [9-14], which is only good for concentrations below hundreds of mg/dL [15]. It has been noted that a bulky, expensive spectrometer is required to continuously monitor the absorption spectrum [10, 12].

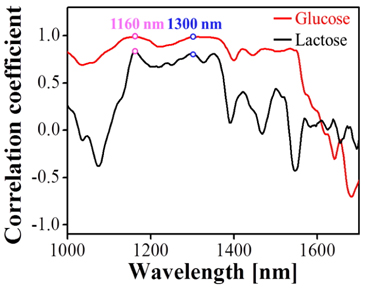
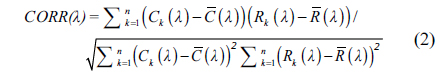
    In this paper, an enzyme-free optical method is proposed and demonstrated to predict high concentrations of glucose in a glucose-lactose mixture, by drawing upon the reflective optical power observed at two probe wavelengths. It is noted that lactose in particular is selected as the interfering material to better mimic practical situations, considering that it is one of the most common components of food and beverages [16]. By investigating the wavelength-dependent correlation coefficient (CORR(λ)) for the reflection spectrum and concentration of pure glucose/lactose solution, conspicuous candidates for the probe wavelengths are initially selected to exhibit a linear relationship between reflective power and glucose/lactose concentration. A set of proportionality coefficients is subsequently derived to develop a predictive equation, which is eventually validated by comparing predicted and actual glucose concentrations.

    II. PROPOSED GLUCOSE DETECTION USING REFLECTIVE OPTICAL POWER FROM A GLUCOSE-LACTOSE MIXTURE

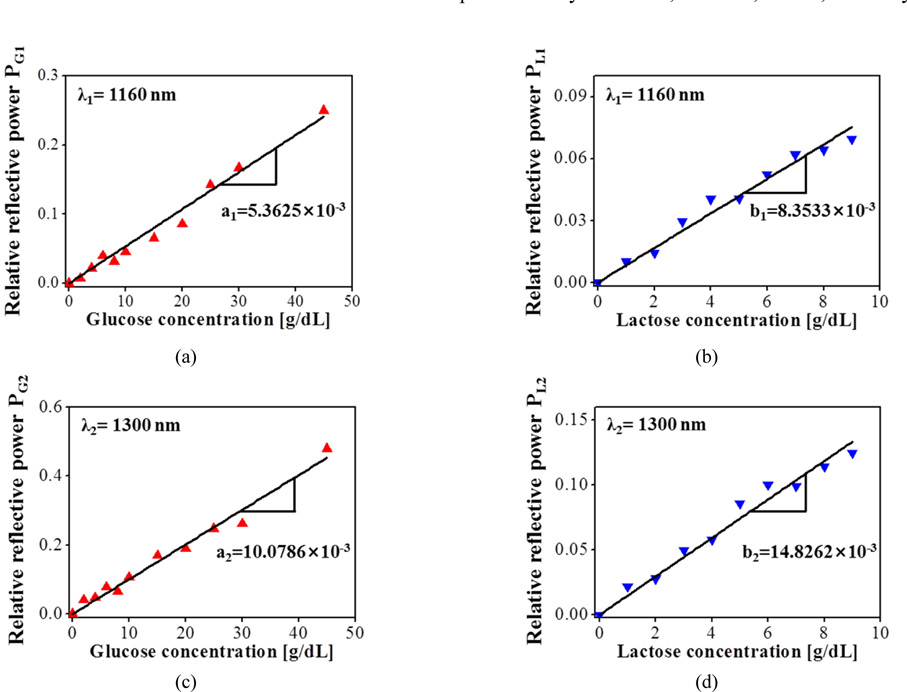
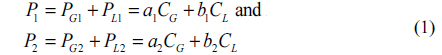
    Rather than using absorption spectroscopy based on Beer’s Law, we aim to predict glucose concentrations as high as several g/dL in a glucose-lactose mixture by exploiting the reflective optical power available from the mixture. This power is observed by employing a mirror, without resorting to a spectrometer, which is potentially desirable for noninvasive glucose detection. Actually, the prediction relies on the relative optical power, which is tantamount to the observed optical power normalized with respect to the signal available from pure water. The proposed detection scheme involves the following two equations, implying a linear relationship between the concentration of pure glucose/lactose solution and the corresponding reflective power [13, 17]:

    image

    For i = 1 or 2, PGi, PLi, and Pi respectively represent the reflective power for a pure glucose solution, a pure lactose solution, and a glucose-lactose mixture, which are obtained at a probe wavelength λi. CG and CL refer to the concentration of the pure glucose and lactose solutions respectively. The coefficients of proportionality are accordingly designated by ai and bi.

    We have chosen probe wavelengths λ1 and λ2 under the condition that the magnitude of CORR(λ) between the reflection spectra and concentrations is in the vicinity of 1 for both pure glucose and lactose solutions. The reflection spectra for the pure glucose and lactose solution have been normalized relative to the spectrum of pure water. The correlation coefficient is determined by the following equation:

    image

    For a total of n different glucose solutions, Ck(λ) and Rk(λ) respectively denote analyte concentration and reflection spectrum associated with the kth glucose solution. C(λ) and R(λ) are the relevant average concentration and reflection spectrum [18]. This procedure has been similarly applied to the case of lactose as analyte. CORR(λ) may be either positive or negative; a negative value indicates that the corresponding reflection spectrum decreases when the concentration of glucose or lactose increases. When the two probe wavelengths had been determined, the linear coefficients a1, b1, a2, and b2 for glucose and lactose, per Eq. (1), were found by examining the reflective power from a group of reference solutions of glucose and lactose with different concentrations. According to Eq. (1), the glucose concentration is given by CG = (b2P1b1P2) / (a1b2a2b1). The predictive performance is evaluated in terms of the standard error of prediction (SEP):

    image

    For a total of n glucose-lactose mixtures, CGk and ĈGk are the kth actual and predicted glucose concentrations, respectively, while the average difference between the predicted and actual glucose concentrations is expressed by Bias [19]. The SEP, having the same units of g/dL as the glucose concentration, basically indicates the standard deviation of the error between predicted and actual glucose concentrations.

    III. VALIDATION OF THE PROPOSED GLUCOSE DETECTION SCHEME

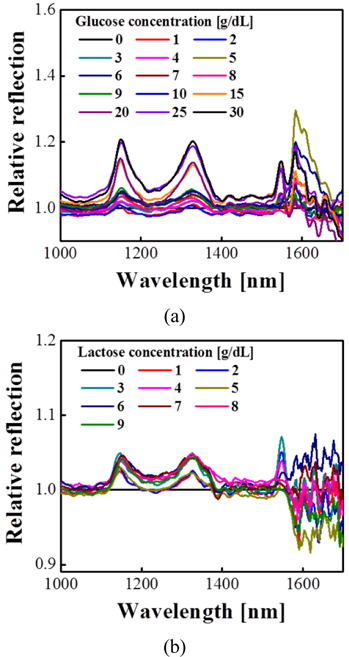
    To assess our approach for predicting high glucose concentrations in a glucose-lactose mixture, we selected two prominent probe wavelengths that led to high correlations between concentration and reflective optical power. A set of pure glucose and lactose standard solutions of various concentrations was prepared in a volumetric flask by dissolving D-(+)-glucose and α-lactose powder (Sigma-Aldrich) in deionized (DI) water at room temperature. The standard solution was then poured in a quartz cuvette of path length 10 mm. The glucose concentration was varied from 1 to 45 g/dL, while the lactose concentration was limited to a range of 1 to 9 g/dL, due to its lower solubility. To investigate the reflection spectra for the reference glucose and lactose solutions, we built a test setup as shown in Fig. 1, incorporating a spectrometer (NIRQuest512-2.5, Ocean Optics) and a halogen lamp (HL-2000-FHSA, Ocean Optics), with no bandpass filter inserted. Light from the lamp, which is delivered via the six surrounding fibers belonging to its reflection probe, was shone onto the prepared solution. Light transmitted through the solution was reflected back from a mirror to the central fiber of the reflection probe, for analysis by the spectrometer. During measurement the solutions and detector were entirely isolated from ambient light. The calculated reflection spectra for the two types of solutions are presented in Fig. 2, in the near-infrared regime from λ = 1000 to 1700 nm. The resulting CORR (λ) for the glucose and lactose solutions was estimated using Eq. (2). As plotted in Fig. 3, the glucose CORR(λ) was revealed to be as high as 0.95 over a broad span of wavelengths from λ = 1135 to 1370 nm. In the case of lactose, the two highest values of CORR(λ) were obtained at λ = 1160 and 1300 nm. It is noted that lactose yielded a lower CORR(λ) than glucose. In an aqueous solution, lactose exists in two isomeric forms, α- and β-lactose, with different properties, including specific rotation and solubility. By the process of mutarotation, lactose switches between the two forms to reach an equilibrium state [20]. It is also known that the dissolution of lactose declines with increasing concentration [21], thus degrading the uniformity of the solution. As a result, the correlation between reflective optical power and lactose concentration weakens with increasing concentration, compared to the case of glucose. As a consequence, the probe wavelengths used for concentration prediction were chosen to be λ1 = 1160 nm and λ2 = 1300 nm, offering substantially high CORR(λ) for both glucose and lactose.

    The linear coefficients a1, b1, a2, and b2 of Eq. (1) were determined by analyzing the reflective optical power for the glucose and lactose solutions at the chosen probe wavelengths. As shown in Fig. 1, a photodetector (818-IR, S/N 7736) in combination with an optical power meter (Model-1830-C, Newport) was used to record the reflective power. Two bandpass filters, centered at λ = 1160 and 1300 nm respectively, were placed between the solution and fiber. As shown in Fig. 4, the measured optical powers PG1, PL1, PG2, and PL2 for the glucose and lactose solutions observed at λ1 = 1160 nm and λ2 = 1300 nm increase in apparently linear fashion with analyte concentration. The linear coefficients were accordingly found to be a1 = 5.3625 × 10⁻³, b1 = 8.3533 × 10⁻³, a2 = 10.0786 × 10⁻³, and b2 = 14.8262 × 10⁻³, which may be efficiently utilized to estimate the glucose concentration in a glucose-lactose mixture. Regarding Eq. (1), the final predictive equation is given by CG = (1.7835P2 − 3.1656P1) × 103, which was employed to predict the glucose concentration in the glucose-lactose mixture by monitoring the optical power. Three pairs of mixtures were prepared, in which glucose and lactose had respective concentrations of 2 and 6 g/dL, 4 and 3 g/dL, and 7 and 3 g/dL. Based on the reflective powers for the mixtures at the predetermined probe wavelengths, we attempted to predict the glucose concentration using the aforementioned predictive equations. For various glucose-lactose mixtures, the comparison between actual and predicted glucose concentrations is shown in Fig. 5. It was finally confirmed that the predicted glucose concentration closely mimics the ideal case, providing an acceptable standard error of prediction SEP = 1.17 g/dL.

    IV. CONCLUSION

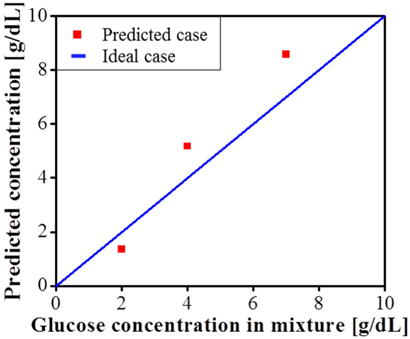
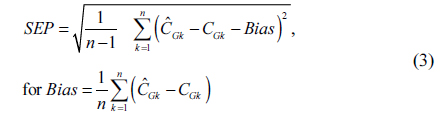
    An enzyme-free optical scheme for detecting high concentrations of glucose in glucose-lactose mixtures was realized by utilizing the reflective optical power available from the mixture, observed at dual probe wavelengths of 1160 and 1300 nm. The predictive equation was established based on the linear relationship between reflective optical power and glucose/lactose concentration at the specified wavelengths. For a glucose-lactose mixture, glucose concentrations from 2 to 7 g/dL were successfully estimated, achieving a standard error of prediction of 1.17 g/dL. It is noted that to practically apply the proposed method, for initial calibration a reference solution of pure DI water should be measured.

참고문헌
  • 1. Sato T., Katayama K., Arai T., Sako T., Tazaki H. (2008) “Simultaneous determination of serum mannose and glucose concentrations in dog serum using high performance liquid chromatography,” [Res. Vet. Sci.] Vol.84 P.26-29 google cross ref
  • 2. Parpinello G. P., Versari A. (2000) “A simple high-performance liquid chromatography method for the analysis of glucose, glycerol, and methanol in a bioprocess,” [J. Chromatogr. Sci.] Vol.38 P.259-261 google cross ref
  • 3. Yuan J. P., Chen F. (1999) “Simultaneous separation and determination of sugars, ascorbic acid and furanic compounds by HPLC-dual detection,” [Food Chem.] Vol.64 P.423-427 google cross ref
  • 4. Setti L., Fraleoni-Morgera A., Ballarin B., Filippini A., Frascaro D., Piana C. (2005) “An amperometric glucose biosensor prototype fabricated by thermal inkjet printing,” [Biosens. Bioelectron.] Vol.20 P.2019-2026 google cross ref
  • 5. Gouda M. D., Kumar M. A., Thakur M. S., Karanth N. G. (2002) “Enhancement of operational stability of an enzyme biosensor for glucose and sucrose using protein based stabilizing agents,” [Biosens. Bioelectron.] Vol.17 P.503-507 google cross ref
  • 6. Vasilarou A. M. G., Georgiou C. A. (2000) “Enzymatic spectrophotometric reaction rate determination of glucose in fruit drinks and carbonated beverages. An analytical chemistry laboratory experiment for food science-oriented students,” [J. Chem. Educ.] Vol.77 P.1327-1329 google cross ref
  • 7. Matthews R. H., Pehrsson P. R., Farhat-Sabet M. 1987 Sugar Content of Selected Foods: Individual and Total Sugars google
  • 8. Dremel B. A. A., Schaffar B. P. H., Schmid R. D. (1989) “Determination of glucose in wine and fruit juice based on fibre-optic glucose biosensor and flow-injection analysis,” [Anal. Chim. Acta.] Vol.225 P.293-301 google
  • 9. Martin W. B., Mirov S., Venugopalan R. (2002) “Using two discrete frequencies within the middle infrared to quantitatively determine glucose in serum,” [J. Biomed. Opt.] Vol.7 P.613-617 google cross ref
  • 10. Brandstetter M., Genner A., Anic K., Lendl B. (2010) “Tunable external cavity quantum cascade laser for the simultaneous determinati on of glucose and lactate in aqueous phase,” [Analyst] Vol.135 P.3260-3265 google cross ref
  • 11. Meinke M., Muller G., Albrecht H., Antoniou C., Richter H., Lademann J. (2008) “Two-wavelength carbon dioxide laser application for in-vitro blood glucose measurements,” [J. Biomed. Opt.] Vol.13 P.014021 google cross ref
  • 12. Yu S., Li D., Chong H., Sun C., Yu H., Xu K. (2014) “In vitro glucose measurement using tunable mid-infrared laser spectroscopy combined with fiber-optic sensor,” [Biomed. Opt. Express] Vol.5 P.275-286 google cross ref
  • 13. Fisher H., Hansen R. G., Norton H. W. (1955) “Quantitative determination of glucose and galactose,” [Anal. Chem.] Vol.27 P.857-859 google cross ref
  • 14. Mendelson Y., Clermont A. C., Peura R. A., Lin B. C. (1990) “Blood glucose measurement by multiple attenuated total reflection and infrared absorption spectroscopy,” [IEEE Trans. Biomed. Eng.] Vol.37 P.458-465 google cross ref
  • 15. Nielsen S. 2010 Food Analysis google
  • 16. Katsu T., Zhang X., Rechnitz G. A. (1994) “Simultaneous determination of lactose and glucose in milk using two working enzyme electrodes,” [Talanta] Vol.41 P.843-848 google cross ref
  • 17. Rodriguez-Rodriguez J. H., Martinez-Pinon F., Alvarez-Chavez J. A., Jaramillo-Vigueras D., Robles-Pimentel E. G. (2011) “Direct optical techniques for the measurement of water content in oil-paper insulation in power transformers,” [Meas. Sci. Technol.] Vol.22 P.065706 google cross ref
  • 18. Vogel R. M. (1986) “The probability plot correlation coefficient test for the normal, lognormal, and gumbel distributional hypotheses,” [Water Resour. Res.] Vol.22 P.587-590 google cross ref
  • 19. Esbensen K. H., Guyot D., Westad F., Houmoller L. P. 2002 Multivariate Data Analysis - In Practice: An Introduction to Multivariate Data Analysis and Experimental Design google
  • 20. Fox P. F., Uniacke-Lowe T., McSweeney P. L. H., O’Mahony J.A. 2015 Dairy Chemistry and Biochemistry google
  • 21. McSweeney P. L. H., Fox P. F. 2015 Advanced Dairy Chemistry: Volume 3: Lactose, Water, Salts and Minor Constituents google
OAK XML 통계
이미지 / 테이블
  • [ ] 
  • [ ] 
  • [ ] 
  • [ FIG. 1. ]  Test setup for acquiring reflection spectra and monitoring the reflective optical power from the prepared solutions, with a bandpass filter centered at the selected wavelengths.
    Test setup for acquiring reflection spectra and monitoring the reflective optical power from the prepared solutions, with a bandpass filter centered at the selected wavelengths.
  • [ FIG. 2. ]  Measured relative reflection spectra of pure (a) glucose and (b) lactose solutions of various concentrations.
    Measured relative reflection spectra of pure (a) glucose and (b) lactose solutions of various concentrations.
  • [ FIG. 3. ]  Calculated correlation coefficients for reflection spectra and concentrations of pure glucose/lactose solutions, in the spectral range from 1000 to 1700 nm.
    Calculated correlation coefficients for reflection spectra and concentrations of pure glucose/lactose solutions, in the spectral range from 1000 to 1700 nm.
  • [ FIG. 4. ]  Fitted linear relationships between concentrations of pure glucose/lactose and the relative reflective power at (a) λ1 = 1160 and (b) λ2 = 1300 nm, where a1, b1, a2, and b2 represent the corresponding linear coefficients.
    Fitted linear relationships between concentrations of pure glucose/lactose and the relative reflective power at (a) λ1 = 1160 and (b) λ2 = 1300 nm, where a1, b1, a2, and b2 represent the corresponding linear coefficients.
  • [ FIG. 5. ]  Comparison of predicted and actual concentrations of glucose in glucose-lactose mixtures.
    Comparison of predicted and actual concentrations of glucose in glucose-lactose mixtures.
(우)06579 서울시 서초구 반포대로 201(반포동)
Tel. 02-537-6389 | Fax. 02-590-0571 | 문의 : oak2014@korea.kr
Copyright(c) National Library of Korea. All rights reserved.