The black widow and redback types are both compact pulsar binaries. In the black widow system, the companion star is a white dwarf with a mass of ~0.02-0.05 M⨀. In the redback system, it is a main sequence star with a mass of ~0.1-0.4 M⨀. The redback system has a very short orbital period which is typically 0.1-1.0 day. As the companion star is orbiting around the pulsar, the radiation from the pulsar will shine on the surface of the star and heat up the facing side. Eventually, the star will evaporate. These binary systems are observable in optical, X-ray and gamma-ray bands. In the optical cases, due to the heating effect caused by pulsar radiation on the facing side of the companion star, the star appears brighter at the superior conjunction, where the pulsar is between the star and Earth, and dimmer at the inferior conjunction. X-rays are produced from the pulsar wind particles accelerated at the shock, which occurs at the intersection between the stellar wind and the pulsar wind. Gamma rays stem from the magnetosphere emission and possibly from the inverse Compton (IC) scattering between the pulsar wind and the stellar soft photon field. The gamma rays from the IC component are modulated along the orbit, and their flux depends on the collision angle such that the emission is strongest in head-on collisions at the inferior conjunction and weakest at tail-on collisions at the superior conjunction.
The Fermi Gamma-ray Space Telescope, launched in 2008, provides high-quality all-sky survey observations of gamma-ray astronomy. From the data in conjunction with the Fermi large-area telescope (LAT), scientific collaborations have identified 3,033 gamma-ray sources and published the third point source catalog (3FGL) (Acero et al. 2015). Among the catalog sources, 3FGL J2039.6-5618 is the target of this study. It remained an unassociated Fermi gamma-ray source until 2015, when Salvetti et al. (2015) and Romani (2015) suggested it to be a candidate for the redback pulsar binary system based on the fact that the source shows periodicity in X-ray and optical observations. Salvetti et al. (2015) used X-ray observations from XMM-Newton and found that there is a bright X-ray counterpart in the gamma-ray error circle at the location of 3FGL J2039.6-5618. This X-ray source varies with a period of 0.2245±0.0081 day. They also reported results from GROND observations which show that the optical counterpart of the source has periodicity at P = 0.22748±0.00043 day. This is consistent with the result in the X-ray band. Romani (2015) further refined the period to be 0.228116±0.000002 day based on GHTS and DES observations in the optical band, with the barycentric epoch of the optical maximum at MJD 56,885.065. This short orbital period of 5.47 hours implies a compact binary system, and more likely, a black widow or redback type. Furthermore, from the orbit modeling, Salvetti et al. (2015) reported the best-fit epoch of quadrature of the binary to be MJD 56,884.9667±0.0003, suggesting that the companion star is under large deformation. On the other hand, the modeling by Romani (2015) indicates that the companion star has a mass of ≤0.61M⨀ and an effective temperature of ~4,200K. In the gamma-ray observation by Fermi-LAT, although the spectrum of 3FGL J2039.6-5618 is consistent with the spectrum of a typical millisecond pulsar, no radio nor gamma-ray pulsations have ever been detected. In this study, the gamma-ray data of 3FGL J2039.6-5618 is analyzed for the purpose of exploring the nature of the subject at a high energy level and to determine whether it is consistent with a redback system.
In this study, we used the gamma-ray data obtained from the data Fermi-LAT server. Due to the uncertainty in the period, it is difficult to find the modulation directly in the sparse gamma-ray data. Instead, we divide the dataset into parts according to the orbital phases and compare the intensities at different phase intervals. It is believed that the gamma-ray emission will be stronger when the companion star is at the inferior conjunction as compared to when the star is at the superior conjunction, due to the 180° difference in the collision angle in the inverse Compton scattering. In this section, we initially compare the gamma-ray intensities in two different orbital phase intervals, after which we analyze the spectrum in each phase to determine if there are any changes caused by the orbital motion of the companion star.
The gamma-ray intensities of 3FGL J2039.6-5618 in two different orbital phases were analyzed. Test-statistics (TS) was used to quantify the source significance. Owing to the uncertainty in the period, we cannot use data from too long a time span; otherwise, the two orbital phases cannot feasibly be separated from one another. In this case, the events in the Pass 8 source class data between 2014 Feb 16 and 2015 Feb 11 were selected, with a span of 360 days. The corresponding instrumental response function is P8R2_SOURCE_V6. Using the period P=0.228116 and the reference time T0=56,884.9667 (MJD), the orbital phase ϕ can be assigned to each event. The data is then divided into two parts with equal phase lengths (0-0.5 and 0.5-1) such that one part is believed to contain the inferior conjunction. The photons were selected from a region of interest (ROI) which in this case is a 20°×20° square region centered at the epoch J2000 position of 3FGL J2039.6-5618 (20h 39m 0.32s, -56° 18´ 43.6˝). Because the orbital-phase-dependent component (the result of IC scattering between the pulsar wind and the stellar soft photon field) could appear only in a specific energy range, we repeated the analysis using subdatasets of photons in three different energy ranges: 0.1-100 GeV (‘Full energy’), 0.1-2.7 GeV (‘Low energy’) and 2.7-100 GeV (‘High energy’). To minimize the contamination from the Earth’s albedo, we excluded the time intervals when the zenith angle is greater than 90° and when the rocking angle of LAT is less than 52°.
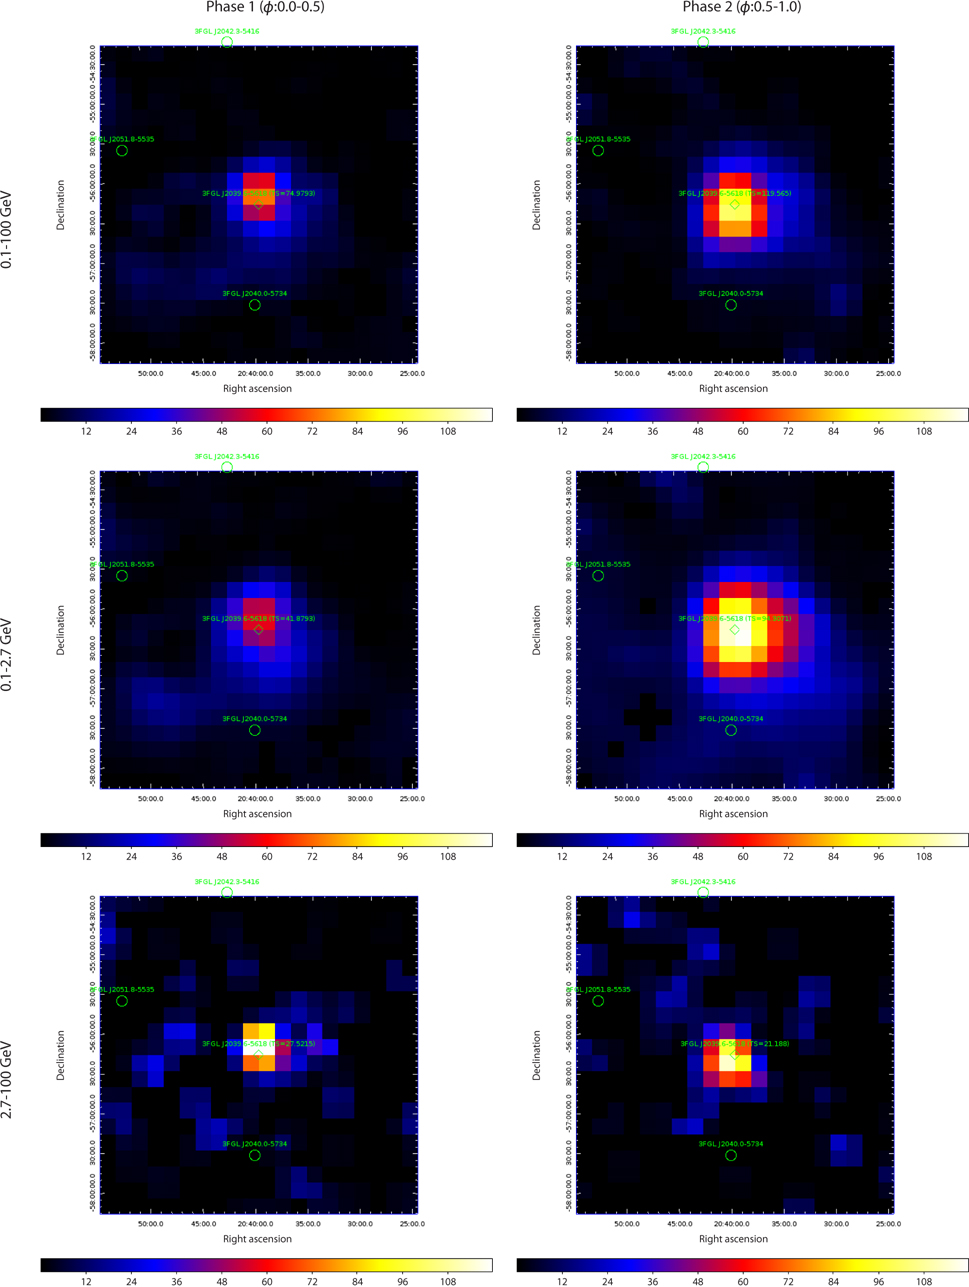
A binned likelihood analysis was done using Fermi Science Tools version v10r0p5 to obtain the results. The analysis uses an input model which contains all three FGL catalog sources (gll_psc_v16.fit) (Acero et al. 2015) within 25° from the center of the ROI, the Galactic diffuse emission (gll_iem_v06), and the isotropic diffuse emission (iso_P8R2_SOURCE_V6_v06). For sources that are outside the 10° distance from the center, their spectral parameters are fixed at the 3FGL catalog values. After applying the likelihood optimization to the source model using the gtlike tool in the Science Tools, we generated TS maps for 3FGL J2039.6-5618 for the two orbital phases in the three aforementioned energy ranges.
Fig. 1 shows the resultant TS maps. At full energy and low energy levels, the TS value of 3FGL J2039.6-5618 in Phase 2 is stronger than that in Phase 1. However, at a high energy level, the TS values are similar. Thus, it is concluded that the enhancement in the gamma-ray emission is most obvious at the low energy limit. It was also found that similar enhancements exist in other years when we repeated the analysis using data from years other than 2014-15.
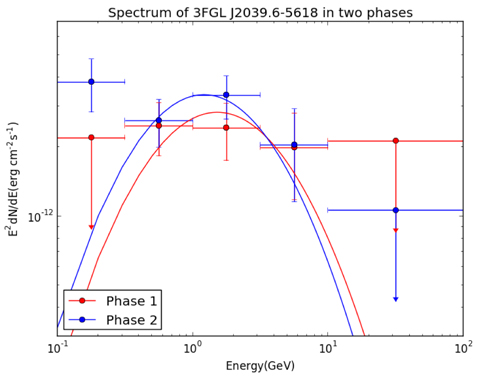
Next, we computed the spectrum of 3FGL J2039.6-5618 in different orbital phases to study how the enhancement is developed. If we use the same dataset of one year as used in the previous section, although the spectrum can be generated, the uncertainties in the spectral energy distribution (SED) are quite large. Fig. 2 shows the spectrum that is computed from the data of one year. The spectrum indicates that the enhancement that occurs in Phase 2 has energy below GeV level. To confirm this, the uncertainties must be minimized. Thus, we selectively combined the data from seven years of data using the following method.
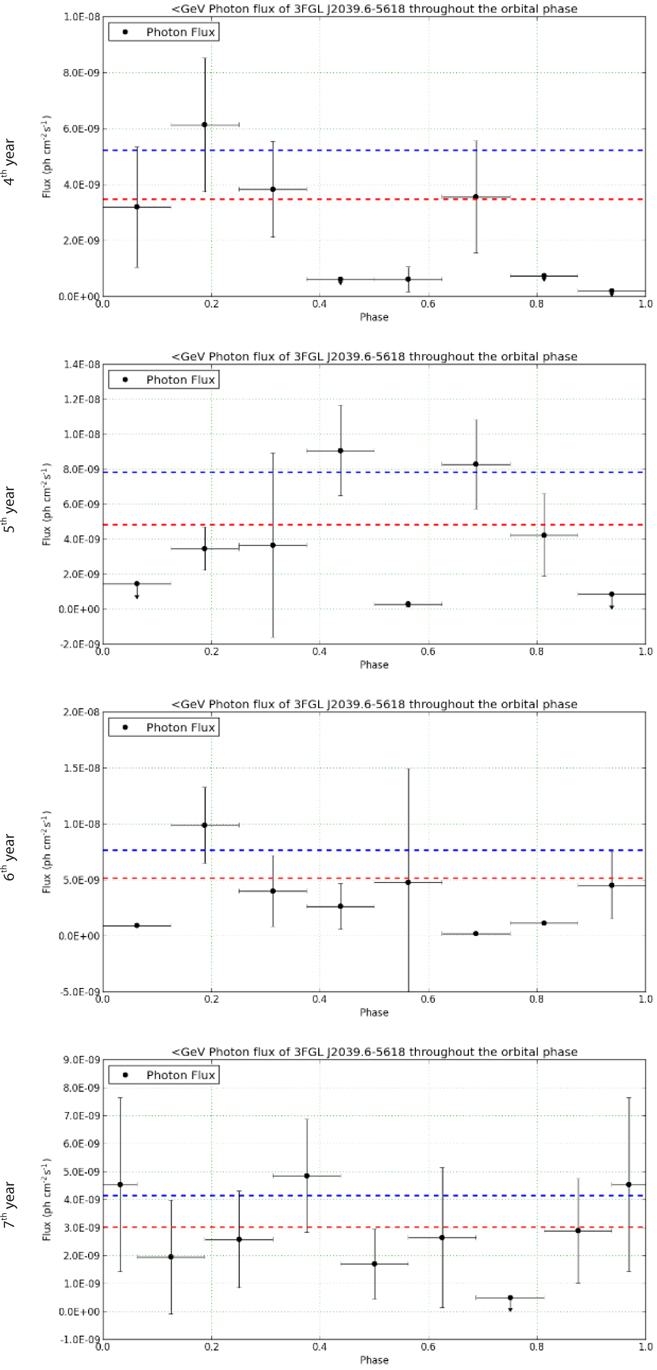
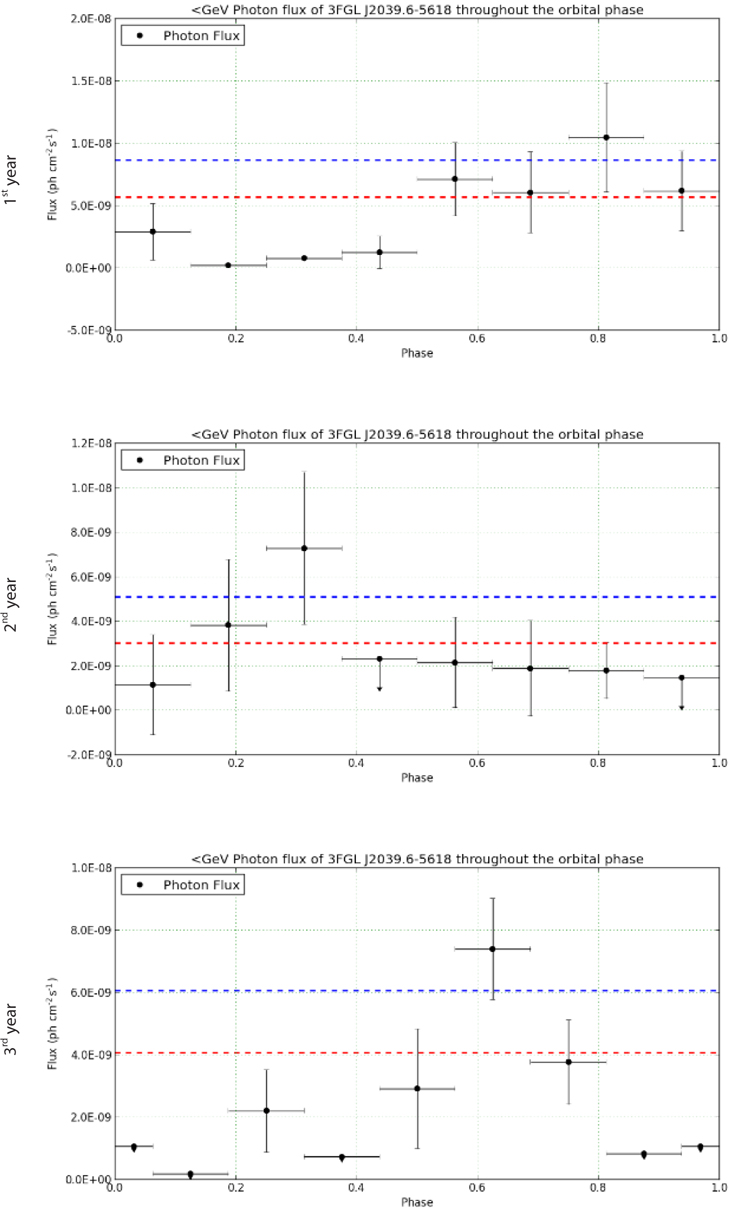
First, we treated the data from each year separately and located the segments of data that most likely described the emission in the period when the companion star is around the inferior conjunction (INFC). The timing model used is that used in the section on TS maps. Due to the uncertainty in the orbital period, it is natural that this INFC segment occurs at different phase intervals in different years. From the result in Fig. 2, the enhancement related to the orbital motion would carry energy below the GeV level. Therefore, we formulated light curves (flux versus orbital phase) for each year using only the data that are below the GeV level. Fig. 3 shows the resulting light curves for the seven years of data. This figure shows that the flux has some variations throughout an orbital phase. From the light curves, we set the INFC intervals as the time when the enhanced flux is greater than one sigma (the blue dashed line) from the mean flux (the red dashed line). The emissions from the remaining orbital phase intervals are believed to be radiated from the millisecond pulsar itself, and these are magnetospheric. Thus, we termed these intervals ‘magnetospheric’ (MGNT). It is also important that the location of INFC cannot be feasibly identified from the light curves in the fifth and seventh years. Therefore, to avoid ambiguity, the data from these two years were not used in the ensuing spectral analysis. As a result, two datasets were obtained; the ‘combine INFC’ dataset includes the INFC segments from the first to the fourth years and the sixth year, and the ‘combine MGNT’ dataset includes the MGNT segments from the first to the fourth years and the sixth year.
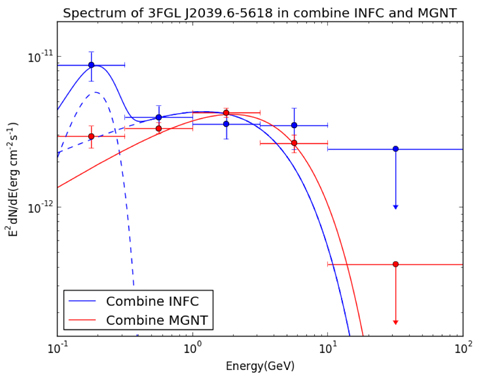
Next, we undertook a spectral analysis of the two datasets. It is expected that the ‘combine MGNT’ dataset would produce a pulsar-like spectrum. Therefore, the spectral form of the power-law-with-exponential-cutoff approach was used in the model to describe 3FGL J2039.6-5618 in this ‘combine MGNT’ dataset. On the other hand, the ‘combine INFC’ should contain the enhancement resulting from IC scattering between the pulsar wind and the stellar soft photon field, as well as the pulsar emission. Therefore, the spectrum is fitted with a power-law-with-exponential-cutoff (the magnetospheric component) approach plus a Gaussian (the IC component). Fig. 4 shows the resultant spectrum in the ‘combine INFC’ (blue) and in the ‘combine MGNT’ (red) datasets. It can be observed that the IC component appears at a low energy level and peaks at around 200 MeV. This component is the crucial difference between the emissions in the two datasets.
We attempt to explain the nature of this extra IC component which appears in the INFC of the orbit. In a redback system, the companion main sequence star orbits around a millisecond pulsar. The pulsar emits pulsar wind which is composed of charged particles. As the pulsar wind propagates, the energy of the electromagnetic wave is converted into the energy of the particles, and the particles are accelerated. This ratio between the magnetic energy density and the particle kinetic energy density defines the magnetization parameter (Kong et al. 2011; Takata et al. 2014), where ΓW is the Lorentz factor of the unshocked pulsar wind and n(r) is the proper electron density. Kong et al. (2011, 2012) and Takata et al. (2014) also modeled the variation of σ with the distance from the pulsar rs in a power-low form , where rL is the radius of the light cylinder and α is the power-law index. Kong et al. (2011) and Takata et al. (2014) both used α=2 in their model of the gamma-ray binaries PSR B1259-63 and is LS 5039, respectively. Because the magnetic field B ∝ [σ/(1+σ)]1/2 r−1 and the electron number density n ∝ r−2, if σ>1. Hence, the Lorentz factor ΓW increases as the distance from the pulsar r increases. When these charged particles collide with the soft photon field of the companion star, IC scattering occurs to increase the energy of the photons to produce gamma rays. According to Wu et al. (2012), the typical energy of the IC scattered photons from the pulsar-stellar wind interaction is , where Teff is the effective temperature. If we assume ΓW=1.5×10⁴ and use the value of the effective temperature Teff=4,200K given by Romani (2015), the typical energy would be . This value is reasonable when we compare it with the results in Wu et al. (2012), which presented a similar analysis of the gamma-ray black widow PSR B1957+20. The black widow system has an effective temperature of 8,300K, an orbital period of 9.2 hours and a Lorentz factor of 5×10⁴. The typical energy of the IC photons is thus ~5 GeV, which is consistent with the spectrum showing that the Gaussian component peaks around 5 GeV in INFC). Our target, 3FGL J2039.6-5618, as compared to PSR B1957+20, has a lower effective temperature and a shorter orbital period. This shorter orbital period implies that the distance between the companion star and the pulsar is closer such that the maximum Lorentz factor of the pulsar wind will be lower. In the first-order approximation, assuming that the total mass of the binary system is pulsar-dominant and comparable to that of PSR B1957+20, Kepler’s law implies that the orbital radius of 3FGL J2039.6-5618 is (5.4/9.2)2/3~0.7 times that of PSR B1957+20. The radius of the light cylinder in both binaries is assumed to be similar because the period of the millisecond pulsar in 3FGL J2039.6-5618 is unknown. Thus, the Lorentz factor ΓW in 3FGL J2039.6-5618 is estimated to be (0.7)2×5×104~2.5×10⁴. If we take into account the uncertainties of other effects (e.g., the pulsar spin period, total mass of the binary, and surface magnetic field) this estimation could be consistent with the data analysis results in this case.