Gamma-ray bursts (GRBs) are the most luminous gamma-ray transients ever observed by humankind. There are two different observed phases of electromagnetic emissions, namely the prompt and afterglow phases. The fireball model (Goodman 1986; Rees & Meszaros 1992; Meszaros et al. 1993; Meszaros & Rees 1993; Rees & Meszaros 1994; Tavani 1996; Piran 1999) states that the ejected materials with various Lorentz factors (~ 100 – 1,000) from the central engine form a bipolar jet structure. When the shells of matter of the jet collide, shock waves will be formed and prompt gamma-rays are emitted from the shock-accelerated materials. When the matter shells continue to travel outward, they will eventually interact with the circumburst medium, where similar processes take place and afterglow (from gamma-ray to radio) is emitted.
The emission mechanisms of the prompt and afterglow phases provide information for the physical processes at work. For decades, astrophysicists believe that the prompt emission is generated by synchrotron radiation from electron populations as the afterglow emission. However, observations of the prompt phase are not as conclusive as the afterglow phase since the prompt phase is only observed in gamma-rays for most GRBs, whereas the synchrotron origin of afterglow is validated by multi-wavelength observations of many bursts.
Gamma-ray spectroscopy is the key to investigate the emission mechanism of the prompt phase. Thanks to the gamma-ray burst monitor (GBM, Meegan et al. 2009) onboard the
The study of the sharpness of the synchrotron emission spectrum in comparison to time-resolved spectra of GRBs is a question recently raised by Beloborodov (2013) and Vurm & Beloborodov (2015). In this proceeding we discuss the results presented in Yu et al. (2015b), in which a total of 1,491 time bins with constrained spectral parameters are obtained (see the official time-resolved spectral catalog, Yu et al. 2016). For 1,113 of them, a spectral peak or break is present within the GBM spectral window. Using a novel quantity called the sharpness angle, we are able to quantify the spectral curvature of these 1,113 spectra and comparing to theoretical emission models.
In Section 2, we describe how this novel quantity is constructed. The key results are presented in Section 3. Some of the theoretical implications are discussed in Section 4. The conclusions are given in Section 5. Unless otherwise stated, all errors reported in this paper are given at the 1
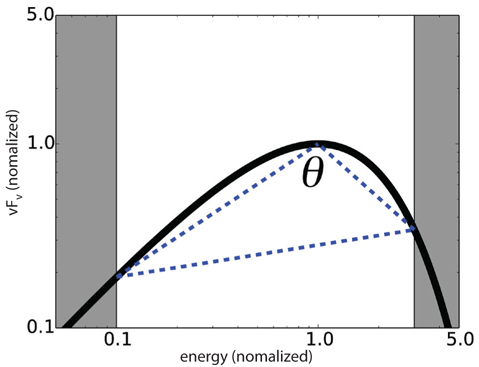
The spectra are re-fit as described in Yu et al. (2015b). We normalize the re-fit model curves in logarithmic space for those 1,113 spectra by setting the peak energy
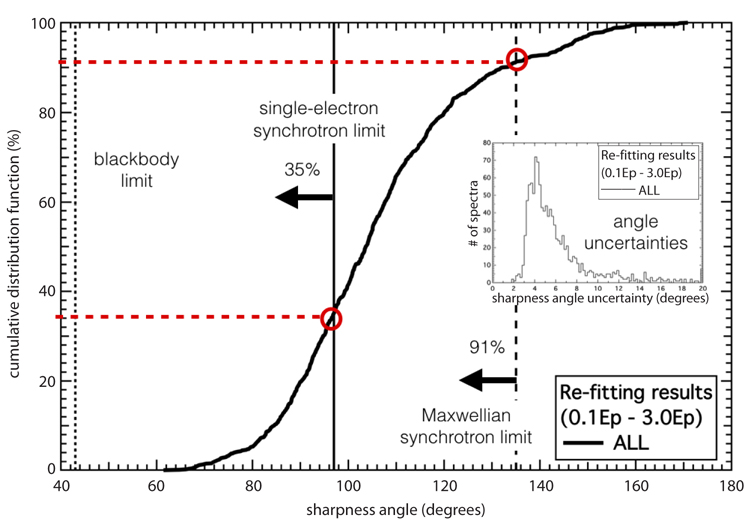
Fig. 2 shows the cumulative distribution function (CDF) of the sharpness angles
Instead of directly propagate the errors on the observed photon counts to the sharpness angles, Monte-Carlo simulations are performed using the 1
It is found that 35% of the 1,113 spectra violate the synchrotron line-of-death (Katz 1994; Tavani 1995; Preece et al. 1998; Crider et al. 1999; Preece et al. 2002), higher than the 20% observed by Gruber et al. (2014) in their peak-flux “
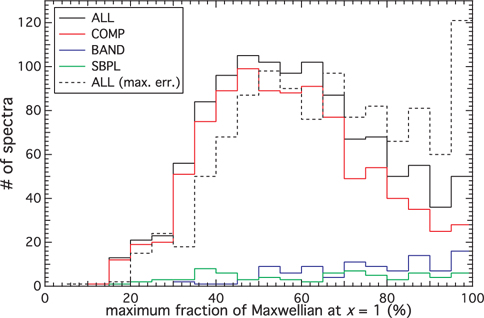
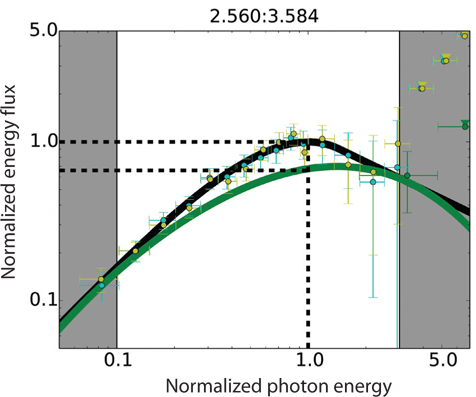
In Fig. 3, we show the distribution of the maximum peak flux allowed by the best-fit model curves to be contributed by the Maxwellian synchrotron function. For the spectra that do not have a peak, we compute this value at the spectral break. A sample spectrum from GRB 101014.175 is plotted in Fig. 4. The normalized Maxwellian synchrotron function was shifted vertically and horizontally until the distance between its value at
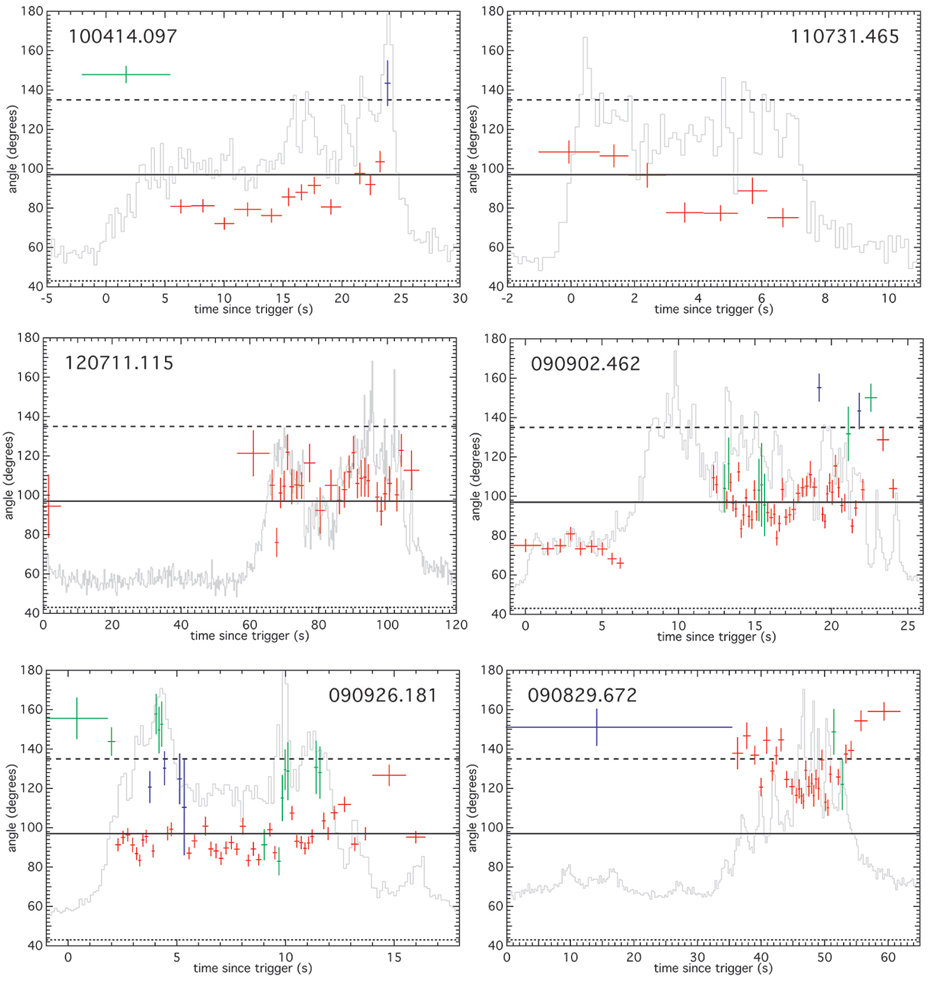
We select and plot in Fig. 5 the evolution of
Our results show that for most GRB prompt emission spectra, an explanation in terms of synchrotron radiation can be problematic. In the internal shocks of GRBs, a single-electron emission function is obviously non-realistic (as there must be multiple electrons in the outflow) and a Maxwellian population drawn from a single temperature is the limiting case. Even this limiting case is already too wide to fit most GRB time-resolved spectra.
For the past two decades, the so-called Band function (Band et al. 1993) has been assumed to be the appropriate mathematical function in fitting most GRB prompt spectra. The fact that most spectra are best fit by the exponential cutoff power-law model (see Yu et al. 2016) shows that the high-energy tail of the prompt spectrum is actually sharper than a Band function would predict. Recently, Ackermann et al. (2012) showed that the Band function’s high-energy power laws obtained from GBM spectral fits are too hard for a subsample of GBM bursts with upper limits from the
Constructing another empirical function to improve upon the Band function fits is very difficult, because the Band function is already very simple mathematically and statistically. Yu et al. (2015a) have shown that a triple power law with sharp breaks constrained according to the synchrotron models could only perform as good as the Band function. In many cases, an extra blackbody is needed to adequately describe the spectral curvature. Recently, for instance, Burgess et al. (2011, 2014) performed physical model fits, and Uhm & Zhang (2014) have done simulations under more realistic physical condition, e.g., a decaying magnetic field. However, without knowledge of the true emission process, it is difficult to formulate a sufficiently well-constrained physical fit function. There may also be multiple emission mechanisms at work, the sum of which forms the observed prompt spectra. The sharpness angle distribution implies that any model based on standard synchrotron theory without additional radiative and/or absorption mechanisms will systematically struggle to capture the prompt spectral curvature.
Recently, Axelsson & Borgonovo (2015) have shown that using the full-width-half-maximum measurement of GRB prompt emission spectra taken from the BATSE 5B GRB spectral catalog (Goldstein et al. 2013) and 4-years
Besides non-thermal models, one may construct a thermal emission dominated model to explain the observed sharpness angles. However, fitting multiple blackbodies is statistically meaningless, as one may construct any function from a polynomial fit. Simple photospheric models face difficulties in explaining the observed data. For example, early theoretical studies of a pure thermal origin of GRB prompt emission, such as from freely expanding photospheric outflows with no baryonic matter or magnetic field (Goodman 1986; Paczynski 1986), struggled to explain the shape of the prompt phase and the two modes of observed
A frequently discussed alternative to the baryonic composition of the jets in GRBs is a magnetically, or Poynting flux, dominated jet (Thompson 1994; Drenkhahn & Spruit 2002; Lyutikov & Blandford 2003). In this scenario, the magnetic field dominates the energy density in the emitting region. Thus, the dominant emission mechanism will be synchrotron emission from relativistic electrons, since no cooling mechanism is known which is faster (see, e.g., Beniamini & Piran 2014). Our observational results therefore posed a challenge to Poynting flux dominated models, although Compton up-scattering from seed photons in the environment of an emerging Baryon-free jet offer a potential means of combining strongly magnetic outflows with a thermalized component or sharp spectrum (see, Gill & Thompson 2014, for a recent example). Moreover, Beloborodov (2013) argues that other optically thin emission models share the same problems of the synchrotron emission models, e.g., pitch-angle synchrotron radiation (Lloyd & Petrosian 2000) when the scatter angle in the comoving frame is not isotropic, and jitter radiation in turbulent magnetic fields (Medvedev 2000).
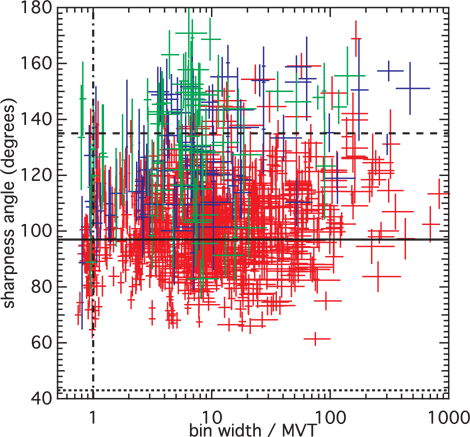
The minimum variability timescale (MVT, e.g., Bhat 2013; Golkhou & Butler 2014) of the light curves provides dynamical timescale of the emission process. In Fig. 6, we plot
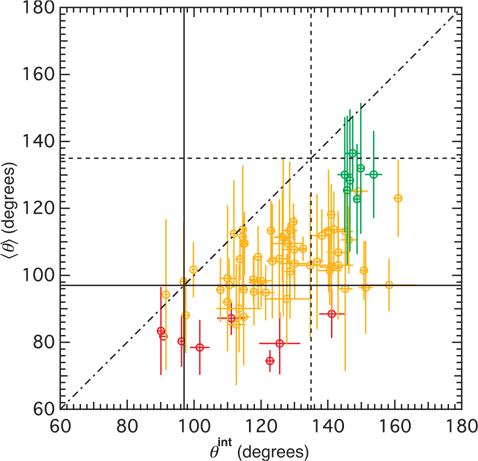
To investigate the effect of integrating multiple spectra, we compute the average time-resolved sharpness angle <
Fig. 7 shows that the time-integrated angles are systematically larger than the average time-resolved angles for individual bursts. We emphasize that different light curve binning methods are used in the time-resolved and time-integrated spectral catalog. In our time-resolved analysis, as mention in Yu et al. (2015b), the light curves are binned with
We reported the results given by Yu et al. (2015b) of the novel quantity, the sharpness angles
It is still possible for synchrotron emission to dominate the spectrum away from the peak or break observed in the GBM energy range (e.g., at the LAT energy range). Also, a sub-dominant synchrotron component can allow for a continuous connection to the afterglow phase, where synchrotron emission is typically dominant (see, e.g., van Eerten 2015, for a recent review). The transition between prompt and afterglow is then marked by the disappearance of the non-synchrotron (likely thermal) component. There are other theoretical possibilities to explain GRB prompt emission, such as the collisional model of electron-positron pairs (e.g., Beloborodov 2010). For recent reviews on GRB prompt emission mechanisms, see, e.g., Zhang (2014) and Pe’er (2015).
A possibly similar inference can be made on the related phenomena of prompt optical emission showing a similar temporal profile as the gamma-ray emission (Elliott et al. 2014; Greiner et al. 2014) or very early X-ray flares (e.g., Pe’er et al. 2006; see also Hu et al. 2014 for a recent large
Yu et al. (2015b) demonstrated a new method to quantify the shape of the observed GRB spectra, providing a tool for distinguishing between various standard emission functions. Ultimately, the question as to the viability of any particular emission model can only be fully resolved if complete spectral predictions for that model are tested directly against photon counts (see, e.g., Burgess et al. 2014).