As a special subclass of active galactic nuclei (AGNs), blazars are the major population in Fermi missions (Abdo et al. 2009, 2010a; Ackermann et al. 2011; Acero et al. 2015). They show some extreme observational properties: rapid and high amplitude variability, high and variable polarization, strong and variable γ-ray emissions, superluminal motions, etc. (see Fan et al. 2011; Yang et al. 2012; Fan et al. 2013, 2014; Yang et al. 2014). Blazars have two subclasses, namely BL Lacertae objects (BL Lacs) and flat spectrum radio quasars (FSRQs). They both show common continuum but different emission lines. FSRQs have very strong emission lines while BL Lacs have weak emission lines or no emission line at all. BL Lacs can be classified as radio selected (RBLs) and X-ray selected (XBLs) BL Lacs from surveys, and they have different synchrotron peak frequencies with most XBLs showing synchrotron peak frequencies logνp > 15 Hz (highly peaked BL Lacs-HBLs) and RBLs showing logνp < 15 Hz (lowly peaked BL Lacs-LBLs) (Padovani & Giommi 1996). According to the peak frequency, BL Lacs can be divided into LBL, IBL, and HBL: LBL if logνp < 14.5 Hz, IBL (intermediately peaked BL Lacs) if 14.5 Hz < logνp < 16.5 Hz, and HBL if logνp > 16.5 Hz (Nieppola et al. 2006); LBLs if logνp < 14 Hz, IBL if 14 Hz < logνp < 15 Hz, and HBL if logνp > 15 Hz (Abdo et al. 2010b); or LBL, logνp < 13.98 Hz, IBL 13.98 Hz < logνp < 15.30 Hz, and HBL if logνp > 15.30 Hz (Fan et al. 2015a). We can see that our previous classifications are similar to those of Abdo et al. (2010b).
The observations of strong γ-ray emissions in blazars suggest the existence of a relativistic beaming effect, which has been discussed in some papers (see Savolainen et al. 2010; Giroletti et al. 2012; Fan et al. 2013, 2014; Lin & Fan 2016). Very recently, following the work by Mattox et al. (1993), the Doppler factors were evaluated for a sample of Fermi blazars by assuming time scales of 6 hr and 24 hr (Fan et al. 2013, 2014; Liodakis & Pavlidou 2015). In our previous papers, we also found that the Fermi detected blazars have larger core-dominance parameters (Pei et al. 2016) and the de-beamed gamma-ray flux densities show a close correlation with redshift (Xiao et al. 2015).
The present work follows our previous paper of Fan et al. (2015a), which reported the classifications of blazars and investigated the correlation between radio loudness and synchrotron peak frequency or gamma-ray luminosity. In section 2, we present the results and in Section 3 the discussions and conclusions. In our analysis, we adopt the Hubble constant H0 = 73 km·s−1·Mpc−1, and the spectral index α is defined as fν ∝ να through this paper.
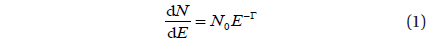
The γ-ray photon number per unit energy can be expressed as
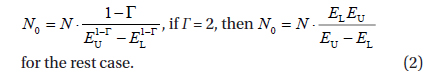
where, Γ is the γ-ray photon spectral index. N0 is a constant, and can be obtained by integrating Eq. (1):
N is the γ-ray integral photon flux in units of photons·cm−2·s−1 in the energy range of EL~EU, where EL and EU are the lower and upper energy limits, respectively, and EL = 1 GeV, and EU = 100 GeV in this paper.
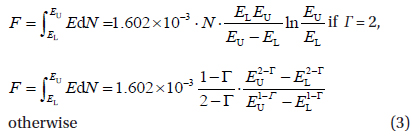
Hence, the total γ-ray flux density in the range of EL~EU is
The integral γ-ray luminosity is calculated by the formula , where dL is the luminosity distance (Fan et al. 2015b).
Radio loudness can be calculated as the ratio of the radio emissions to the optical emissions: , where LR and LO are radio and optical luminosities, respectively.
In our previous paper, we compiled multiwavelength data for a sample of 1,425 sources and successfully calculated spectral density distributions (SEDs) for 1,392 sources; among them 999 sources have shown redshift. Based on the calculated synchrotron peak frequency (νp), we classified the subclasses of blazars as LBL if logνp < 13.98 Hz, IBL if 13.98 Hz < logνp < 15.3 Hz, and HBL if logνp > 15.3 Hz (Fan et al. 2015a). From Table 1 of Fan et al. (2015a), we can obtain a sub-sample of 983 sources with available redshift, radio-, optical-, and γ-ray luminosities.
Averaged values: For the 983 FSRQs, there are 447 FSRQs, 536 BL Lacs (148 HBLs, 339 IBLs, and 49 LBLs). The radio loudness <RL> = 3.23 0.54 for FSRQs, <RL> = 2.69 ± 0.93 for LBLs, <RL> = 2.11 ± 0.80 for IBLs, and <RL> = 1.66 ± 0.0.56 for HBLs.
Correlations: From the relevant data of Fan et al. (2015a), we can obtain the following correlations. For RL and νp,
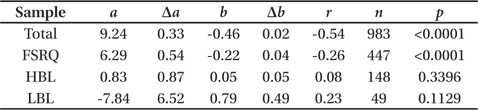
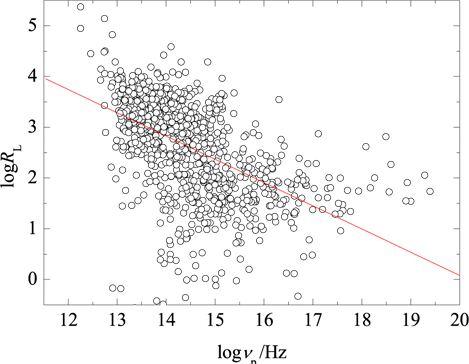
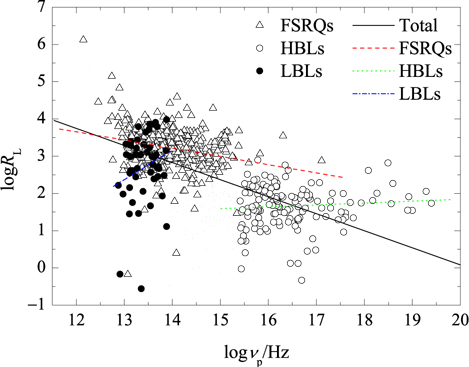
logRL = −(0.46 ± 0.02) logνp + 9.24 ± 0.33 with a correlation coefficient r = −0.54 and a chance probability p = 10−4 for the whole sample, as shown in Fig. 1. For the subclasses, FSRQs, LBLS, and HBLs, we have logRL = −(0.22 ± 0.04) logνp + 6.29 ± 0.54 with r = −0.54 and p < 10−4 for 447 FSRQs, logRL = (0.79 ± 0.49) logνp − (7.84 ± 6.52) with r = 0.23 and p = 11.3% for 49 LBLs and logRL = (0.05 ± 0.05)logνp + 0.83 ± 0.87 with r = 0.08 and p = 33.4% for 148 HBLs, as shown in Fig. 2.
For the radio loudness and the gamma-ray luminosity, we have
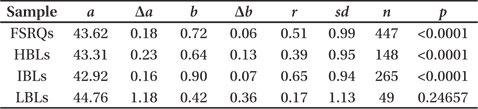
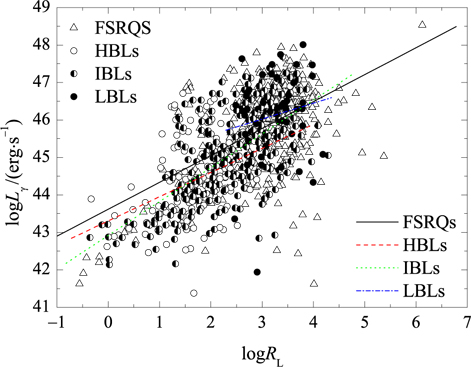
logLγ = (0.72 ± 0.06)logRL + (43.62 ± 0.18) with r = 0.51 and p < 10−4 for 447 FSRQs,
logLγ = (0.64 ± 0.12)logRL + (43.31 ± 0.23) with r = 0.39 and p < 10−4 for 148 HBLs, and
logLγ = (0.42 ± 0.36)logRL + (44.76 ± 1.18) with r = 0.17 and p < 24.7% for 49 LBLs, as shown in Fig. 3. The corresponding correlation results are listed in Tables 1 and 2.
Blazars consist of FSRQs and BL Lacs, and BLs are composed of radio selected BL Lacs and X-ray selected BL Lacs from surveys or high synchrotron peak BL Lacs (HBLs), intermediate synchrotron peak BL Lacs (IBLs), and low synchrotron peak BL Lacs (LBLs) from their peak frequency in their spectral energy distributions. Generally, FSRQs are low synchrotron peak sources; therefore, in the paper of Abdo et al. (2010b), the authors classified blazars as low synchrotron peak sources (LSPs), intermediate synchrotron peak sources (ISPs) and high synchrotron peak sources (HBLs). Blazars are the main population detected in the Fermi missions (See Acero et al. 2015 and references therein). To date, some blazars are TeV emitters and most are HSPs with smaller radio to optical spectral indexes and hard GeV spectral indexes (Lin & Fan 2016). Observations show that the gamma-ray emissions in Fermi blazars are strongly beamed. The gamma-ray beaming factor can be estimated by (Fan et al. 2013, 2014).
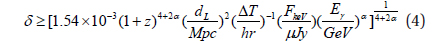
Here, z is the redshift, dL is the luminosity distance, ΔT is the variability time scale, FkeV is the X-ray flux density, and Eγ is the gamma-ray energy. The Doppler factor (boosting factor) can be estimated using available observations.
It is known that the radio emissions in blazars are strongly beamed and the beaming factors were estimated in our previous work (Fan et al. 2009), and the de-beamed gamma-ray flux density closely correlated with the redshift (Xiao et al. 2015) and the Fermi blazars show higher core-dominance parameters than those of non-Fermi detected blazars (Wu et al. 2014; Pei et al. 2016). For the correlation between radio loudness and peak frequency (Table 1 and Figs. 1 and 2), we find that the anti-correlation is strong for FSRQs but almost non-existent for both LBLs (r = 0.23) and HBLs (r = 0.08). If the radio emissions are strongly beamed, then the radio loudness is an indicator of beaming effect since . The results of the correlation are then consistent with the results that FSRQs show a higher Doppler factor than BL Lacs. The anti-correlation between the radio loudness and peak frequency is similar to the anti-correlation between the Doppler factor and the peak frequency (Nieppola et al. 2006). In this sense, we expect that the de-beamed radio loudness will be positively beamed with the peak frequency. Fortunately, the correlation for HBLs showing a positive tendency appears to support our expectation.
From Fig. 3 and Table 2, we can see that the gamma-ray luminosity increases with radio loudness, and the slope in FSRQs is steeper than that in HBLs and LBLs, which suggests that the Fermi blazars are radio loud and the gamma-ray emissions in FSRQs are more beamed. From our analyses, we can conclude that the gamma-ray sources are radio loud and beamed.