Precipitation patterns of Korea exhibits extreme seasonal variation, because about two-thirds of the annual precipitation occurs during a summer monsoon period of July and August. Moreover, due to such concentrated rainfall, most water resources cannot be used efficiently and end up flowing into the ocean, making inefficient and unstable management of water resources (Yum 2010). In order to stably secure water resources and solve those water-related problems as flood and drought, the “Four Rivers Restoration Project” began in 2008, and 16 artificial weirs, including eight in the Nakdong River, three each in the Han and Geum rivers, and two in the Yeongsan River, were constructed (Park 2010). Although those artificially constructed multi-purpose dams and weirs can be useful for stable management of water resources, they could also cause various ecological problems because they block the continuous flow of water (Baxter 1977, Vannote et al. 1980, Ward and Stanford 1983, Poff and Hart 2002).
Previous studies pointed out that artificial dams and weirs constructed in rivers changed the physical characteristics of the rivers (Gray 1992, Allan and Flecker 1993, Thomas 1996), and large amounts of floating debris from construction of the artificial structures influenced the growth of plants and animals (Hanson and Butler 1994). Such changes in the physical environment of rivers immediately influenced the growth of phytoplankton and periphyton, which were the primary producers in rivers (Cloern 1987), and eventually influence the entire aquatic ecosystem by changing fish population characteristics (Mantel et al. 2010, Mueller et al. 2011). In particular, fish movements could be cut off by artificial weirs constructed in rivers (Nicola et al. 1996, Joy and Death 2001, Bunt et al. 2012), resulting in a geographical isolation. Moreover, population sizes could undergo rapid declines or even extinction, as it might be impossible for fish to ascend or descend along the rivers (Bain et al. 1988, Martinez et al. 1994). Therefore, in order to solve the problems, construction of fishways that enable organisms to continue to move after construction of artificial weirs, was made obligatory under the second clause of Article 12 in the Aquatic Resources Protectorate. However, there is little information on the functions of fishways and the fish species that use them, and there is no continual ecological monitoring (MEK 2012). Hence, studies are required to understand the function of fishways and to quantitatively assess the efficiency of fishways.
Most studies on monitoring and assessment of fishway efficiency have been conducted in the United States and Canada. The United States and Canada have made suggestions concerning the design flux and standard current speed of fishways based on flood periods. Thus, fishways can also serve as drainage ways during times of flooding (Parker 2000, Noonan et al. 2012). Moreover, in order to increase the efficiency of fishways, different current velocities and water levels have been applied to different fishways, taking into account swimming characteristics of target species and length of fishways (Yagci 2010). In Korea, most studies are fundamental research on the movement of fish through fishways (Kim 2007, Han et al. 2012, Choi et al. 2013), and on current conditions of fishways and plans to improve their conditions (KEI 2004). Moreover, there are studies on the evaluation of the hydraulic and hydrologic characteristics of upstream and downstream reaches of artificial weirs (Park 2001, Song et al. 2010). However, research evaluating fishway efficiency that takes into account the structural, hydraulic/hydrologic, and biological characteristics of the fishways has not been performed.
The objectives of this study were to develop a “Multimetric Fishway Assessment Model” (Mm-FA model) that could perform an integrated assessment of the efficiency of fishways in Korea, and to apply the model to Juksan Weir in the Yeongsan River watershed to evaluate the efficiency of its fishway. In particular, we analyzed the properties of various metrics of structural, hydraulic/hydrologic, and biological characteristics of fishways, which served as the variables in our Mm-FA model.
>
Current condition of Juksan Weir
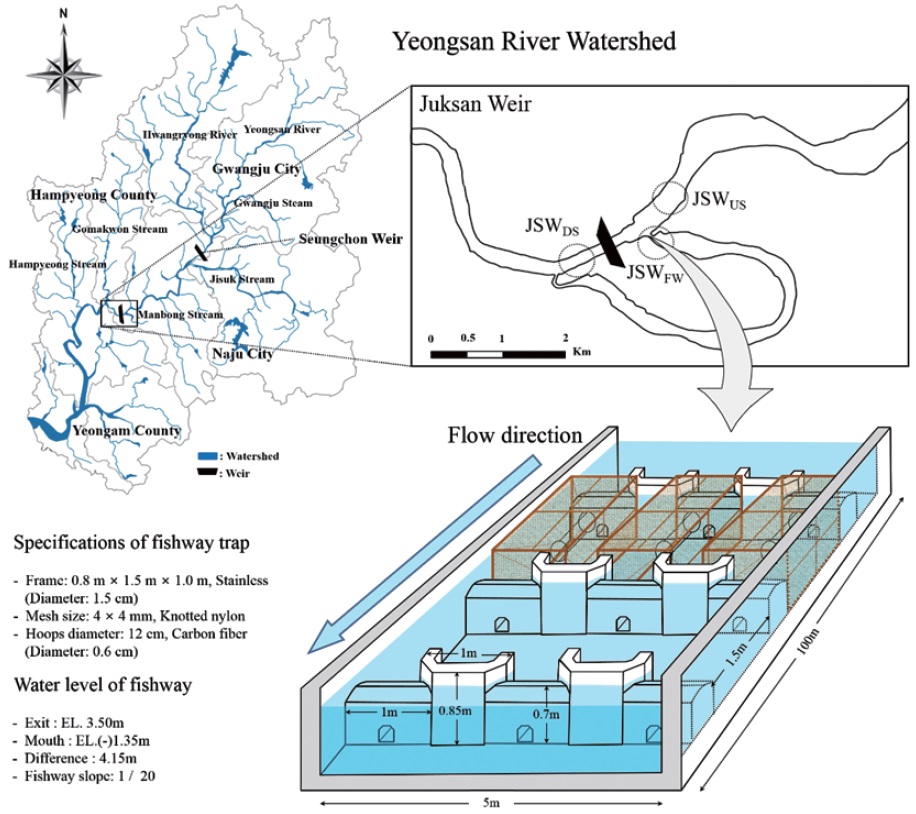
Juksan Weir is an artificial weir constructed in the downstream area of the Yeongsan River as a part of the Four Rivers Restoration Project. The Yeongsan River watershed where Juksan Weir is located has a basin area of 3,371km2 and a total waterway length of 136 km. It is one of the four major rivers of Korea, and it rises in the Yongmyeon, Damyang-gun, collects into Damyang Lake, flows through Wolgye Creek, Jiseok Creek, and Yeongsan Lake, and flows into the West Sea through the estuary bank of the Yeongsan River in Mokpo (Choi and An 2008). Yeongsan River watershed consists of the main stream section of 136 km and major streams, such as Hwangryong River, Jiseok Creek, Gomakwon Creek, Hampyeong Creek, Manbong Creek, and Gwangjoo Creek, and large amounts of nutrient salts and pollutants flow into the watershed from non-point pollutant sources in the river (MEK 2012). Juksan Weir was constructed approximately 50 km away from the estuary of Yeongsan River and is located in Juksan-ri, Dashi-myeon, City of Naju, Jeonnam Province (E 126° 62′ 92″, N 35° 06′ 48″). It is a movable weir with a water level management elevation (El.) of 3.5 m, height of 4.85 m, length of 622 m, and a shell type roller gate. The fishway at the Juksan Weir is different from that at Seungchon Weir. The fishway was not constructed directly on the movable weir, but as an Iceharbor-type precast fishway connected to the abandoned channel 500 m upstream on the right bank, allowing fish to move through the abandoned channel (Fig. 1).
>
Fish monitoring in the fishway of Juksan Weir
Monitoring techniques using traps were employed to collect fish that were ascending through fishway of Juksan Weir. The trap was made of a stainless steel pipe frame with a dimension of 0.8 m × 1.5 m × 1.0 m (width × length × height) and a nylon net (4 × 4 mm) were covered the frame. We made fish entrances on both sides of the traps to catch fish ascending or descending through the fishway, and used three traps with the same sizes for fish monitoring (Fig. 1). Fish monitoring began in June 2012 when the fishway began to operate, and was conducted at least twice a month to collect data totally seven times, until the beginning of monsoon season and concentrated rainfall on August 2012. The length and weight of fish sampled in each trap were recorded, and the sampled fish were identified and classified according to Kim and Park (2002). A hydrometer, Gurley Precision Instruments Model 1100 (Gurley Precision Instruments, New York), was used in the spillway and the retention basin of the fishway to measure current velocities in areas into which traps were installed.
>
Fish samplings in upstream and downstream reaches of the Juksan Weir
Fish were sampled from all habitats located in up-stream and downstream reaches of the Juksan Weir, using a total of 5 types of fishing equipment, including casting nets, kick nets, fyke nets, gill nets, and trammel nets. On the riverside where water was shallow, casting nets (7 × 7 mm) and kick nets (4 × 4 mm) were used to investigate each sampling site of 200 m for 60 min. Moreover, in areas where it was difficult to use casting nets and kick nets due to the depth of water, fyke nets (5 × 5 mm), gill nets (45 × 45 mm), and trammel nets (12 × 12 mm) were used, and fish were sampled 24 hours after the installation of nets. Main taxonomic characteristics of fish were identified based on Kim and Park (2002), and fish were released afterwards. To identity and investigate fish in detail in cases, fish were fixed in a 10% formalin solution, and were identified and classified in our laboratory.
>
Metric components of the multi-metric fishway assessment model
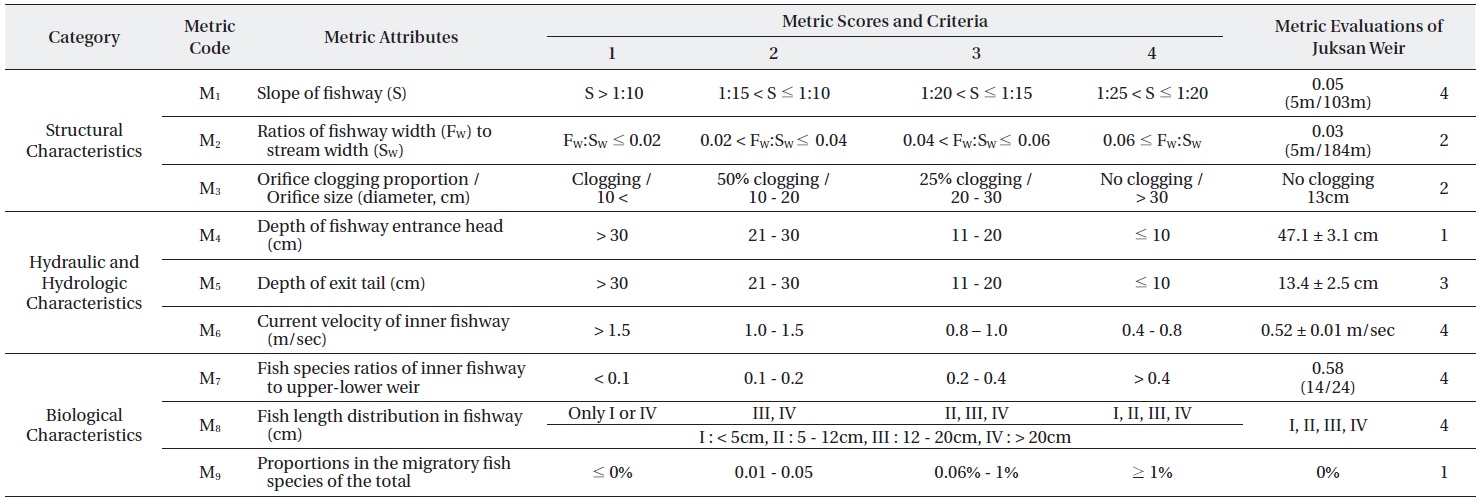
The multi-metric fishway assessment model (Mm-FA) was developed to comprehensively reflect the structural and hydraulic/hydrologic characteristics of fishways and the biological characteristics of the movement of fish through fishways. Thus, Mm-FA model was composed of nine metrics (Table 1). Scores 1 through 4 were given to each metric and the total score was calculated. Based on the calculated total score, fishway efficiency was assessed and classified as follows; a total score of 31–36 was “excellent,” 24–30 was “good,” 17–23 was “fair,” 9–16 was “poor,” and <9 was “very poor.”

The integrated multi-metric fishway assessment model (Mm-FA model) and the evaluations of fishway of Juksan Weir
>
Metrics property analysis of the Mm-FA model
The Mm-FA model was divided into three categories with nine metrics, which were structural, hydraulic/hydrologic, and biological characteristics of fishways (Table 1). The first category reflected structural characteristics of fishways and consisted of slope of the fishway (M1), ratios of fishway width to stream width (M2), and the proportion of orifice clogging and orifice size (M3). The second category indicated hydraulic/hydrologic characteristics of fishways and consisted of depth of the fishway entrance head (M4), depth of exit tail (M5), and current velocity of inner fishway (M6). The last category, which consisted of fish species ratio of inner fishway to upper-lower weir (M7), fish length distribution (M8), and proportion of the number of migratory fish species to the total number of species in the fishway (M9), reflected the biological characteristics of fishways. Detailed properties of metrics (Mx) used as variables in Mm-FA model are as follows.
>
Structural variables of fishway
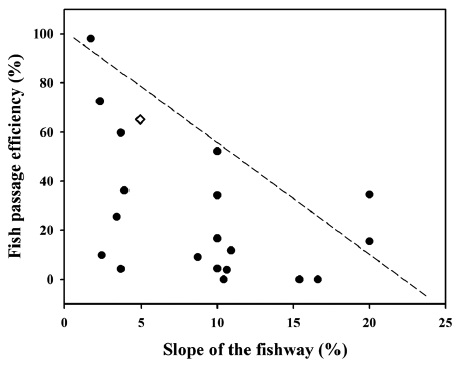
Slope of fishway (M1) was used to assess the efficiency of fish movement according to fishway slope, and to evaluate whether the fishway slope was appropriate for the ascent of fish. In Fig. 2, a scatter plot graph showed the evaluation of fishway efficiency according to fishway slope collected by Noonan et al. (2012) and BCME (2011). To testify the fishway efficiency of Juksan Weir, it was applied to Korean fishways. According to Noonan et al. (2012) and BCME (2011), efficiency of movement was the highest when slope was less than 3%, and the efficiency was low when slope was higher than 10%. As a result, the fish passage efficiency of Juksan Weir was categorized to be high (Fig. 2). Similar results have been also reported by MEK (2004) and Ahn et al. (2012), to develop a standard model for fishways.
M2 showed ratio of fishway width to width of the stream where the artificial weir was constructed, in order to evaluate the efficiency of the ascent of fish according to fishway width. According to MEK (2004), fishway width should consider size and flow rate of rivers and waterways, and it should also be determined by type of the fishway, including water level and flow rate inside. Moreover, fishway width should be between 1% and 15% of the entire length of dam/weir, and minimum fishway width should be based on length of ascending fish. In particular, fishway width should maintain its current velocity at 0.8 m/s when normal flux flows through fishway between April and June. For instance, if the flux between April and June is 5 m3/s and the water level is 0.5 m, a fishway width of 12.5 m is needed to maintain the current velocity at 0.8 m/s. According to BCME (2011), evaluation of fishway efficiency can be made by evaluating the ratio between fishway and stream widths; a score of 1 is given to ratios lower than 1%, a score of 3 is given to ratios between 1.0 and 1.3%, and a score of 5 is given to ratios higher than 1.3%. In addition, to establish the scoring criteria of the metric, the fishway form and fishway evaluation criteria established by Seong et al. (2013) based on the River Design Standard were modified and adopted.
The proportion of orifice clogging and orifice size (M3) evaluated the efficiency of fishways according to size and degree of clogging of orifices, which provided passage for benthic species. Size of orifice should reflect type of fishway and the ecological characteristics of species that use the fishway, and a review of physical factors, such as floating objects and the deposition level of sediments in the watershed, should be conducted. We used the size of the orifice, which reflected the characteristics of benthic species in the river, and the degree of clogging of the orifice by sedimentation and wastes to establish the scoring criteria of the metric.
>
Hydraulic and hydrologic variables for the Mm-FA model
M4 (depth of the fishway entrance head) and M5 (depth of exit tail) evaluated the efficiency of fishways according to spillway depths at fishway entrance head and exit tail. According to MEK (2004) that used hydrologic models of fishways with different spillway depths, if spillway depth is less than 20 cm in fishways with slopes of 1:15 (6.7%) and 1:20 (5%), current velocities are lower than 0.8 m/s in both fishways, with little difference between them. However, if spillway depth is over 25 cm, velocities increase to 1.03-1.28 m/s, marginal spillway depth appropriate for the ascent of fish through fishways was found to be 20 cm. In other words, in spillway depths between 10 and 20 cm, current velocities (0.2-0.6 m/s) were appropriate for the ascent of fish regardless of actual spillway depth. If spillway depths exceed 20 cm, it would be difficult for small species with poor swimming abilities to use the fishways, and we used this information to establish the scoring criteria for M4 and M5.
M6 (current velocity of inner fishway) took account of swimming and jumping abilities of fish to evaluate the efficiency of movement of fish according to current velocity. In order to increase efficiency of fishways, an intrafishway design current velocity of 0.5-1.0 m/s is suggested for all fish species (MEK 2004). According to the results of the hydrologic model study by MEK (2004), current velocities around 0.8 m/s were observed in Iceharbor-type fishways with inter-bulkhead height differences of 0.1 m, inter-bulkhead distance of 2 m, slope of 1/20, and a spillway depth of 0.1 m. Moreover, Park (2001) reported that normal sustained swimming speed and burst swimming speed of spindle-shaped fish were 2-4 BL (Body length)/s and 10 BL/s, respectively, and that swimming ability of fish was highest when intra-fishway current velocity was 0.8 m/s. Moreover, in a North American study conducted by Noonan et al. (2012), swimming ability was highest, in a statistically significant way, when intra-fishway current velocity was between 0.5 and 1.0 m/s. Because most fish that use fishways in Korea are between 20 mm and 280 mm, the marginal current velocity was calculated to be between 0.6 m/s and 1.2 m/s. However, we also took into account the mobility of the juvenile fish and species with small body sizes in establishing the scoring criteria of the metric.
>
Biological variables for the Mm-FA model
M7 (ratios of inner fishway to upper-lower weir) assessed diversity and abundance of fish that used fishway. M7 showed the characteristics of fishway usage by species that live throughout entire weir, by assessing the ratio between number of species sampled from entire upstream and downstream reaches of the river and number of species that used the fishway.
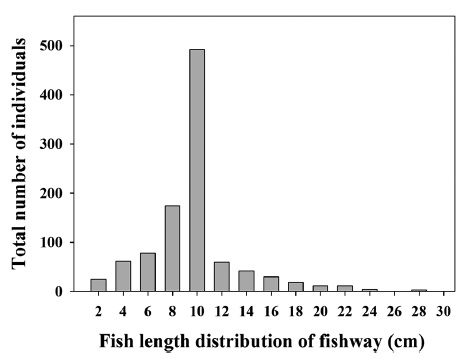
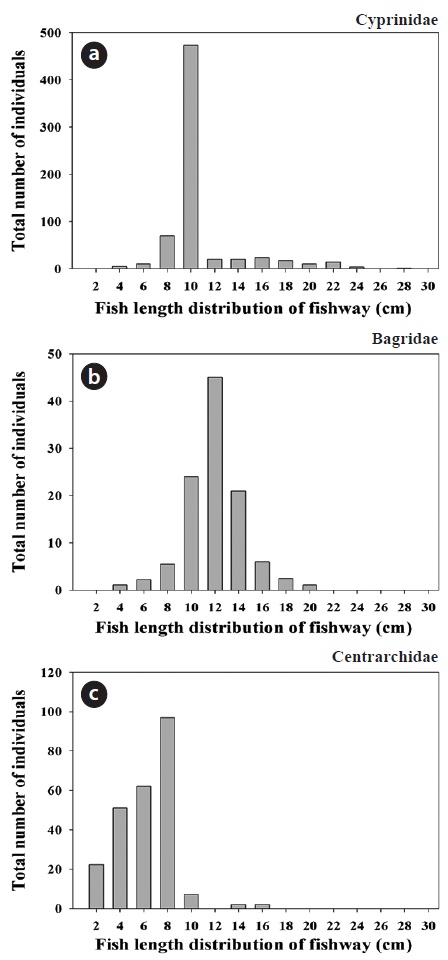
Fish length distribution (M8) assessed whether all organisms, including juvenile and adult fish lived in the Yeongsan River, use the fishway. We measured total lengths of fish sampled from the fishway using traps and divided them into four groups: group I with body lengths below 5 cm, group II with body lengths between 5 and 12 cm, group III with body lengths between 12 and 20 cm, and group IV with body lengths over 20 cm. Then, we used the distribution of fish lengths in our evaluation of fishway efficiency.
The proportion of migratory fish species to the total (M9) assessed the use of the fishway by migratory (homing and peripheral) species and evaluated the efficiency of fishways by calculating the relative abundance of migratory species, which usually live in upstream and downstream reaches of the weir, in the fishway.
>
Evaluation of fishway of Juksan Weir using the Mm-FA model
According to the analysis of structural characteristics of fishway, the slope of fishway (M1) on Juksan Weir was 0.05 (width of 5 m and length of 103 m), which was appropriate for the ascent of fish; therefore, a metric score of 4 was assigned (Table 1). The ratio of fishway width to stream width (M2) was 0.03 (fishway width of 5 m and mean stream width of 184 m) and was given a metric score of 2 (Table 1). The size of orifice in the fishway of Juksan Weir was 13 cm, and three orifices were found in the fishway. Clogging of orifices by wastes or sediments rarely occurred during periods of normal rainfall, although water plants and wastes that flow down from the upper river during the monsoon season clogged certain parts of the orifices. Therefore, a metric score of 2 was given to M3, which evaluated the size and degree of clogging of orifices, because the orifices were 13 cm and the clogging of orifices by floating objects and sediments was only rarely observed (Table 1).
According to the analysis of hydraulic/hydrologic characteristics of the fishway, M4, which is depth of the fishway entrance head, was given a metric score of 1 with the mean spillway depth at the fishway entrance head of 47 cm (
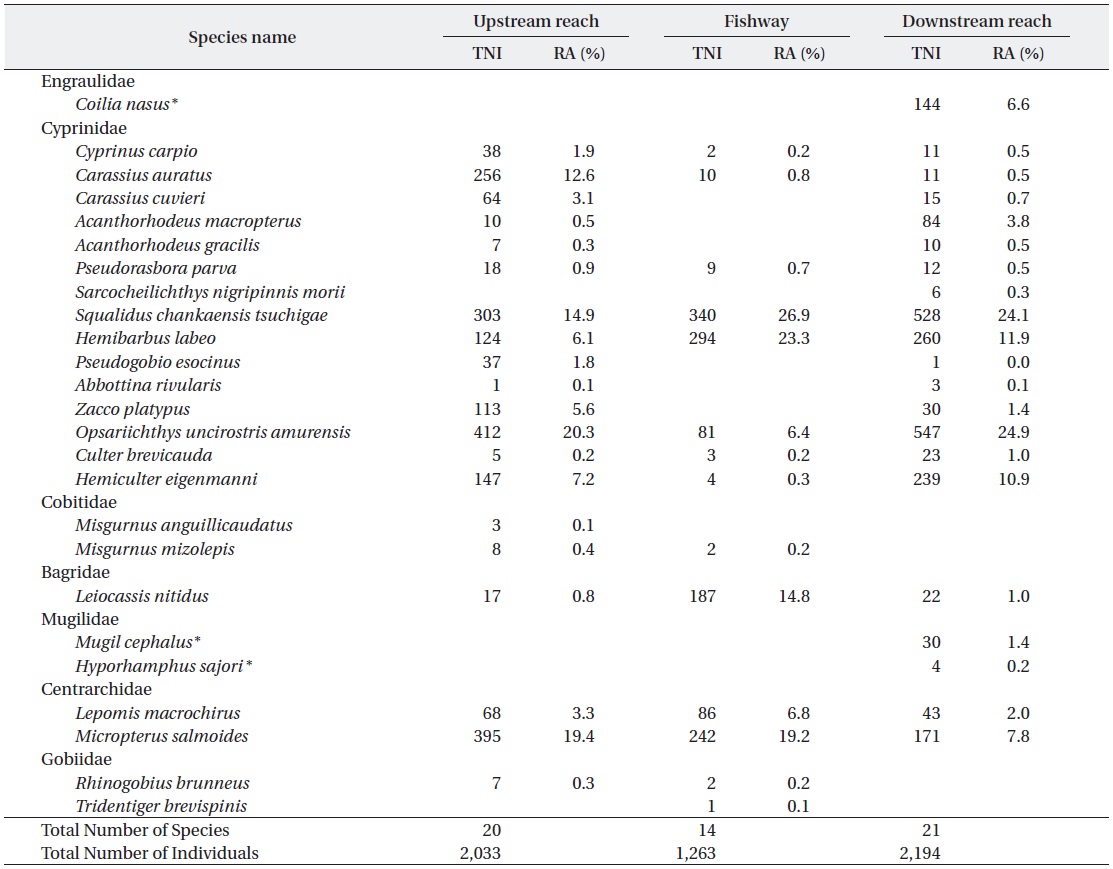
During the analysis of biological characteristics of fish that ascended through the fishway, 4,227 individuals of 24 species were totally sampled in upstream and downstream reaches of the Juksan Weir; 2,033 individuals of 20 species and 2,194 individuals of 21 species were sampled in upstream and downstream reaches, respectively. Moreover, 1,263 individuals of 14 species were sampled in traps installed in the fishway, indicating that various species were using the fishway (Table 2). Based on this, the ratios (in number of species) of inner fishway to upperlower weir (M7) was determined to be 0.58 (14 species that used the fishway/24 species in upstream and downstream reaches of the weir), and the metric score for M7 was 4 (Table 1).

Fish species composition and relative abundance (RA, %) sampled at the fishway, and upstream and downstream reaches of Juksan Weir in the Yeongsan River watershed. * indicates migratory fish species and TNI stands for total number of individuals
When the total lengths of fish caught in the fishway were analyzed, the mean total length was 89.8 mm. The largest organism was a 280 mm long
In downstream reach of the Juksan Weir, three migratory species, which were
>
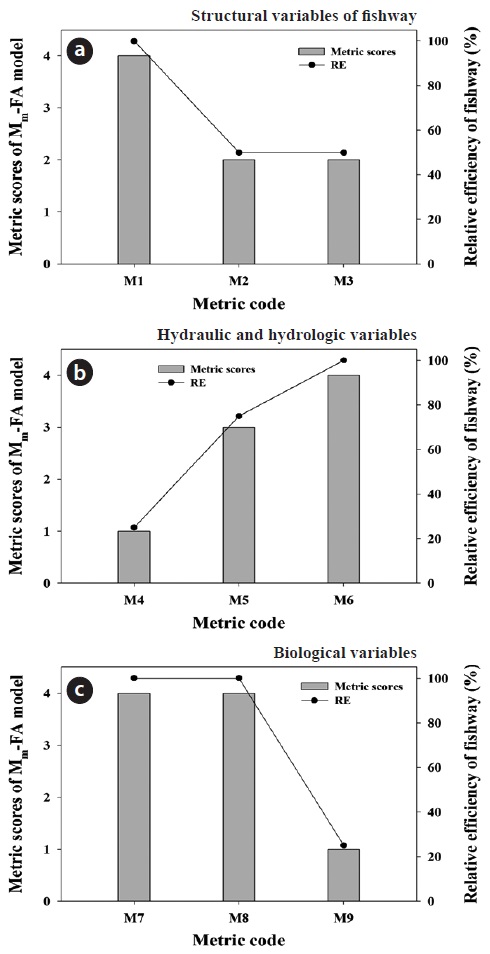
Evaluation of fishway passage in the fishway
According to the efficiency evaluation of the fishway using the Mm-FA model, the total score was 25, which was classified as a second grade or “good condition” (Table 1). When scores of each metric was analyzed (Table 1 and Fig. 5), M1, M6, M7 and M8 had metric scores of 4, which were “excellent,” M5 had a metric score of 3, which was “good,” M2 and M3 had metric scores of 2, which were “fair,” and M4 and M9 had metric scores of 1, which were “poor.” The analysis of each metric score revealed that the fishway of Juksan Weir has a slope appropriate for the ascent of fish, that the fishway is not greatly influenced by sediments and wastes, and the spillway depth at the entrance head and exit tail is also appropriate for swimming and jumping of fish. Moreover, it was shown that 58% of species living in upstream and downstream reaches of the weir use the fishway, indicating fishway efficiency. In contrast, migratory fish, such as
In this study, Nine-metric Fishway Assessment Model (Mm-FA model) was developed for the assessments of fish passage, and was applied to the fishway of Juksan Weir in the Yeongsan River watershed. The Mm-FA model was divided with three categories, which are the structural, hydraulic/hydrologic, and biological characteristics of the fishway, and consisted of nine metrics. First, in terms of the structural characteristics of fishway, the slope of fishway (M1), the ratio of fishway width to stream width (M2), and the proportion of orifice clogging and orifice size (M3) were analyzed. Second, in terms of the hydraulic/hydrologic characteristics of fishway, the depth of the fishway entrance head (M4), depth of the fishway exit tail (M5), and current velocity of the inner fishway (M6) were analyzed. Finally, in terms of the biological characteristics of fish-way, the ratios (in number of species) of the inner fishway to the upper-lower weir (M7), fish length distribution in the fishway (M8), and the proportion of migratory fish species to the total number of species (M9) were analyzed. According to the results of the assessment of the Juksan Weir fishway using the Mm-FA model, the mode scored 25, which was classified as a second grade “good condition.” The fishway of Juksan Weir has a slope appropriate for the ascent of fish, and the spillway depths at its entrance head and exit tail are appropriate for swimming and jumping of fish. Moreover, as it was shown that 58% of species living in upstream and downstream reaches of the weir use the fishway, the fishway efficiency was high. The Mm-FA model, which assesses the efficiency of fishways, was used in this study to assess the fishway of Juksan Weir in the Yeongsan River, and it will be used to assess the efficiency of fishways in medium- and large-sized weirs in the four major rivers of Korea. In order to apply the Mm-FA model to weirs of various sizes, it is deemed necessary to adjusted several metric properties, and characteristics of indices. When applying the adjusted model to weirs in the four major rivers of Korea, the Mm-FA model will be a core model, suitable for evaluation of fishway efficiency.