Structures, such as dams and weirs, constructed for the utilization of water resources in river ecosystems reduce longitudinal connectivity and habitat availability for lotic organisms (Reyes-Gavilán et al. 1996, Rosenberg et al. 1997). Various types of fishways (pool type, vertical slot, Denil pass, eel ladder, fish lock, fish lift, culvert, and nature-like fishway) were developed and built as structures to restore the decreased connectivity (Clay 1994). The nature-like fishway has a slope, substrate type, water movement, and channel morphology similar to natural rivers, and thus, can be used as a pass way for various species (Jungwirth 1996, Eberstaller et al. 1998, Parasiewicz et al. 1998) and functions as a potential habitat for lotic organisms (Pander et al. 2013). In the past, nature-like fishway design emphasized its function as a pass way, and aspects of habitat quality were often overlooked. Recently, however, the habitat use of nature-like fishways by fishes and macroinvertebrates has been monitored, and studies have focused on the function of fishways as a habitat, including measures to increase habitat function by controlling pool area within fishways (Lee et al. 2012, Gustafsson et al. 2013).
A method widely used to evaluate the habitat suitability of fish is stream habitat analysis (Moir et al. 2005). The stream habitat analysis calculates the flow rate considering each factor of the ecological environment, and combines results from the physical habitat suitability index and hydraulic analysis of the particular organism to determine a habitat size that can be provided in the target river (Kang et al. 2010). Regarding the stream habitat analysis, a model used in more than 90% of fish habitat modeling is Physical HABitat SIMulation (PHABSIM), which uses instream flow incremental methodology (Bovee 1982). An Ecological flow using the PHABSIM is usually estimated in rivers with regulated flow rates, such as discharge at dam, and this criterion can be used to select the optimal flow rate for ecologically healthy habitat of rivers (Kang et al. 2010).
Fishways are adjusted their flow rate depending on water level of the upper part of structure, and are usually composed of sluices and baffles to regulate flow rate. Therefore, when applied to fishways, the PHABSIM can evaluate habitat function by plotting possible area indicating weighted usable area (WUA), and can provide measures to increase the habitat function by plotting the ecological flow for primary species using fishways. However, this can only be applied to nature-like fishways that have a similar form in rivers. In Korea, there has been an increasing interest in nature-like fishways, as demonstrated through the installation of eight nature-like fishways in 2012. However, most studies conducted using nature-like fishways installed in Korea evaluated their effectiveness as pass ways.
The nature-like fishway in the Sangju Weir, Nakdong River, was constructed to ensure the connectivity of fish that inhabits the upper and lower parts of the weir. By creating decreased lotic environment due to the weir construction, the fishway is predicted to provide a suitable habitat for some lotic fishes. Purposes of this study were to estimate flow rates of the nature-like fishway in the Sangju Weir and to optimize the habitat function. The primary species using the fishway were identified with a trap. We used the PHABSIM to plot the optimal ecological flow rate that would be able to maximize the available habitat within the fishway. The results of the study would be used to provide a management plan considering the function of the nature-like fishway in the Sangju Weir as healthy habitat.
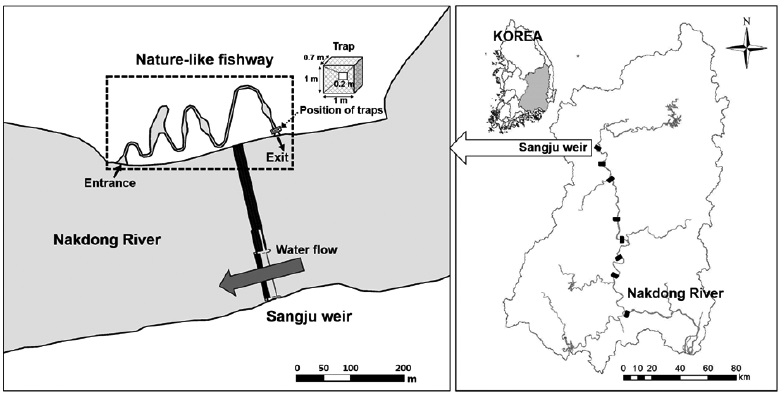
As part of the Four Major Rivers Restoration Project in 2012, the Sangju Weir (335 m in length and 11 m in height) was built on the most upper reach as one of 8 weirs constructed in the mainstem of the Nakdong River in Korea. The study was conducted in the nature-like fishway, which was constructed to improve the up- and downstream movement of fish on the right side of the Weir (Fig. 1). Total length of the fishway is 700 m and its slope is 1/100. Moreover, the fishway was designed and constructed to form a zigzag for utilizing the narrow space effectively. The fishway width is generally maintained about 6 m in length, with an average width of 7.4 m. The flow rate within the fishway was related to the water level of the upper part of the weir, so it varies accordingly.
The primary goal of the study was to confirm the fishway function as a habitat for fishes; therefore, the primary species using the fishway were selected as target species. To determine the primary species, we installed traps (1 × 1 × 0.7 m; mesh, 4 mm) at the exit of the fishway (Fig. 1). Six traps were installed at the exit to block the entire fishway, and all upstream-migrating fishes were collected. The traps were installed and monitored monthly from August to October 2012. We installed traps at 16:00, and collected and identified fishes after 24 hour monitoring.
The collected fishes consisted of 2 families and 9 species, totaling 1,713 individuals (Table 1). The primary species that used the fishway were
[Table 1.] List of fishes collected by traps.
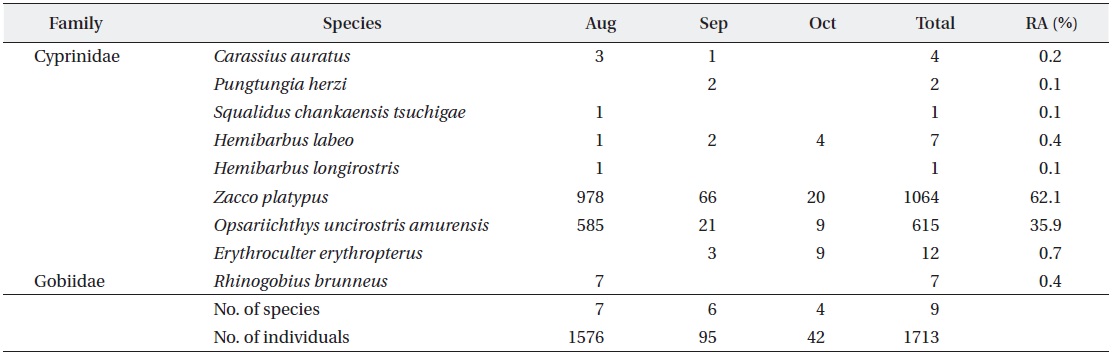
List of fishes collected by traps.
>
Calculating optimal ecological flowrate
Calculation of the optimal ecological flow rate (OEF) for
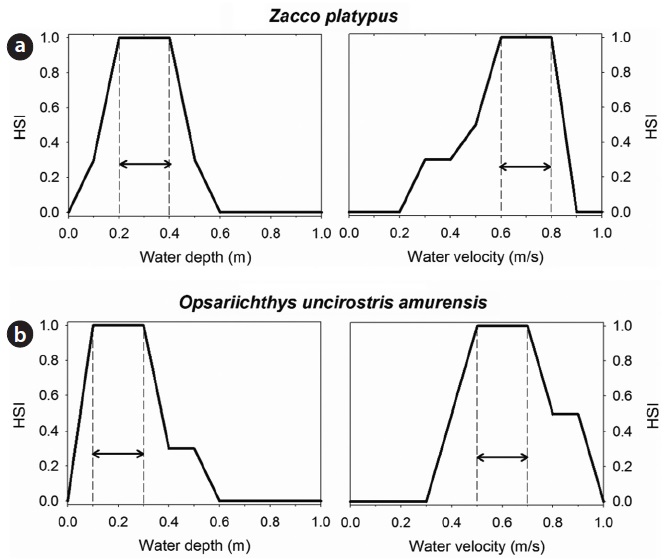
We studied the physical data of the 700 m fishway in 7 sections of about 100-m intervals each. For each section, flux information of the section was calculated by measuring the water depth and water velocity (FP11; Global Water, College Station, TX, USA) 1 m from the waterside. Physical data of this fishway were examined twice in September 2012. HSI of the primary species using the fishway was recorded based on the fish population that appeared at the specific study site or section. The maximum value of physical data in the habitat with the highest number of fish was set to 1.0, and the remaining were set to a relative ratio of the maximum value. HSI of target species is an essential factor in evaluating fish habitats, and through credible data collection, it is important to provide and apply HSIs that reflect actual fish habitat (Bovee et al. 1998). For this reason, HSI is generally based on the habitat environment of fishes in the actual study site. However, because target species were collected at a specific site within the fishway, unlike typical rivers, it cannot be concluded that the fishway is preferred as a habitat. These fishes were collected during migration to the upper stream, and did not necessarily prefer the collected site to use as a pass way, since the fishway is an artificial structure and is the only available pass way for fishes. To overcome this issue, the present study computed the HSI value by using an established habitat information database (Bio-Monitoring Center, Daejeon, Korea) of
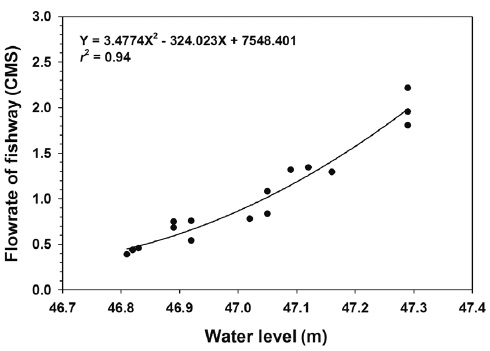
To determine the flow rate within the fishway with respect to the water level of the upper Sanju Weir (Nakdong River Flood Control Office), flow rate within the fishway was monitored over 16 times. A regression equation for the water level of the upper part of fishway and flow rate within the fishway was determined using SPSS ver. 18.0 (SPSS Inc., Chicago, IL, USA) software.
HSI values of water depth and water velocity for the primary species,
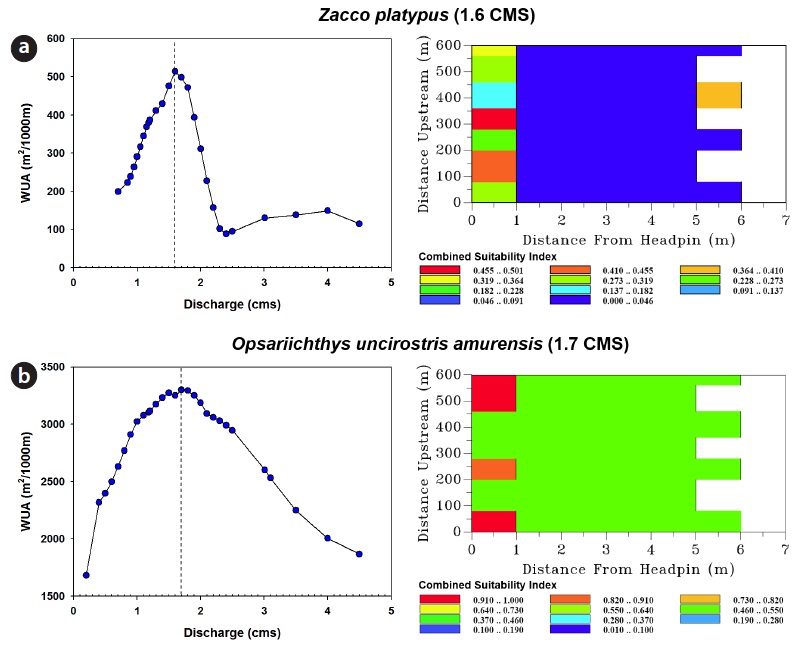
The water flow-WUA relationship plotted from PHABSIM using the physical environment within the fishway and HSIs of
Changes in flow rate within the fishway, which varied with the water level of the upper part of the Sangju Weir, are depicted in Fig. 4. For an inflow of 1.6–1.7 CMS (the OEF of
The OEFs using PHABSIM for
There have been various studies on OEF estimations in rivers using PHABSIM for the restoration and preservation of specific fishes (Vilizzi et al. 2004, Moir et al. 2005). The majority of the current studies were conducted for dominant species (Kang et al. 2010, Im et al. 2011, Kang et al. 2011). In addition, there were studies on competitive salmonids (Gibbins et al. 2002, Gard 2009) and endangered species (Boavida et al. 2011). The present study site was a nature-like fishway, and the OEFs of
The majority of the current studies have been conducted to understand the function of fishways as pass ways (Bunt et al. 2012), and these have been continuously evaluated using traps, automatic video recording systems, and diverse telemetry methods (PIT, radio, and acoustic tags) (Barry and Kynard 1986, Cada 1998, Oldani and Baigún 2002, Aarestrup et al. 2003, Santos et al. 2005). The results concluded from these have been utilized to design high-efficiency fishways, or provide management plans for fishways (Larinier et al. 2005, Barrett and Mallen-Cooper 2006). In contrast, because the function of fishways as a habitat has not been prioritized historically, there are few related research studies. Similar to the present study, Lee et al. (2012) utilized the River2D model to evaluate the function of fishways as a habitat, but it was limited to a pilot test. However, through PHABSIM, the present study calculated the WUA of primary species that use fishways in an actual operating fishway, and determined its function as a habitat. Moreover, we computed OEFs to propose measures that can increase the fishway habitat functions. Regarding methodology, it could be utilized as an appropriate tool to provide measures to increase and determine the function of fishways as habitats.