Up until the era of third-generation mobile networks, voice had been one of the most highly utilized applications on mobile services. As such, voice has been at the center of concern regarding guarantees of quality of service (QoS). These measures include limited delay in packet transfer and sustained guarantee of bandwidth during a voice conversation.
Corresponding to QoS requirements for voice, much research has been conducted on network engineering for voice-over-IP networks [1,2]. Over the last 10 years, we, too, have pursued research related to QoS guarantees for voice over IP on topics such as bandwidth dimensioning, traffic control and differentiation, resource allocation, and pricing schemes for voice and data (Representative research appears in [3-10]).
However, with the introduction of fourth-generation mobile networks such as long-term evolution (LTE), the dominant consumer of network bandwidth has shifted from voice to data applications, expedited by penetration of smartphones into the market.
More than 40 million mobile customers in Korea had a smartphone at the end of 2014. Adoption has almost reached a saturation state. This means that almost everyone in Korea can enjoy rich multimedia services via smartphone.
Recently, the three major mobile operators (MOs) in Korea released a new type of pricing plan called a ‘data plan’, where pricing is based solely upon the volume of data consumed. Voice, in these plans, is free of charge (described hereafter as ‘unlimited voice’).
KT was the first company to market in Korea when they released a data plan (DP) in May 2015. More than 1.5 million customers selected this plan in just two months [11]. The other major MOs—SKT and LGU+—have since released similar plans. It can be said that ‘
According to [11], the main reasons for the introduction of DPs were as follows: first, the conventional pricing plan, which dictates an upper bound for the usage of voice and data, is too complex. There are many ways to mix levels of voice and data usage. Second, there exist mismatches in the amounts of allowed voice and data usage: some customers want more data and less voice, and vice versa. However, almost all tiers in conventional plans are designed around proportional volumes of data and voice. High data limits are paired with high voice time caps (Table 1). This has been one of the main complaints of customers. Finally, DPs had already been introduced in the US and Japan, and this has been the major trend of mobile IT worldwide.
[Table 1.] Past plan of a mobile operator
Past plan of a mobile operator
Moreover, in June 2015, KT commercialized a Giga LTE network that realizes 1.17 gigabits per second (Gbps). This is the first such network in the world [12]. KT’s Giga LTE is a hybrid of LTE and Wi-Fi, where 3-band LTE (300 Mbps) and Giga Wi-Fi (867 Mbps) are clustered. Giga LTE’s wider bandwidth can provide users access to richer data services.
KT’s commercialization of the Giga LTE network is in line with its new business strategy for the coming future. KT has listed five key services in its envisioned future: smart energy, integrated security, health care, next generation media, and intelligent transport control [12]. These future key services all belong to the realm of data applications. Growth in such services will only solidify this as the era of data.
Recently, the market for voice service has contracted because, in part, data applications such as Kakao Talk can substitute for voice applications. One readily finds people absorbed in websites and writing messages over Kakao Talk on their smartphones in the streets and cafes of Korea. However, it is not easy to find people in conversation on their smartphone: messaging has substituted for conversation.
We argue that it is important to investigate the actual volumes of voice and data network traffic generated in the current LTE network. A search of the literature revealed no such studies.
Therefore, this work investigates the real state of voice and data service usage, from which we search for factors associated with the impact of application usage on the current mobile network. From the analysis of these real data, we will infer the reasoning behind the introduction of data plans.
This work is composed as follows: in Section II, we summarize pricing plans before and after DPs are introduced. In Section III, we present the result of our analysis of the usage pattern for voice and data based on real field data from smartphones before DPs were introduced. In Section IV, we summarize findings from the analysis and implications of our findings. In Section V, we summarize this work.
II. CHARGING PLANS: PAST AND PRESENT
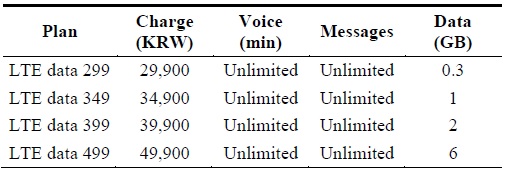
We begin by presenting representative pricing plans for LTE service before and after DPs were introduced. Table 1 shows the pricing plan of an MO just prior to DP introduction (May 2015) [13]. Let us call this the
As can be seen in Table 1, there exists a positive correlation between the allowed amounts of voice time and data volume in the past plan. The greater the allowed data volume, the greater the voice time afforded.
We argue that no positive correlation exists between the actual volumes of the two applications, which will be shown in Section III. This is considered to be one of the many problems inherent in the past pricing plan. Many customers consume much more data than voice time, and vice versa. However, the past pricing plan ignores these mismatches.
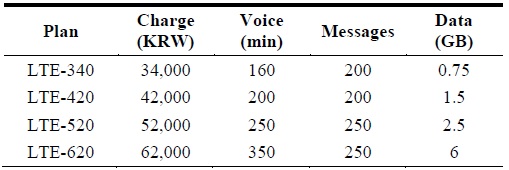
Table 2 shows a pricing plan of an MO after the DP is introduced [13]. Let us call it the
[Table 2.] Present plan of a mobile operator

Present plan of a mobile operator
There are many configurations of pricing plans besides the one shown in Table 2. However, we selected a plan that corresponds to the past plan in Table 1.
As Table 2 demonstrates, the present plan provides users with unlimited usage of voice and messaging. Pricing is based only on the volume of data. This resolves the problem of mismatch in the volumes of voice and data: customers are free from limits on usage of voice.
Summarizing our observations, we found three characteristics of the present plan: first, the present plan allows unlimited usage of voice and messaging. Second, monthly charges for tiers in the present plan tend to be lower than comparable tiers of the past plan. Finally, the amount of data usage allowed at each tier is reduced when compared to the past plan.
III. USAGE PATTERN OF VOICE AND DATA
In order to get a realistic impression about the usage pattern of voice and data applications on the mobile network, we collected real data from a convenience sample of active users in their mid-20s who were enrolled in the Department of Information and Communications Engineering at Changwon National University during the 6 months prior to the introduction of DPs (November 2014–April 2015).
We collected traffic data for each type of application from the students. Students were subscribers to KT, SKT, and LGU+ plans. It was difficult to collect data from a sufficient number of customers due to the potential privacy violations involved in performing this study. However, it would otherwise be trivial to extend the size of the sample.
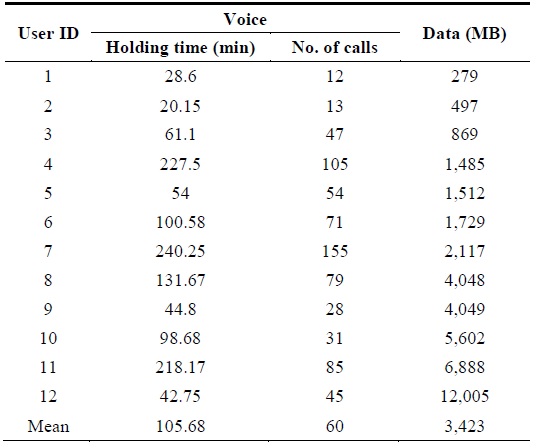
As for voice, we recorded total holding time and the total number of voice calls generated in a month by each customer. We used this data to compute the mean voice volume in units of seconds consumed per month by a customer. The number of voice calls was also collected for reference.
Computation of the data volume was straightforward. We report it in megabytes (MB). Table 3 illustrates our findings.
[Table 3.] Usage of voice and data

Usage of voice and data
Table 3 shows how the volume of voice and data traffic varies widely among the customers observed. Some consume more than 10 times in the volume of data as others. The range of data consumption is even wider.
The customer consumed 106 minutes of voice time and 3.423 GB of data in average for a month. Comparing this result with the conventional pricing plan given in Table 1, we find that voice consumption falls below the LTE-340 tier, while data consumption falls between the LTE-520 and LTE-620 tiers. Note that the greatest number of customers were located near the LTE-520 tier data cap, but most of these would have faced extra charges if they selected the LTE-520 tier. It is also worth noting that selection of the LTE-620 tier is inefficient, because the average usage of data is only 57.05%.
Based on our observations of mobile service subscribers, we found that there exists a severe imbalance between the usage of voice and data in the conventional pricing plan. Customers were more likely to consume data at a rate associated with higher plan tiers and voice at a rate associated with lower plan tiers. This points to one of the many factors involved in customer dissatisfaction with the past pricing plan. It appears that MOs changed from the conventional pricing scheme to DPs with this in mind.
The volume of voice and data are represented in different ways in Table 3—voice in the unit of minutes, data in megabytes. The average volume of voice consumed monthly in our study was 105.68 minutes. On the other hand, the average volume of data consumed monthly by customers in our study was 3,423 MB.
Note the difficulty in determining the ratio of voice and data network traffic from this representation. In order to compare the volumes of voice and data traffic we needed to unify the unit of traffic for the two applications. Our methodology follows.
The voice frame is typically encoded by the mobile voice terminal at a speed ranging from a minimum of 12 kbps (for 3G adaptive multi-rate narrow band, abbreviated as AMR-NB) to a maximum of 24 kbps (for LTE AMR wide band, AMR-WB) [14,15]. The former is hereafter called
First, let us assume that the proportion of talk and silence is equal, represented by 0.5:0.5. Then, one can compute the traffic created by a voice conversation, which is given by 4.76 MB for the 3G network (assuming 12 kbps AMR-NB vocoding) and 9.52 MB (assuming 24 kbps AMR-WB vocoding) for the LTE network. In this work we assume the latter result for the reference voice traffic.
As one can see from the above discussion, each customer generates 9.52 MB of voice traffic and 3,423 MB of data traffic per month over the LTE network. Note that the ratio of voice traffic over the total traffic is 0.0028, which means that voice traffic is only 0.28% of the total traffic, whereas the data traffic is 99.72% of the total traffic. Voice traffic is almost negligible on the mobile network.
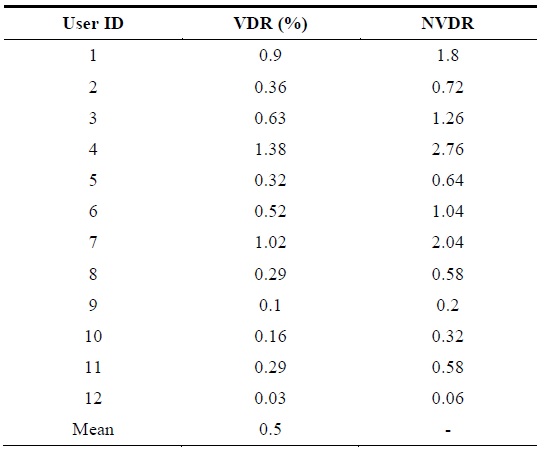
In order to present the usage pattern of the customer in more detail, we computed the ratio of the traffic volume between the voice and data (voice-data ratio [VDR]) in the unit of percent (%) (Table 4).
[Table 4.] Voice-data ratio (VDR) and normalized voice-data ratio (NVDR)
Voice-data ratio (VDR) and normalized voice-data ratio (NVDR)
In the right column of Table 4, the normalized VDR (NVDR) is presented, calculated by normalizing the individual VDR from the mean value. There are seven customers with an NVDR smaller than 1 and four customers with an NVDR greater than 1. One customer has an NVDR near 1. This indicates that the number of customers who generate voice traffic at a less-than-average rate is almost twice the number who that generate voice traffic at a greater-than-average rate. Moreover, the ratios in Table 4 indicate that a small share of studied individuals consume voice time at a rate far heavier than the norm, and a substantial share exhibit voice usage far lighter than the norm.
Table 4 also shows that VDR ranges from a minimum of 0.03% to a maximum of 1.38%. This means that voice traffic represents no more than 1% of total traffic for almost all customers.
One last point witnessed in our investigation is as follows: As one sees in Table 3, the mean number of voice calls per customer is only 60 per month. This means that, on average, only 2 calls are generated per customer per day.
Based on the preceding analysis, we argue that voice traffic represents an almost negligible burden on the current mobile network and that the voice application plays a much less important role among smartphone applications. Consequently, we argue that the marketing strategy of the MOs has changed focus to data applications. From this perspective, one may understand why the MOs introduced the new DP.
In this work we investigated the usage pattern of mobile voice and data just prior to DP introduction in Korea, from which we found that the volume of the voice traffic is almost negligible when compared with that of data.
From this finding we argue that the real reason for the MOs to introduce the DP is as follows: first, voice service is no longer the primary draw leading to realization of high average revenue per user (ARPU) from the mobile network. The amount of voice network traffic is much smaller than that of data traffic. Second, by making voice service unlimited, essentially free, MOs are free from the problem of guaranteeing QoS in voice service. It is common knowledge that guaranteeing QoS to real-time services such as voice is very difficult and very expensive. Even more, providing QoS in the current heterogeneous network environment, where the end-to-end path of the network is composed of an aggregation of wireless and wired networks is a complicated challenge for MOs.
In the future we will investigate the volume of voice and data applications consumed by the customers after DP introduction to the mobile network. In particular, we will collect the usage data from a diverse range of customers. This will give us further understanding of the impact of DP introduction on the mobile network.