Human gait is defined as a personal walking pattern using two limbs. Although the definition of human gait is simple, measurement of human gait patterns requires sophisticated techniques to capture the essence of human gait, including natural variations in gait [1]. Many researchers have recognized individual gait patterns as an authentication method. Unlike most of the previous gait classification approaches, this study uses an open data set with a large number of subjects for practical gait classification. Moreover, we chose machine learning algorithms to identify the effects of various factors influencing gait patterns. Particularly, we used a collection of machine learning algorithms in the Waikato Environment for Knowledge Analysis (WEKA) open-source software package [2]. WEKA allowed us to apply various types of machine learning algorithms to find appropriate machine learning techniques for human gait classification. The goal of this gait classification study was to use machine learning algorithms to efficiently classify both mature and immature gait groups from a single sensor-based gait feature.
This study used an open gait database collected by an inertial sensor-based system [3]. In order to extract a vector of gait features, each gait needed to be accurately recognized. Temporal gait feature computation was applied to feature extraction because of its simple computation [4]. Statistical methods were also used to obtain more information about time series gait patterns [5]. For this study, we selected three machine learning algorithms from among those available in WEKA based on relevant study [6]. The three algorithms resulted in an average of 81% accuracy in differentiating subjects who were below 10 years of age from the entire set of 350 participants. The proposed approach combines a majority voting technique to enhance classification accuracy.
The rest of the paper is organized as follows. Section II describes the characteristics of the open human gait data with an experimental environment, and elaborates on the proposed gait recognition and feature extraction techniques. In Section III, based on the features discussed in the previous section, we propose a new classification method and apply the gait recognition method using three machine algorithms. Finally, we present our conclusions in Section IV.
The data sets from the inertial sensor-based gait database [3] were analyzed through the gait recognition algorithm proposed in [7]. The first step of the proposed approach was the detection of each gait cycle. After the gait cycle detection, temporal and statistical gait features were computed. A total of 24 gait features were extracted for gait analysis in the next step.
In this study, we used an open gait database collected by an inertial sensor-based system [3]. Although the data set includes sensing data collected from different types of sensors, we utilized only the data set collected from a single low-back trunk accelerometer. The experiment was conducted on 744 subjects with ages ranging from 2 to 78 years. The original research group evaluated the performance of the gait authentication scheme with various age groups. They observed that those below 10 years of age and those above 50 years of age showed a relatively low classification accuracy compared to other age groups. They concluded that classification accuracy depended on whether each age group had walking skill maturity or not.
For the experimental study, we selected two age groups: those with a mature gait and those with an immature gait. Table 1 shows the age range of each group.
[Table 1.] Subject information
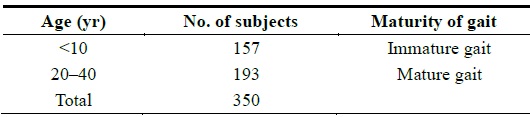
Subject information
In order to extract distinctive gait features, each gait needs to be accurately recognized. To identify each step motion, we captured heel-strike action by observing changes in acceleration at the heel strike moment.
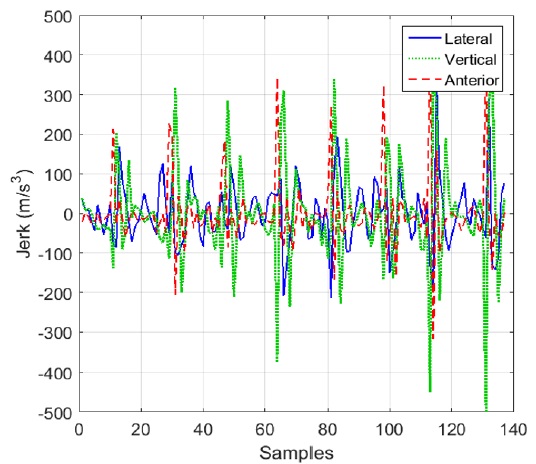
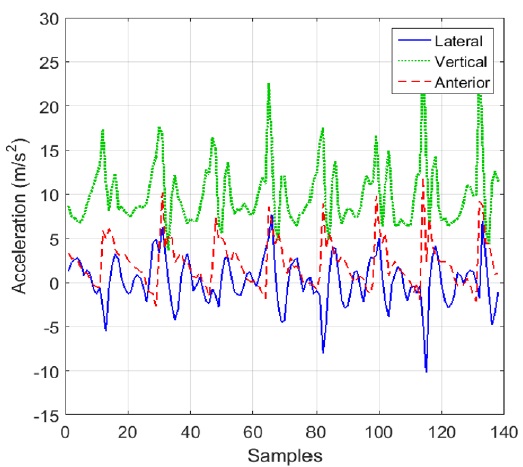
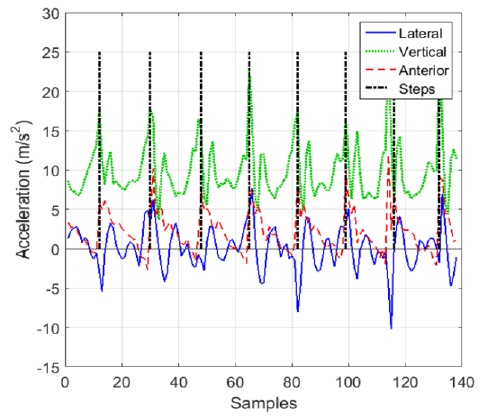
While examining three-dimensional acceleration data, we noticed that a jerk, defined as a change in the rate of acceleration over time, showed more dramatic pattern changes than raw acceleration data at each heel strike. As depicted in Fig. 1, each directional acceleration showed a peak at the heel strike; however, the raw acceleration graph has several small peaks that can be considered a heel strike point for each step. Fig. 2 shows the jerk data obtained from the raw acceleration data. The jerk graph shows a clearly noticeable pattern for the heel strike action. In particular, the post-anterior jerk can be used to accurately identify each heel strike.
In Fig. 3, the black dotted lines delimit each step. The black vertical lines are matched to original raw acceleration data to identify each step. The raw acceleration data was then used to extract gait features in the next step.
There are three major approaches to extracting gait features: temporal feature-based, frequency analysis-based, and statistical analysis methods [3]. In this study, we applied both temporal feature analysis and statistical approaches. Since the temporal gait feature computation is relatively simple, it can be applied to online gait classification systems [4]. Typically, statistical methods require more computations than the methods using temporal gait feature extraction; however, statistical methods can provide more information about time series gait patterns [5].
Table 2 categorizes the 12 selected fundamental gait features into either temporal or statistical gait features.
[Table 2.] Fundamental gait features
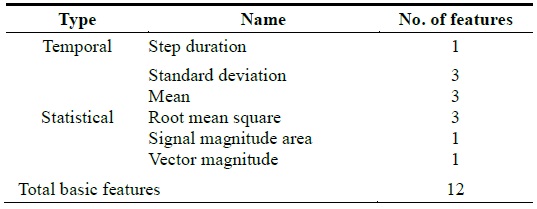
Fundamental gait features
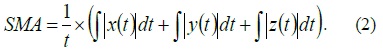
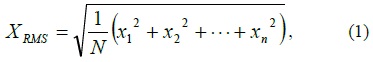
We applied several well-known statistical techniques to capture the characteristics of natural gait variation. Initially, a total of 12 gait features were extracted from the accelerations of each gait cycle, and then the averages of each feature were used for classification. The root mean square (RMS) of vertical acceleration and the signal magnitude area (SMA) of 3-axis signals were computed using Eqs. (1) and (2), respectively.

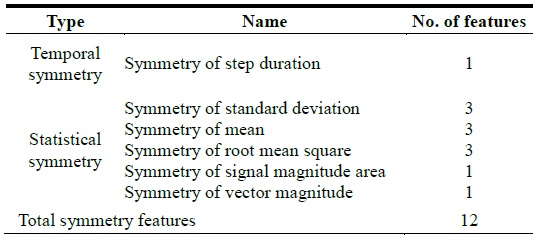
The 12 gait features listed in Table 2 were used to determine gait symmetry features. Gait symmetry is defined as a perfect agreement between the actions of the lower limb [8]. Two consecutive step features were used to calculate the symmetricity between the movement of the left and right limbs. A list of symmetry gait features is shown in Table 3.
[Table 3.] Symmetry gait features

Symmetry gait features
To efficiently categorize the subjects into two different groups, we have tested various classification algorithms in WEKA to choose higher accuracy algorithms which require inexpensive computation cost in testing phase. We chose three well-known machine-learning approaches: support vector machine (SVM) [9], random forest [10], and logistic regression [11]. The SVM classifier trains a hyperplane that maximizes the margin between two different clusters. In our experiments, linear kernel SVM was used. The resultant support vectors and weights can be represented simply by a linear combination of them. Random forest is an ensemble learning approach which makes use of randomized decision trees. It is easy to implement and has shown reasonable performance in many applications. On the other hand, logistic regression makes use of a logistic function. The logistic function takes the inner product of coefficients and a feature vector, and maps the feature vector to a specific class (0 or 1). The classifier can be trained by finding the best coefficients for all given feature vectors and the class labels of the training data set.
We also used the three trained classifiers to build a combined classifier that takes the label of majority votes among the results of the three algorithms. Three different classifiers can generate different decision boundaries. Thus, the combination of these decision boundaries can represent more complex shapes, and it can correctly classify some difficult examples. Moreover, once the classifiers are trained, the computational cost of the testing phase of the algorithms is relatively inexpensive. For example, the linear kernel SVM and logistic regression predict the label of a given feature vector in two steps. First, they take the inner product of a feature vector and the coefficients. Then, the values are used to evaluate a step function.
As we mentioned earlier, the data set contains 3-axial acceleration values collected from walking subjects. We chose two age groups from the open gait database [3]. One was an age group younger than 10 years old, and the other was a group of subjects in their 20s or 30s. The numbers of subjects for the age group 0–10 years and for the age group 20–40 years were 157 and 193, respectively.
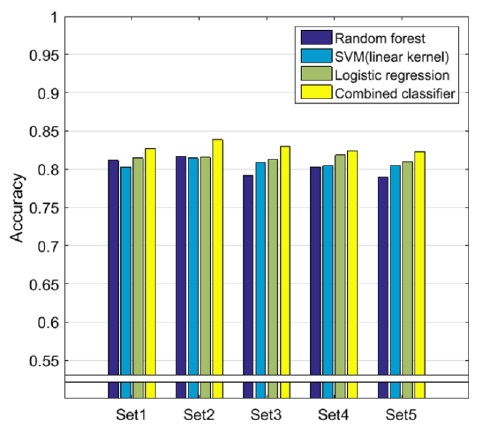
To evaluate the performance of the three existing algorithms and one combined method, we prepared five sets of experiments. For each set, we randomly assigned each feature vector to one of 10 subsets (of equal size) to perform a 10-fold cross-validation. The 10-fold cross-validation divides the data set into 10 subsets; each trial alternately chooses one subset for the testing phase and the remaining nine subsets for the training phase. We measured the accuracy of each algorithm. Where
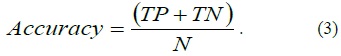
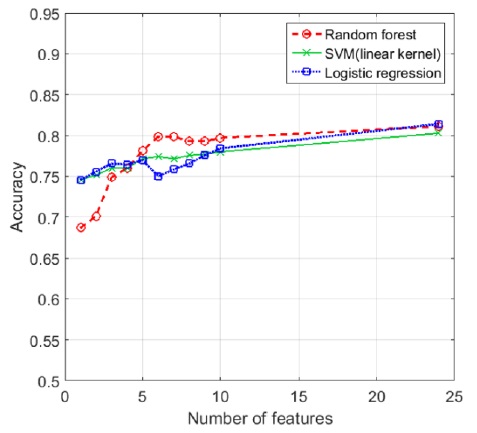
Table 4 and Fig. 4 show the accuracy of classification algorithms for each experimental set. The logistic regression classifier shows the highest average accuracy among three machine-learning algorithms. The combined classifier slightly increases the classification accuracy (by about 2%) for each experiment. We selected 10 features using a parameter selection method in WEKA. Table 5 shows the top six features that were identified. Then, we measured the accuracy of each classifier after adding the remaining features one at a time until the 10th feature.
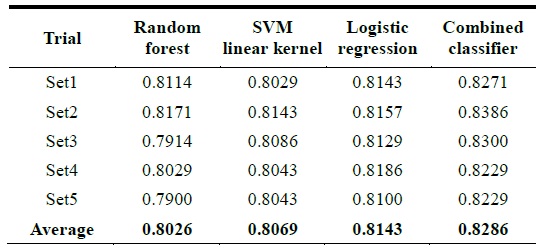
Classification accuracy of machine learning algorithms for gait classification between two age groups
[Table 5.] Top six gait features to predict two age groups with highest accuracy
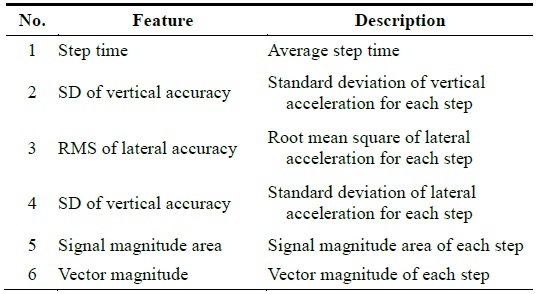
Top six gait features to predict two age groups with highest accuracy
The machine learning algorithms with the features proposed in this paper achieved about 81% accuracy on average. Although we defined 24 gait features for the classification in Section II, they are not equally important for the classifiers. Based on the results of our experiments, the classifiers with all 24 features achieved the best prediction accuracy in general. However, in order to minimize the computational complexity of the classifier, we may not want to use all features. Thus, the goal of this experiment was to find a minimum set of gait features without compromising the accuracy of the classifiers.
First, we evaluated the importance of the gait features using the support vector machine attribute selection algorithm available in WEKA. Table 5 lists the top six gait features chosen by the attribute selection algorithm.
Fig. 5 shows the prediction results of the top 10 gait features as well as all 24 gait features discussed in Section II. Based on the results of our experiments, the step time, a key temporal gait feature, was identified as the most important gait feature. As shown in Fig. 5, for both SVM and logical regression, the prediction accuracy with only the step time feature was about 75%. The standard deviation of the lateral and vertical acceleration dispersion features improved the accuracy of the classifier when it was combined with the step time parameter. Finally, overall step acceleration features such as the signal magnitude of the area and the vector magnitude of each step also helped improve the performance of the classifiers.
Based on the results of this experimental study, we recommend the top six gait features shown in Table 5 as a minimum set of gait features to be used for the classifier while maintaining prediction accuracy.
This study examined the classification accuracy of subjects from two different age groups. We treated a younger age group as an immature gait group and an adult group as a mature gait group. We chose machine learning algorithms to handle multidimensional gait features. We applied various classifiers conveniently to compare compatible machine learning algorithms for a vector of gait features using WEKA. As a result of the experiments, we achieved about 80% classification accuracy in distinguishing between the immature gait group and the mature gait group.