Hospital wastewater is considered a serious source of pollution as it contains various pollutants such as pharmaceuticals and metabolites, chlorinated organic compounds, endocrine chemicals, radionuclides, heavy metals, and other chemicals. Hospitals generate significant amounts of wastewater in a range of 400–1200 L/day/bed [1]. Point sources of pharmaceuticals in the aquatic environment include hospitals, medical institutions, health care facilities, pharmaceutical manufacturers, and animal farms. The disposal of unused or expired pharmaceuticals through sinks or toilets is considered a major diffuse source of municipal wastewater pollution [2]. Adverse effects that result from the presence of pharmaceuticals in the environment include aquatic toxicity, biological imbalance, development of resistance in pathogenic bacteria, genotoxicity, and endocrine disruption [3]. Lisinopril (LIS) is an active angiotensin-converting enzyme inhibitor used for the treatment of hypertension, heart failure, and acute myocardial infarction [4]. Chlorpheniramine (CP) is an anti-histamine drug, commonly used to treat allergies [5].
Adsorption is an efficient method to remove a wide range of pharmaceuticals [2,6]. In this paper, dehydrated and activated carbons were prepared from date palm leaflets, an agricultural byproduct that is available in the Gulf States in large quantities (~3 million tons/year and ~180,000 tons per year in Oman [2]), using phosphoric acid treatments. Both types of carbon were characterized and investigated for the removal of LIS and CP from aqueous solutions.
All chemicals used were of analytical grade. Pure pharmaceuticals (LIS and CP) were provided as powder samples by the National Pharmaceutical Industries Company (Muscat, Oman). Dry date palm leaflets (
Approximately 20 g of the clean dry leaflets was added to 200 mL distilled water, followed by the addition of 80 g of concentrated phosphoric acid with stirring. The mixture was left overnight in an oven (Hobersal Mon X B2-125 furnace; Hobersal, Barcelona, Spain) at 150℃ to chemically carbonize via dehydration. The produced dehydrated carbon (DC) was left to cool at room temperature, and an amount of DC was used to prepare AC as follows. DC with its residual phosphoric acid (without washing) was transferred to a quartz tube (internal diameter 5.1 cm and length 61 cm) to be in the heated zone of the tube furnace (GSL-1100X-110V; MTI Corp., Richmond, CA, USA). Under a nitrogen atmosphere, the temperature was raised from room temperature to 500℃ in 90 min at a heating rate of ~5.6℃/min and was kept at 500℃ for 1 h to produce AC. The produced AC was left to cool under a nitrogen atmosphere. Both carbons were washed thoroughly with hot deionized water to remove residual phosphoric acid followed by washing with ~1% NaOH solution for 1 h, to release humic substances from the carbons. Both carbons were then washed with deionized water until neutrality. To retain the ion exchange groups on the surfaces of both carbons in their H-form, the carbons were washed again with ~1% HCl solution followed by washing with deionized water until neutrality. The carbon samples were allowed to dry at 120℃ till constant weight was achieved. After cooling in a desiccator and grinding, carbon with a size range between two sieves of 1.19 mm and 0.25 mm was selected for characterization and adsorption experiments.
2.2. Physico-chemical characterization
The surface area of both carbons was determined using Autosorb-1 (Quantachrome Instruments, Boynton Beach, FL, USA) via nitrogen adsorption at 77 K. The carbon samples were tested using a JEOL/EO JSM 5600 scanning electron microscope (Tokyo, Japan) that was subjected to a 20 kV accelerating voltage. Energy dispersive X-ray (EDX) microanalysis of both carbons was carried out using a JEOL/O JSM 5600 editor energy disperse analysis system. X-ray powder diffraction was carried out using a Philips PW 1830 generator with a Philips PW 1050 powder goniometer (Philips, USA) and copper Kα was used as the incident radiation. An infrared analysis was carried out for DC and AC using a FT-IR spectrometer (Spectrun BX; PerkinElmer, Germany) after drying at 120℃ for 2 h. Zero point of charge (pHzpc) for both carbons was determined following the procedure of Moreno-Castilla et al. [7]. The base neutralization capacity for both carbons was determined using Boehm titrations [8]. Using standard methods, cation exchange capacity (CEC), apparent density, and ash content of both carbons were determined [9-11]. All experiments and analyses were carried out at least twice.
Pharmaceutical stock solutions (500 mg/L each) were kept in a refrigerator and used within a week after preparation. Test and standards solutions were prepared by dilution in deionized water. Kinetic, equilibrium, and column sorption experiments were carried out at initial pH values, at which maximum sorption of drugs took place. For the kinetic experiments, 0.15 g of DC or AC was added to 50 mL (50 mg/L) of LIS at initial pH 4.0 and 5.0, respectively, and at initial pH 9.0 for CP on both carbons. At different time intervals, aliquots of supernatant were withdrawn for drug analysis. The adsorption process was followed for 70 h at 25℃, 35℃, and 45℃ under continuous agitation (100 rpm/min). To investigate the effect of initial pH on drug adsorption, ~0.06 g carbon was mixed with 25 mL (100 mg/L) of drug solution in glass vials at different initial pH values (2.0–11.0). The initial pH was adjusted using drops of dilute HCl or NaOH prior to the addition of carbon. Under the same conditions of drug concentration and initial pH, reference drug samples were separated as control samples. Adsorption solutions were shaken mechanically (100 rpm/min) at 25℃ until the equilibrium was reached. Both the initial and the final drug concentrations were analyzed. Isotherm studies at different temperature (25℃–45℃) were carried out by mixing 0.06 g of carbon with 25 mL of drug solution (10–250) mg/L at respective initial pH values of maximum drug adsorption under mechanical shaking (100 rpm/min) until the equilibrium was reached. Residual drug concentrations were analyzed.
Drug solutions (250 mg/L, 100 mL) at initial pH of maximum drug adsorption, were mixed with carbons (0.25 g). After equilibrium, the drug samples were filtered and residual drug was analyzed. Wet drug-loaded carbon was carefully transferred to another clean vial containing 100 mL of aqueous solution at initial pH 2 for drug desorption. After 24 h, samples were withdrawn for drug analysis.
A fixed bed of the carbon adsorbent was prepared. A glass column with a glass wool layer at the bottom was used. The pre-weighed carbon samples were left in deionized water for 3 h for wetting. The column was filled with deionized water before adding the carbon mass and the column was gently tapped to facilitate uniform packing of the bed. For CP (pH 9, 51.5 mg/L), carbon samples (~1.50 g of DC or AC), after being wetted, were loaded in a column of 1 cm diameter, with length of 7.4 cm (bed volume, 5.8 cm3) for DC and length of 6.9 cm (bed volume, 5.43 cm3) for AC. The CP solution was allowed to pass through the column at a rate of 1.87 mL/min on DC remaining in contact with DC for 3.10 min and with AC for 2.90 min. For LIS (65 mg/L, pH 4 for DC; pH 5 for AC), carbon samples (1.8 g of DC or AC) were loaded in a column of 1 cm diameter, with length of 10.2 cm (bed volume, 8.01 cm3) for DC and length of 9.8 cm (bed volume, 7.69 cm3) for AC. The LIS solution was allowed to pass through the column at a rate of 1.87 mL/min staying in contact with DC for 4.28 min and AC for 4.11 min. Aliquots of the effluent solution were collected in a fraction collector (Frac-920; Sweden) and drug concentration was analyzed.
Drugs were analyzed using a tris(2,2-bipyridyl)-ruthenium (II) peroxydisulphate chemiluminescence system in a two chip device following the procedure of Al Lawati et al. [12]. The system consists of serpentine and teardrop microfluidic chips, fluidic connect 4515, and fused silica capillaries (Micronit, Enschede, the Netherlands). The syringe pumps were purchased from Basi Bee (USA). The detector was a photomultiplier tube (PMT; H7155-2; Hamamatsu Photonics, Hamamatsu, Japan) connected to a PC via a Counting Unit (C8855; Hamamatsu Photonics). The experiments and analysis were carried out at least twice.
3.1. Carbon physico-chemical properties
The surface properties of the carbons are presented in Table 1. The AC surface area is almost 134 times larger using the Brunauer-Emmett-Teller method and 139 times larger using the α-S method, relative to that of DC. In the α-S method, the amount of nitrogen adsorbed as a function of P/Po is graphically compared with a normalized reference isotherm of a non-porous carbon [13]. This method enables the estimation of the microsurface area and non-microsurface area. However, this method is influenced by the nature of the selected nonporous reference. The micro surface area, obtained using the α-S method, appears lower for both carbons (Table 1) than the non-micro surface area. In a previous study [6], for AC and DC prepared from date palm leaflets using sulfuric acid, surface area was higher for AC (405 m2/g) than DC (48 m2/g).
[Table 1.] Surface characterization of DC and AC
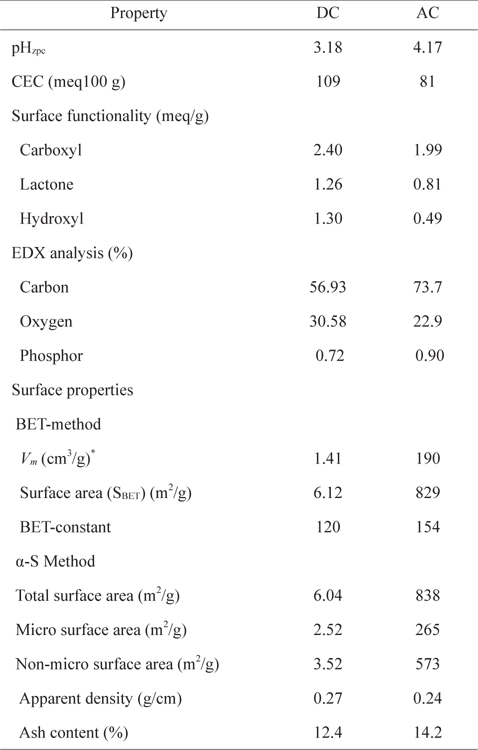
Surface characterization of DC and AC
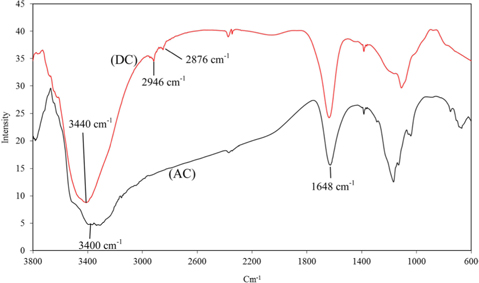
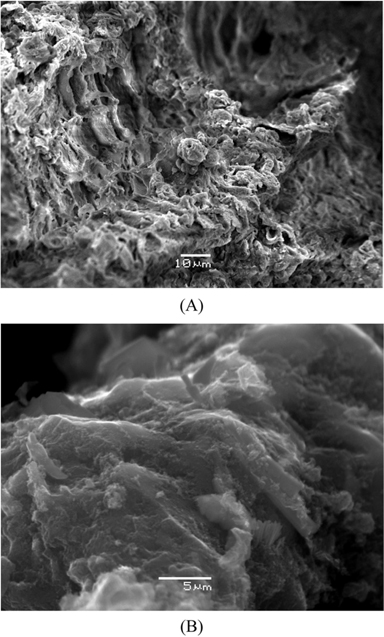
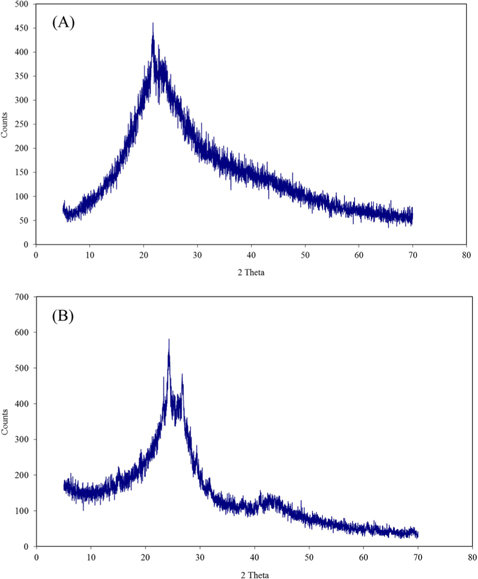
The apparent density and ash content are presented in Table 1. Scanning electron microscope photographs show that DC retains the fibrous structure of the leaflets while AC does not due to the pyrolysis at 500℃ (Fig. 1a and b). X-ray diffraction patterns for both carbons (Fig. 2a and b) show an amorphous structure with a common peak at 2θ of 22° for amorphous silica [14]. For AC, the two small peaks at 2θ of 26° and 44° represent the degree of graphitization [14]. Fig. 3 shows the infrared spectra of both carbons. The broad bands at 3440 cm–1 for DC and 3400 cm–1 for AC correspond to hydrogen bonded OH stretching vibrations [15]. Stretching C−H vibrations in CH3 and CH2 groups appear in the DC spectrum at 2946 and 2876 cm–1, respectively. However, such bands are not available in the AC spectrum, likely because they were lost during pyrolysis. The bands at 1648 cm–1 for both DC and AC correspond to stretching vibration of C=O, COO– or to skeletal C=C aromatic vibrations. Other bands in the range (1400–1000 cm−1) are assigned to O−H bending and C−O stretching vibrations such as phenols and carboxylic acids [15].
DC possesses more CEC, carboxylic, lactonic, phenolic, and surface acidity (or less pHzpc) than AC (Table 1). EDX analysis shows more carbon and less oxygen content for AC than DC, indicating the presence of more carbon-oxygen groups on the DC surface (Table 1). DC and AC formation can be explained as follows. When the mixture of date palm leaflets and phosphoric acid is heated at 150℃, some hydrolysis to hemicelluloses takes place. As water evaporates, phosphoric acid concentrates, leading to carbonization of the leaflets via dehydration of cellulose and hemicelluloses with partial oxidation and fragmentation of lignin. Concentrated phosphoric acid is capable of dehydrating plant material, but with a smaller oxidation effect than concentrated sulfuric acid [16]. The produced DC with residual phosphoric acid was subjected to pyrolysis at 500℃ under a nitrogen atmosphere, during which volatile, tarry, and waxy compounds are released. The release of tarry compounds from the gaps among crystallites by activation provides a porous structure with a high surface area of AC. Because phosphoric acid is an oxidizing agent, carbon oxygen functional groups such as carboxyls, lactones, and phenols are usually formed on the AC surface. The very low surface area of DC compared to that of AC is likely related to the higher content of carbon-oxygen hydrophilic functional groups on its surface. Such hydrophilic functional groups occupy a large fraction of the DC surface, restricting the adsorption of the non-polar nitrogen molecules. In addition, the presence of lignin material within the DC structure can also block the available pores and limit the access of nitrogen gas on the DC surface, thus decreasing the surface area.
3.2. pH effect on drug adsorption
pHzpc is the pH at which the electrical charge density on the carbon surface is zero. For the carbons, at pH values below the pHzpc (3.18 for DC and 4.17 for AC), the surface functional groups become protonated in their non-dissociated form; however, beyond that value, the carbon becomes negatively charged. The p
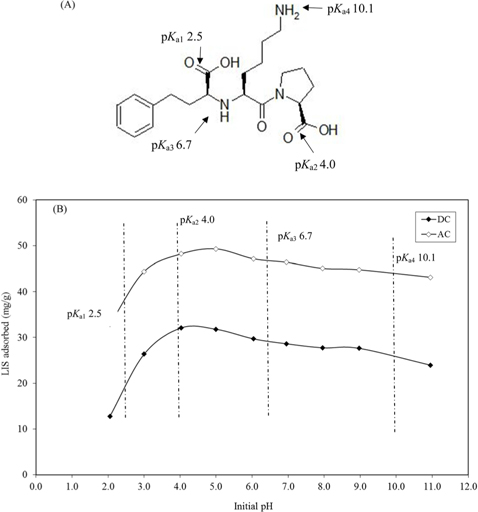
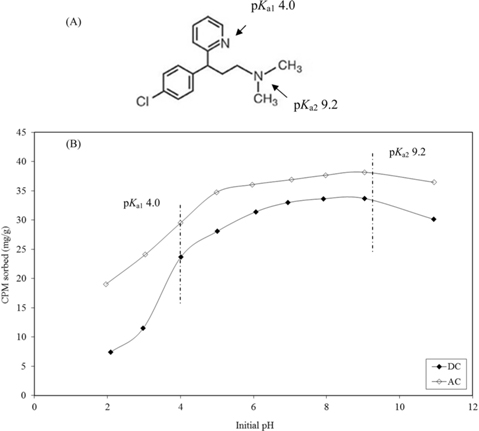
The effect of pH on adsorption of LIS is presented in Fig. 4b. At pH lower than the p
CP molecule (Fig. 5a) possesses two basic groups with p
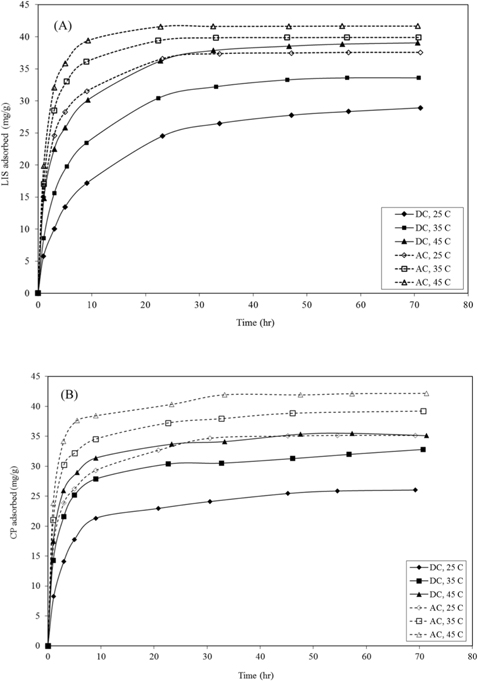
3.3. Kinetics of drug adsorption
From the studies of pH effect, initial pH 4.0 and 5.0 were selected as the optimum pH for LIS adsorption on DC and AC, respectively, while for CP, pH 9.0 was selected for both carbons for adsorption experiments. Equilibrium is reached faster for AC than DC for both drugs (Fig. 6). The adsorption of drugs varies almost linearly with the half power of time, in the adsorption early stages (eq 1) [19]:

where

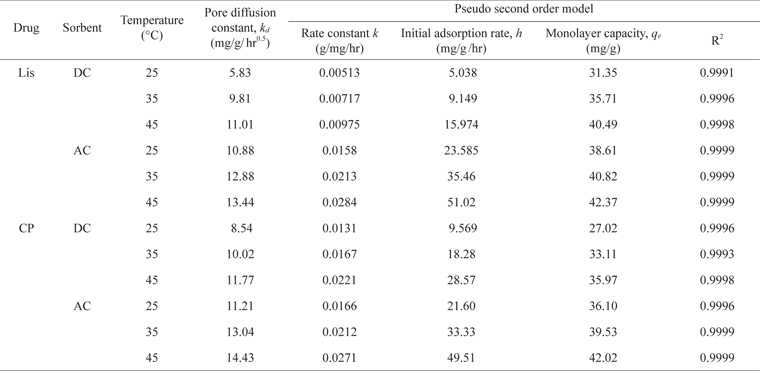
Pore diffusion and rate constants for the kinetics of LIS and CP sorption on DC and AC at different temperature

where
As presented in Table 2, the kinetic constants
For LIS adsorption, raising the temperature from 25℃ to 45℃ led to an increase in the values of
The activation energies (

where
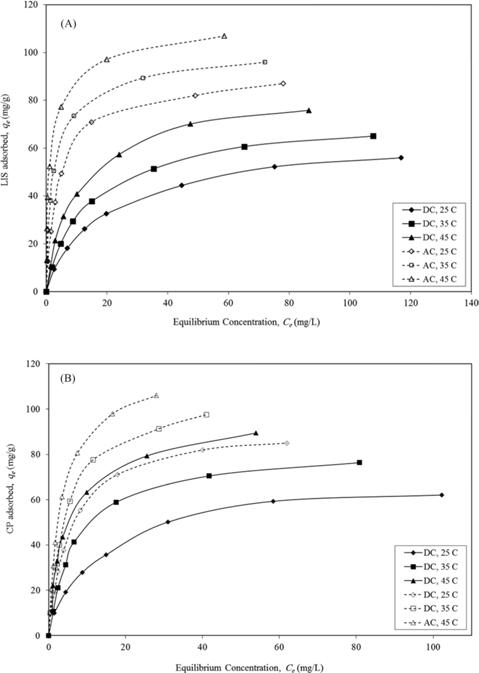
The adsorption data of LIS and CP on DC and AC presented in Fig. 7 follow an L-type isotherm, with increased drug uptake as temperature increases (25℃–45℃). The equilibrium data were tested using the Langmuir and Freundlich models (eqs 4 and 5, respectively).


where
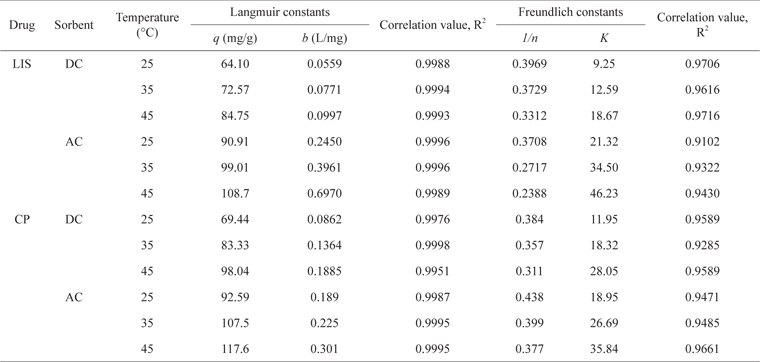
As presented in Table 3, the adsorption equilibrium data show better fitting for the Langmuir model than the Freundlich model for both drugs. The basic assumption of the Langmuir adsorption isotherm is monolayer coverage of the adsorbate onto the adsorbent surface active sites at equilibrium [24]. The increase in drug monolayer adsorption by raising the temperature is obvious and may be related to the desolvation of the adsorbing species and the decrease in the thickness of the boundary layer surrounding the carbon with increasing temperature [21]. Raising the temperature from 25℃ to 45℃ led to an increase in LIS monolayer adsorption by 1.32-fold on DC and 1.20-fold on AC, and in CP monolayer adsorption by 1.41-fold on DC and 1.27-fold on AC.

Langmuir and Freundlich parameters for the sorption of LIS and CP at different temperatures
The slight increase in drug adsorption on DC compared with AC by raising the temperature is likely due to the swelling of DC with greater temperature, leading to the development of wider pores and giving more access to adsorption sites. Similar results were obtained for the adsorption of ciprofloxacin antibiotic on DC prepared via sulfuric acid dehydration [2]. On the other hand, AC is a rigid material and its swelling in water or other solvents is unexpected [22]. CP shows higher uptake on both carbons than LIS and this is related to the smaller molecular size of the former. Even with its very low surface area, DC still shows effective LIS and CP adsorption in a range of 70%–78% and 75%–84%, respectively, of AC adsorption monolayer capacity for both drugs. This reflects the effectiveness of other adsorption forces such as ion exchange and H-bonding besides Van der Waals forces, which likely dominate drug adsorption on DC. The adsorption monolayer capacity of CP on AC and DC in this study (Table 3) is comparable to previous studies on rectorite (122 mg/g) [25] and montmorillonite (190 mg/g) [5].
Δ

where
[Table 4.] Thermodynamic parameters of LIS and CP adsorption on DC and AC
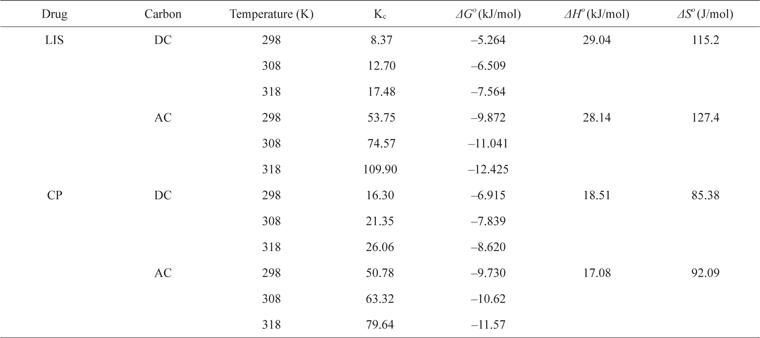
Thermodynamic parameters of LIS and CP adsorption on DC and AC


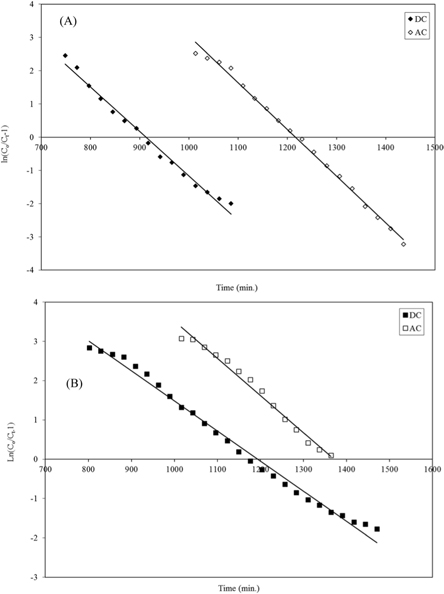
Plotting ln
Desorption from LIS loaded carbons is lower than that of CP, reaching ~63.3% from loaded DC and ~40.2% from loaded AC. On the other hand, desorption of CP from loaded DC shows ~81.8% recovery; however, for desorption from loaded AC, drug recovery is only ~61.6%. This indicates a stronger affinity of the carbon surface to LIS molecules than CP molecules. LIS molecule possesses multifunctional groups on its surface whereas CP molecule possesses a tertiary amine group and a pyridyl group (Fig. 5). It is clear that desorption from loaded DC shows better performance than that from AC. This is mainly related to the different dominating forces of adsorption onto both carbons. AC possesses a high extent of physical adsorption forces (van der Waals forces) due its higher surface area but smaller content of surface functional groups. DC possesses much lower surface area, indicating less van der Waals forces. However, DC possesses high content of surface functional groups such as COOH, OH, C=O, and C–O–C that act as active sites for drug adsorption involving other adsorption forces such as cation exchange and H-bonding. Thus, at pH 2, more release of LIS and CP molecules takes place from DC than from AC. In a previous study, desorption of ciprofloxacin from loaded DC was ~83% [2]. A previous study [28] concluded that desorption of organic adsorbates including pharmaceuticals from loaded ACs is limited due to the high affinity of such compounds to the AC surface.
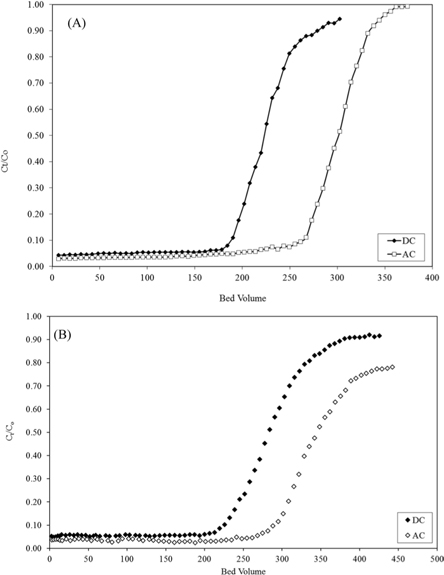
The initial concentration of CP used was ~50.0 mg/L, whereas that of LIS was 65 mg/L. Dynamic adsorption data are presented in Fig. 8a and b. LIS adsorption shows breakthrough curves at ~180 bed volumes with adsorption capacity (qexp) of 68 mg/g for DC and ~270 bed volumes with adsorption capacity of 91 mg/g for AC. CP shows a breakthrough at ~220 bed volumes on DC with adsorption capacity of 72 mg/g; however, for AC, the breakthrough appears at ~290 bed volumes with adsorption capacity of 89 mg/g. The dynamic adsorption capacity of both drugs correlates well with the monolayer capacities calculated from the Langmuir equations for both drugs on both carbon adsorbents (Table 3).
The Thomas model is frequently used to estimate the adsorption capacity and predict breakthrough curves. The breakthrough column data were processed using the Thomas Model [29]. The model assumes a negligible axial and radial dispersion in the fixed bed column with the adsorption data following pseudo second-order reaction kinetics and the Langmuir isotherm at equilibrium [30]. The model is useful in estimating the adsorption process, in which external and internal diffusion resistances are negligible [31]. The Thomas model can be expressed as follows (eq 9):

where
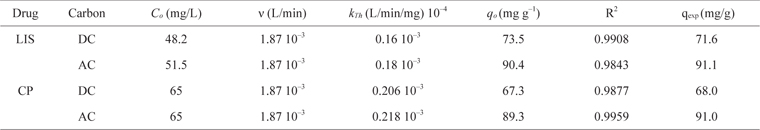
Thomas model parameters at different conditions for the adsorption of LIS and CP on DC and AC using linear regression analysis
AC prepared in this study shows high surface area and low content of surface functional groups, in contrast with DC, which possesses much lower surface area with high content of carbon-oxygen surface groups. Despite its very low surface area, DC shows effective drug removal from aqueous solutions, reaching ~70% of the removal capacity of AC. This reflects that the highly loaded carbon-oxygen groups on DC serve as active sites for LIS adsorption via ion exchange and hydrogen bonding. Drug adsorption follows the pseudo second order kinetic model and Langmuir at equilibrium. In addition, dynamic adsorption of drugs follows the Thomas model well. DC and AC from date palm leaflets are effective in drug removal from aqueous solutions.