Most notably, the problem of atmospheric contamination has been worsened due to the increase in motor vehicles, extension of new roads, enhanced consumption of fossil fuels and industrial activities. The traffic, especially, is without doubt one of the most dominant sources of particles. The environmental significance of particulate matter (PM) as the carrier of many trace elements (e.g., As, Be, Cd, Cr, Cu, Hg, Mn, Ni, Pb, Sb, Se, V, and Zn) has been recognized to a large extent [1,2]. PM with an aerodynamic diameter equivalent to or less than 2.5 μm (PM2.5) can be deposited in the lower respiratory tract, because of its ability to penetrate upper airways of the human respiratory tract. It is well known that the health effects of aerosol particles are significantly correlated with their quantities in the fine fraction. Deeply deposited PM2.5 is removed very slowly with a greater chance of damaging healthy cells [3,4]. Quantitative information on PM2.5 can provide valuable information on diverse types of respiratory health risks [5,6].
An analytical method aiming to determine the trace elements in airborne particulate samples should be sensitive and precise to quantitatively describe the diversity of elements. Hence, the use of ICP-MS techniques?such as collision cell technology-inductively coupled plasma mass spectrometry (CCT-ICP-MS), dynamic reaction cell-ICP-MS (DRC-ICP-MS), high resolution sector field-ICP-MS (HR-ICP-MS), etc.?is ideal for such a purpose. As the method can prevent polyatomic spectral interferences generated by plasma gas (Ar), matrix components, and solvent acid [7-10], it can be used as an incisive tool for the accurate quantification of toxic trace metals. In several studies, including those of Hassan et al. [11], Alsenz et al. [12], Soriano et al. [13], and Diaz et al. [14], various hyphened-ICP-MS have been used in estimating a distribution of chemical components for environmental samples (e.g., air particulate, coal fly ash, soil, and water).
In this study, airborne PM2.5 samples were collected from a roadside sampling station in Daejeon, Korea. The city is located approximately 160 km southwest of Seoul, the capital of South Korea. It has been growing rapidly with a population of approximately 1.5 million and 0.5 million vehicles. CCT-ICP-MS was applied to determine the concentrations of 19 elements (Al, As, Ba, Ca, Cd, Cr, Cu, Fe, K, Mg, Mn, Ni, Pb, Sb, Se, Si, Ti, V, and Zn). Based on the elemental measurement data, it was attempted to elucidate the elemental distribution characteristics of fine ambient particles (PM2.5), and also to examine the inter-element relationships. Finally, the relationship between PM2.5 and toxic trace or earth crustal elements at the study site was investigated.
2.1. Site Characteristics and Sampling
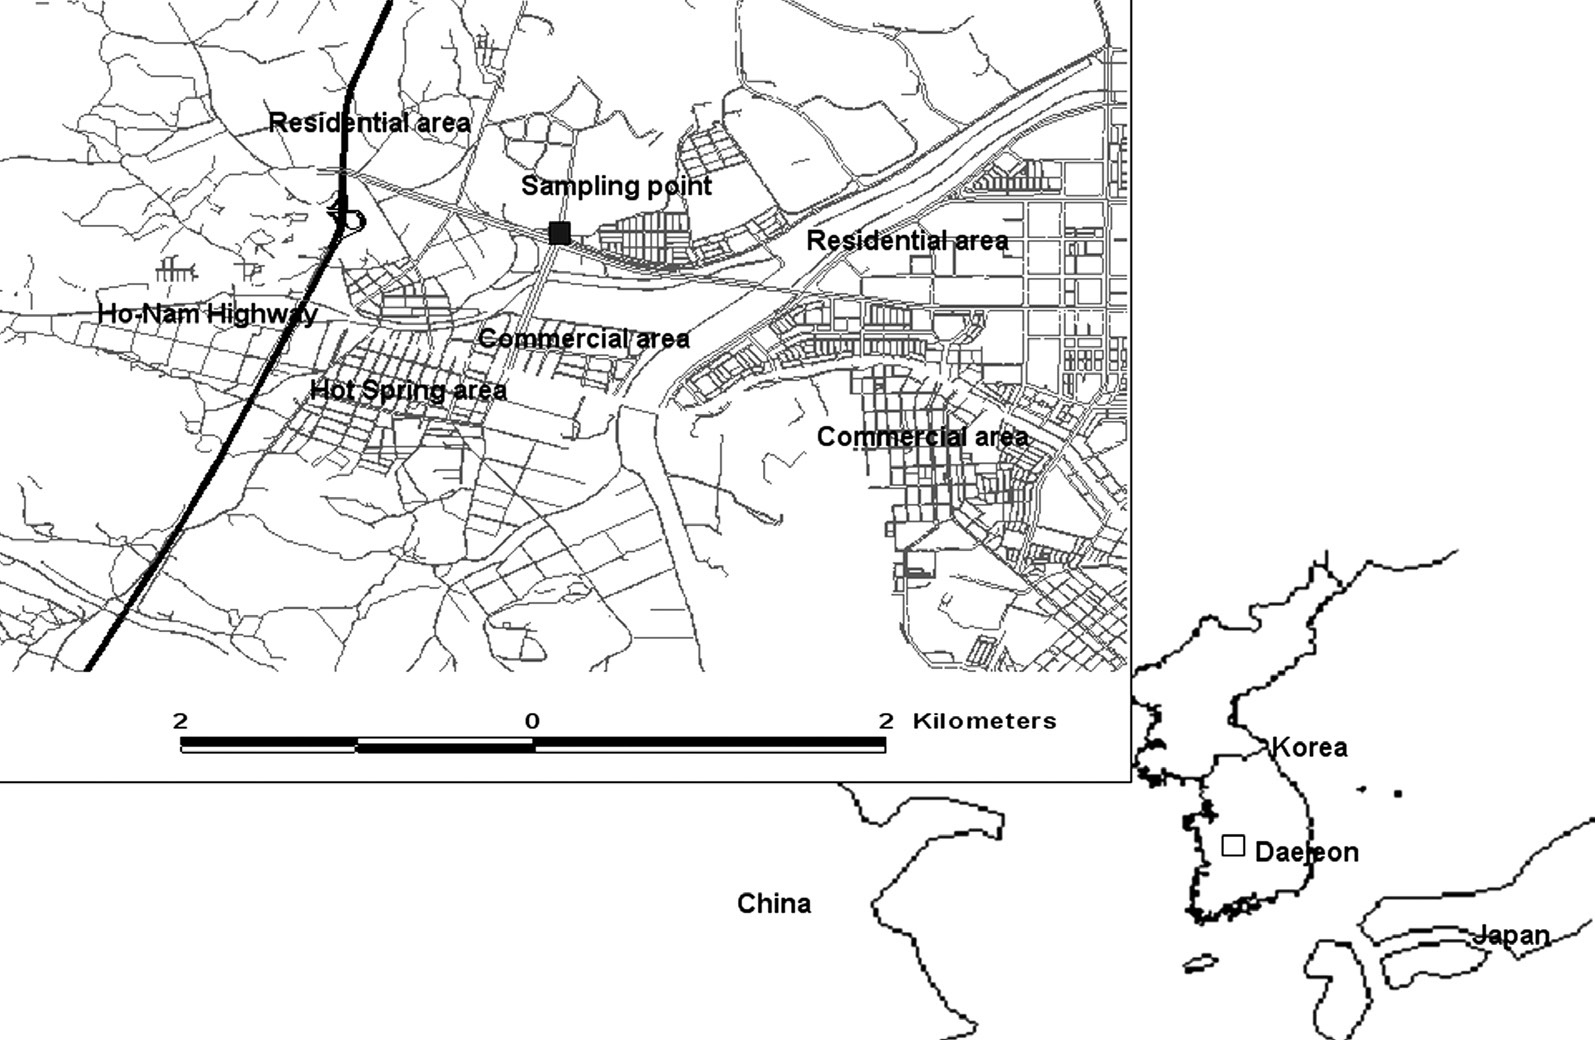
The collection of PM2.5 samples was made at the roadside sampling station located in Gung-dong district of Daejeon (Fig. 1). The sampling site is located several kilometers from the heavy-traffic intersection of the four-lane Honam highway and Yusung hot spring region. In front of the sampling site there are two main roads with ten-lanes crossing each other. Hence, if one considers the geographic location of our study site on an aerial scale, the site can represent one of the strongest traffic-related pollution sources in the city. For the collection of airborne particulates, an annular denuder air sampler (URG-3000C; URG Corp., Chapel Hill, NC, USA) was equipped with a polycarbonate membrane filter (0.4 μm pore size; Whatman, Maidstone, Kent, UK). A total of 60 PM2.5 samples were collected equally in the summer and fall season in 2006 (28 June?13 October). Air flow rate for the sampler was adjusted to 16.7 L/min at the beginning of sampling, and the sampler was operated continuously on a 24-hr basis. Each filter was conditioned and then weighed in a controlled atmosphere (20℃ and 50% relative humidity) for 24- hr both before and after exposure for air sampling. These filters were weighed three times with a pre-calibrated and zeroed microbalance with a readability of 1 μg (MT5; Mettler-Toledo Inc., Columbus, OH, USA). Electrostatic charges were controlled by a 210Po radioactive source.
The PM2.5-bound concentrations of Al, As, Ba, Ca, Cd, Cr, Cu, Fe, K, Mg, Mn, Ni, Pb, Sb, Se, Si, Ti, V, and Zn were determined on a CCT-ICP-MS (Thermo Elemental X7 with hexapole collision cell; Thermo Scientific, Waltham, MA, USA). Sampled filters were decomposed by the microwave digestion method (MLS-Mega; Milestone Inc., Monroe, CT, USA) with 5 mL high purity HNO3 (Suprapur 65%; Merck Milipore, Darmstadt, Germany). All the extracts were brought into a final weight of 40 g in a polyethylene bottle using 1% pure HNO3 solution. The instrumental conditions were basically similar to those reported by the manufacture’s guide (Table 1). The results obtained by the standard calibration curve method were generally in line with those obtained by the standard addition method (
[Table 1.] Analytical condition of CCT-ICP-MS
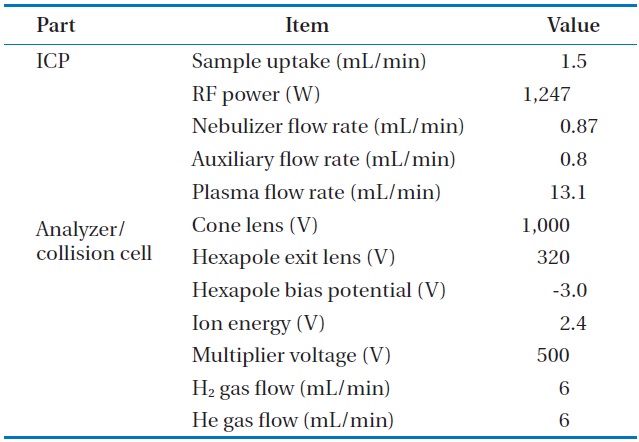
Analytical condition of CCT-ICP-MS
3.1. Analytical Quality Control
The quality assurance (QA) for a standardized analytical method is absolutely essential. Standard reference material (SRM 2783, air particulate on filter media) of the National Institute of Standards and Technology (NIST) was used for the QA purpose for our elemental analysis. The elemental concentrations were compared statistically with the certified (or recommended)
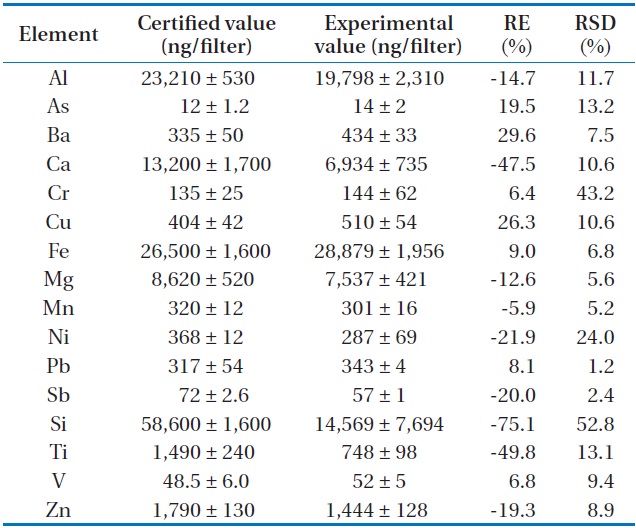
Relative errors (REs) and relative standard deviations (RSDs) for elements determined using CCT-ICP-MS in this study
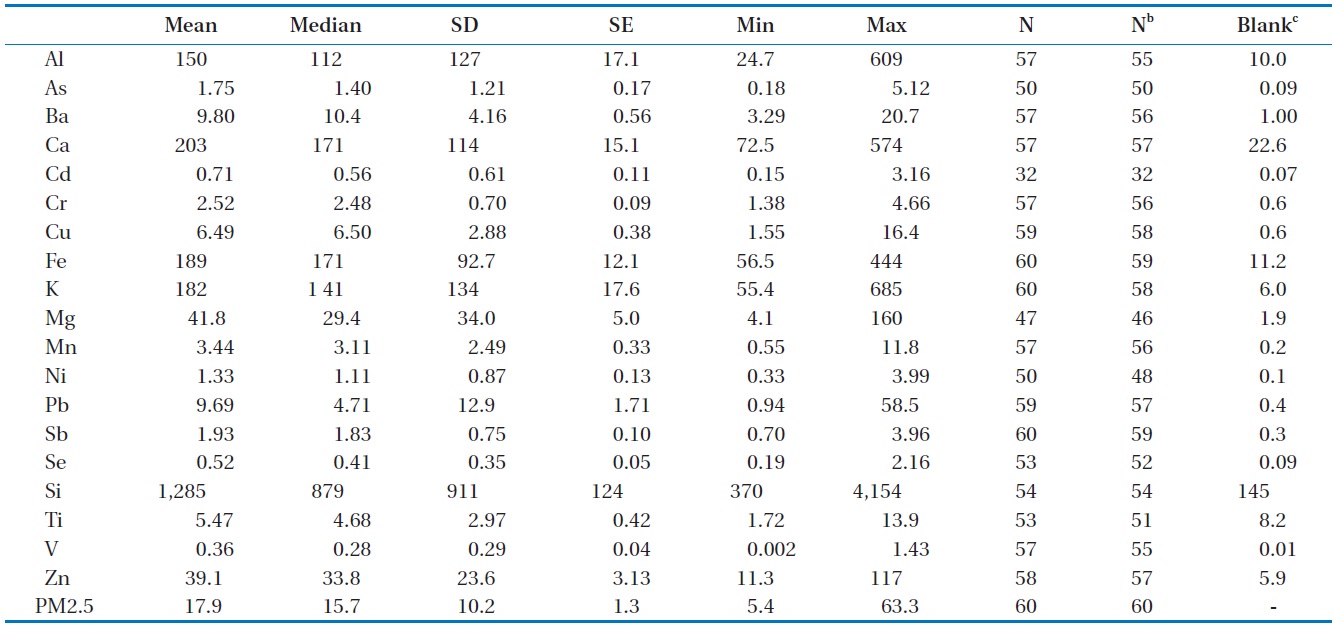
A statistical summary of the elemental concentrations of PM2.5 samples collected in a roadside area in Daejeon (ng/m3)a
values (Table 2). The deviation between the two values generally fell below 30% for many species (Al, As, Ba, Cr, Cu, Fe, Mg, Mn, Ni, Pb, Sb, V, and Zn) except Ca, Si, and Ti. Repetitive analyzes (≥ 5 times) of a given element yielded relative standard deviations below 20% except for Cr (43.2%), Ni (24%), and Si (52.8%). As such, the analytical results derived for most elements were fairly reliable.
3.2. Mass Concentrations of PM2.5 and the Associated Elements
To constrain uncertainties involved in our measurements, some outlying data sets were eliminated prior to statistical analysis via two different screening steps. As a first step, 7.2% of the data sets were removed by the signal-to-noise (S/N) ratio criterion of less than 2. Considering the diverse detection characteristics of the target elements in the laboratory analysis, the net concentration data (signal) close to the analytical blank (noise) are subject to higher uncertainty. Hence, we arbitrarily selected a factor of 2 for sorting out more outliers (OLs) to consider such an effect. The discarded data were excluded for evaluation of descriptive statistics. However, these data were replaced with half the value of their analytical blank values for evaluation of the enrichment factor and correlation coefficient. The analytical blanks of target elements were also presented in Table 3. The contents of the analytical blanks for target metals were less than 9% of samples’ average content.
Following the initial screening, the data sets with values exceeding ±3 SD from the mean were also excluded to rule out the possibility that the distribution patterns of certain elements are distorted by the presence of a few extreme values [15]. The data were inspected to determine whether the outliers originate from natural events (e.g., Asian dust). These cases can be sorted by the time trends of data occurrences. To exclude unexpected analytical errors, only data with large deviation without specific reasons (e.g., analytical mistakes) were eliminated. Loss of data was about 2.1% after this secondary stage screening.
A summary of the PM2.5 and elemental concentrations measured during the whole study period is presented in Table 3. The mean concentration of PM2.5 was 17.9 ± 10.2 μg/m3 with a range of 5.4 to 63.3 μg/m3. To generally evaluate the status of pollution, the PM2.5 concentrations measured in this study were compared with the World Health Organization (WHO)’s guidelines [16]. The mean concentration of PM2.5 at the study site exceeded the WHO’s annual guideline (10 μg/m3). Approximately 18% of the daily PM2.5 concentrations were higher than the WHO’s daily guideline (25 μg/m3). The mean concentrations for each element were also compared on a logarithmic scale. Based on a simple comparison of the magnitude, all elements can be grouped into five different categories: 1) <100 ng/m3: V, Se, and Cd ; 2) <101 ng/m3: Ni, As, Sb, Cr, Mn, Ti, Cu, Pb, and Ba; 3) <102 ng/m3: Zn and Mg; 4) <103 ng/m3: Al, K, Fe, and Ca; and 5) <104 ng/m3: Si. The summed mass of the 19 elements determined in this study accounted for about 13.7% of the PM2.5 mass. It was found that the concentration of elements (such as Al, Fe, K, and Si) associated with earth crustal sources were much higher than that of any other toxic element.
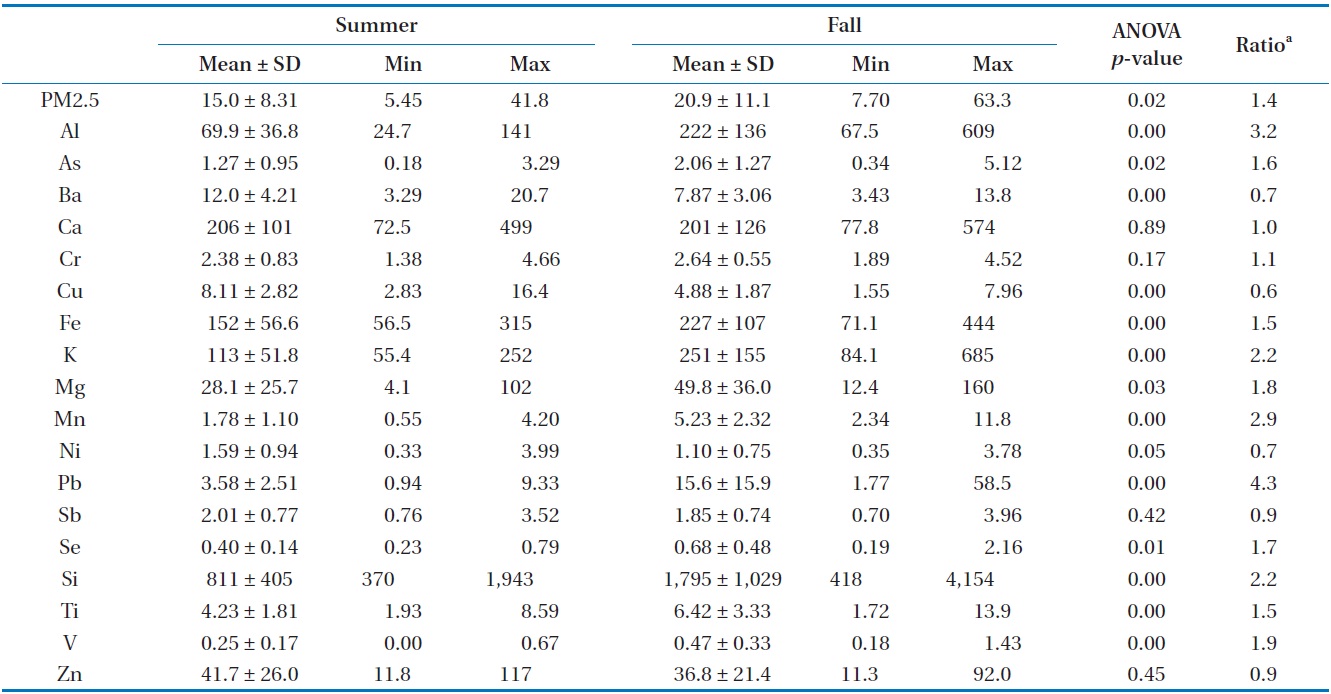
In order to evaluate the seasonal difference in concentrations of the elements and PM2.5, we conducted an analysis of variance (ANOVA) using our measurement data (Table 4). ANOVA is a statistical technique to test the difference between the population group means with respect to a single response variable. The statistical summary on seasonal basis and mean concentration ratio (fall/summer) was also presented in Table 4. As shown in Table 4, PM2.5 levels in the fall season (20.9 ± 11.1 μg/m3) were noticeably higher than in summer (15.0 ± 8.31 μg/m3). Seasonal differences (
[Table 4.] Results of ANOVA for seasonal difference of the PM2.5 and elemental concentrations

Results of ANOVA for seasonal difference of the PM2.5 and elemental concentrations
ratio revealed that the concentrations of most crustal elements are higher in the fall than in summer season. In contrast, the concentration ratios of Ba, Cu, Ni, Sb, and Zn were smaller than unity.
3.3. Enrichment Factor Analysis
As described previously, the study site for the present research is placed on the roadside with heavy traffic volume. It is also suspected that the site may be affected by the burning of fossil fuels from a hot spring region. The matter of the earth’s crust (and the sea salts) can be significant contributors to the determination of the aerosol composition near the earth’s surface. Comparison of aerosol compositions in relation with crustal composition can help discriminate the contribution of manmade source processes. The concept of enrichment factor (EF) is based on the fact that elements originating from relatively welldefined sources?such as Fe (or Al) mainly originating from the earth’s crust?can be distinguished from other elements derived by different source processes [17]. Hence, by comparing the Febased, relative concentration ratio, one can evaluate the extent of enrichment for a given element such as:
EF = {X/Fe}sample/{X/Fe}crust
where X denotes an element of interest.
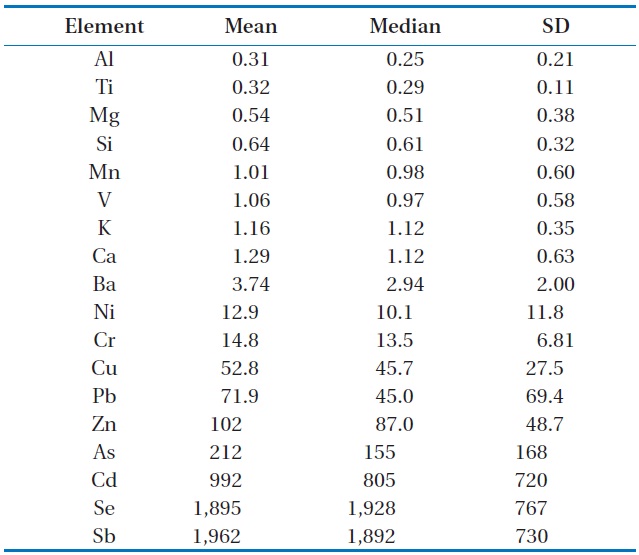
In this study, iron was used as the crustal reference for the derivation of enrichment factor. This is because its quantitative analysis was more reliable than others, while the pollution sources were relatively scarce. Results of EF computation are presented in Table 5. The EF value of a trace element is associated with some degree of uncertainty related to the natural variation of the crustal composition. This is the reason why the EF value should be more than an order of magnitude higher than unity to inform anthropogenic origin. Thus, if the basis for enrichment is set as the EF value of more than 50, we can sort out such elements as Sb, Se, Cd, As, Zn, Pb, and Cu to be enriched in PM2.5 samples of our study site. It is noteworthy that those elements are the major components of anthropogenic input. Their EF values were quite contrasting with those of major (Al, Ca, K, Ti, and Si) crustal components.
[Table 5.] Crustal enrichment factor values for elements at a roadside area in Daejeon

Crustal enrichment factor values for elements at a roadside area in Daejeon
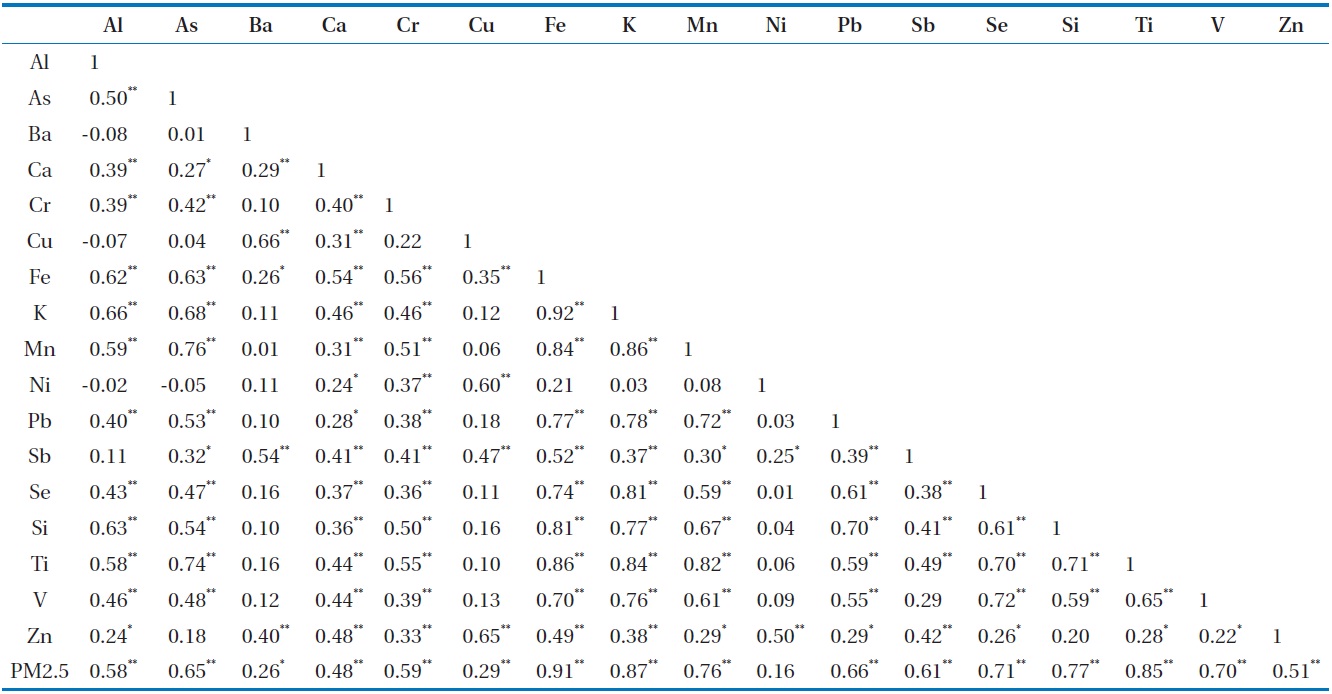
[Table 6.] Results of correlation analysis between different elements

Results of correlation analysis between different elements
Most of those crustal elements consistently exhibited low EF values of less than 5. Consequently, when judged from the computed EF values, the cases with pronounced enrichment of elements are rather confined to a number of elements with anthropogenic origin including vehicular emissions and fossil fuel combustion.
Table 6 presents the results of the correlation analysis between different elements. The results of the correlation analysis indicate that PM2.5 exhibits strong correlations with most of elements of no enrichment such as Fe (0.91), K (0.87), Ti (0.85), and Si (0.77). However, relatively weak correlations were observed between PM2.5 and elements enriched such as As (0.65), Cr (0.59), Pb (0.66), Sb (0.61), Se (0.71), V (0.70), and Zn (0.51). Most importantly, PM2.5 concentrations exhibit more enhanced correlations with the major crustal elements. This finding means that the PM2.5 concentrations near the roadside area are mainly affected by resuspended road dust that has been previously deposited on roads. The marker species for this source commonly included C, Cu, Pb, Sb, and Zn with maker species of soil dust (e.g., Al, Fe, K, Si, Ti, etc.). Since the elements from the specific source have relatively strong relationships, the results of the correlation analysis between elements could be helpful to identify potential emission sources of air particulate matter. As shown in Table 6, correlation coefficients of the crustal elements such as Al, Fe, K, Mn, Si, and Ti were relatively higher between each other. Similarly, those of elements originated from the abrasion of tires and brake linings and used oils (e.g., Cu, Ni, Sb, and Zn) in vehicles, and from heating fuel (e.g., Se, Ti, and V), were also relatively higher between each other.
To examine the distribution characteristics of elements at a moderately polluted urban area of Korea, we undertook the measurements of about 20 elements in airborne PM2.5 samples that were collected from a roadside sampling station in Daejeon using CCT-ICP-MS. Standard reference material (SRM 2783, air particulate on filter media) of the NIST was used for the QA purpose in regard to out our elemental analysis. The elemental concentrations were compared statistically with the certified (or recommended) values. The relative error between the two values generally fell below 30% for many species (Al, As, Ba, Cr, Cu, Fe, Mg, Mn, Ni, Pb, Sb, V, and Zn) except Ca, Si, and Ti. Repetitive analyzes (≥5 times) of a given element yielded relative standard deviations below 20% except Cr (43.2%), Ni (24%), and Si (52.8%).
The patterns of distribution were clearly distinguished between elements with their concentrations ranging over four orders of magnitude. The means for V and Se were found to be the lowest at values of 0.36 and 0.52 ng/m3, while those for Si and Fe showed the highest value of 1,285 and 189 ng/m3, respectively. Using enrichment factor analysis, we were able to distinguish such elements as Sb, Se, Cd, As, Zn, Pb, and Cu to be much more enriched in PM2.5 samples of the study site. It is noted that those elements are the major components of anthropogenic origin. The results of correlation analysis showed that PM2.5 concentrations can exhibit more enhanced correlations with the major crustal elements. The findings of strong correlations between PM2.5 and major crustal elements may be directly compatible with the dominant role of those species by constituting a major fraction of even PM2.5 as well as PM10 at the roadside area.