Fly ash is a by-product produced by the combustion of coal and heavy/crude oil as a fuel in power production plants. Coal fly ash can be categorized into two distinct classes, i.e., F and C. Class F fly ash is produced as a result of burning anthracite or sometimes bituminous coal. On the other hand, class C fly ash is produced by burning sub-bituminous coal or lignite [1]. This classification is based on the sum of the major oxides present in the fly ash, such as silicon dioxide (SiO2), ferric oxide (Fe2O3) and aluminum oxide (Al2O3). In class F fly ash, these oxides represent more than 70% of the product, while in class C they represent about 50%. However, fly ash produced from heavy or crude oil consists of similar oxides than those of coal fly ash, but at smaller concentrations. Burning heavy or crude fuel oil yields around 3 kg of ash per kiloliter of oil [2,3]. The majority is unburned carbon, which can make up more than 80% of the ash [4]. In some cases, this carbon quantity can reach to above 90%. In addition, fly ash contains other metals, like vanadium (V), nickel (Ni), copper (Cu), arsenic (As), cadmium (Cd), and mercury (Hg) [4,5].
Several reports have focused on the analysis of carbon rich fly ash [3,6]. For example, Hsieh and Tsai [3] have reported on the physical and chemical analyses of unburned carbon from oil-fired fly ash. They found that the major chemical composition is carbon with a percentage in the 73%–91% range. Other studies have focused on the environmental effects of fly ash. These studies have tried to utilize fly ash in order to reduce the amount that is land filled, potentially causing serious environmental challenges [7-12]. A few studies have suggested the use of coal fly ash as a catalyst in the synthesis of carbon nanotubes (CNTs), as adopted by Yasui et al. [13]. Another group has suggested impregnating coal fly ash with iron nitrite for use as a substrate to produce CNTs [14]. Nath and Sahajwalla [15] have reported on the application of fly ash as a catalyst for the synthesis of CNT ribbons. Silvestre-Albero and Rodríguez-Reinoso [16] have reported on the use of carbon materials for the adsorption of CO2 due to the presence of a large pore volume, high surface area and a rich surface chemistry.
However, no efforts have been made to produce nanostructures from the unburned carbon in crude oil fly ash. As mentioned above, the amount of carbon in the fly ash can reach up to 90% [4,5]. These carbon atoms mostly exist in the form of graphite-like sp2 and diamond-like sp3 hybridization states [17].
Ultrasound waves have been reported to be effective in transforming graphite into diamonds [18] by transforming sp2 - hybridized carbons into the sp3 state. Moreover, it has been reported that the incomplete combustion of rich-carbon materials also leaves hydrocarbon compounds [19]. Hydrocarbons can be released by ultrasound waves and are easily decomposed inside a tube furnace at elevated temperature to provide sp2-hybridized carbons.
The catalysts that are needed for CNTs growth also naturally exist in the carbon rich fly ash. These include Fe2O3, SiO2, and Al2O3 [4]. Iron is a well-known metal catalyst for CNTs growth [20,21], while silicon and aluminum oxides have also been found to be catalyst-supporting materials [22-24]. Recently, Salah et al. [25] released the catalysts present in the carbon rich fly ash and used them to grow nanotubes. This author has also reported on the production of CNTs using ultrasonicated carbon rich fly ash as a precursor and catalyst [26]. These results encouraged us to further investigate other properties of carbon rich fly ash, in order to explore the possibility of producing more defined nanostructures.
In the present work, the effect of sonication time on the morphology, optical and structural properties of carbon rich fly ash is reported. Carbon nanoparticles (CNPs) were also produced from this fly ash in parallel, using the ball milling technique. These CNPs were evaluated as reinforcements for epoxy based composites at a weight fraction ratio of 0.5 wt%. Some mechanical parameters were evaluated for the formed nanocomposite. The samples were characterized by scanning electron microscope (SEM), energy dispersive spectroscopy (EDS), X-ray diffraction (XRD), UV–visible absorption spectra, Raman spectroscopy, and X-ray photoelectron spectroscopy (XPS).
The results showed that ultrasound treatment is an effective tool for reducing the particle size of the fly ash, with a significant increase in the UV–visible absorption. The CNPs of fly ash were found to have strong C=O bonds of the carbonyl group, while the tensile testing results of the epoxy resin reinforced with the CNPs showed a significant improvement in the stiffness of this polymer. These CNPs and fly ash fragments might be useful for various applications including fillers in composites, additives in lubricant oil, gas adsorption, and etc.
In this experiment, carbon rich fly ash was obtained from a water desalination plant in Jeddah, Saudi Arabia. Four samples from this ash were sonicated for different amounts of time. They were sonicated for 15 min, 45 min, 2 h, and 6 h using a probe Sonicator model UIP500 HDT generator (Hielscher Ultrasound Technology, Teltow, Germany). It was operated at a power of around 100 W with a signal amplitude ~80%. Initially 5 g of this fly ash powder was dispersed in approximately 500 mL deionized water and kept in a beaker. Then the probe was immersed in the solution. After sonication for the desired time, the fly ash was dried at around 70℃ to attain powder samples.
The fly ash sample to be ground by ball milling was used as received without further modification. This sample was milled for 20 h in steel cells (250 mL) using hardened steel balls (diameter 15 mm, weight 32 g) in ambient atmosphere. The mechanical milling was performed in a horizontal oscillatory mill (PM 400; Retsch, Hann, Germany) operating at 25 Hz. The mixture ratio of steel balls and fly ash powders was around 15:1 by weight. The milled materials were used directly with no added milling media. Five balls were kept in each cell along with 10 g of the sample powder. The samples were dispersed in around 100 mL of water. After 10 min the ultrafine suspended particles were separated from the precipitated big particles and collected in a small beaker. Then, they were completely dried in an oven at 60℃ for 8 h.
The samples were characterized by a field emission scanning electron microscopy (FESEM), JSM-7500 F (JEOL, Tokyo, Japan) operated at 15 kV. The chemical compositions of the fly ash powder were analyzed by the EDS technique using Oxford EDS system attached with the FESEM. XRD was also conducted with an Ultima-IV (Rigaku, Tokyo, Japan) diffractometer (Cu Kα radiation λ = 1.5418 Å wavelength at 40 kV accelerating voltage and 30 mA current), using parallel beam geometry and a powder attachment. The fly ash sample was analyzed with UV–visible absorption spectra using the UV–visible spectrophotometer, model “UV-1650PC” (Shimadzu, Tokyo, Japan). Raman spectra were obtained using a DXR Raman Microscope, Thermo Scientific, using a 532 nm laser as the excitation source at 6 mW power. XPS measurements were carried out using PHI 5000 VersaProbe (Chigasaki, Japan) in the range of 275–290 eV. The samples were irradiated with a monochromatic Al Kα radiation (
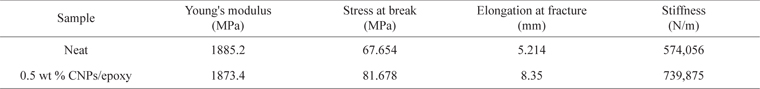
The nanocomposite samples were fabricated using sonication methodology for a weight fraction ratio of CNPs to epoxy resin of 0.5 wt%. The thermoset epoxy used in this work was obtained from R&G Faserverbundwerkstoffe GmbH (Waldenbuch, Germany). These were resin L385 and hardener 386, with a mixing ratio 100:30 by weight as recommended by the supplier. Initially CNPs were dispersed in 15 mL of ethanol and sonicated for 2 h. Then the ethanol-CNPs mixture was dissolved in the resin and mixed using a magnetic stirrer for 2 h. After that the hardener was added to the above mixture and stirred for 8 min. Finally, the mixture was poured in the mold and cured at room temperature for 24 h, followed by 2 h heating at 80℃. Five specimens were produced. The neat resin was prepared using the same procedure (including the addition of ethanol). The samples were tested using a tensile testing machine (LRX Plus Materials Testing Machine; Lloyd Instruments Ltd., Bognor Regis, UK) with a rate of 3 mm/min. The data given in Table 1 shows the average mechanical testing results of the nanocomposite samples.
[Table 1.] Mechanical properties of CNPs-epoxy composite
Mechanical properties of CNPs-epoxy composite
3.1. Morphology and chemical composition
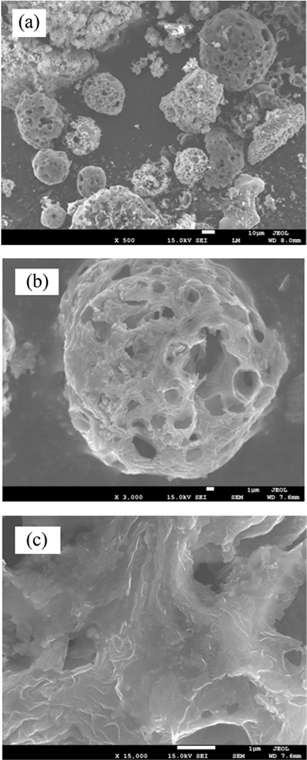
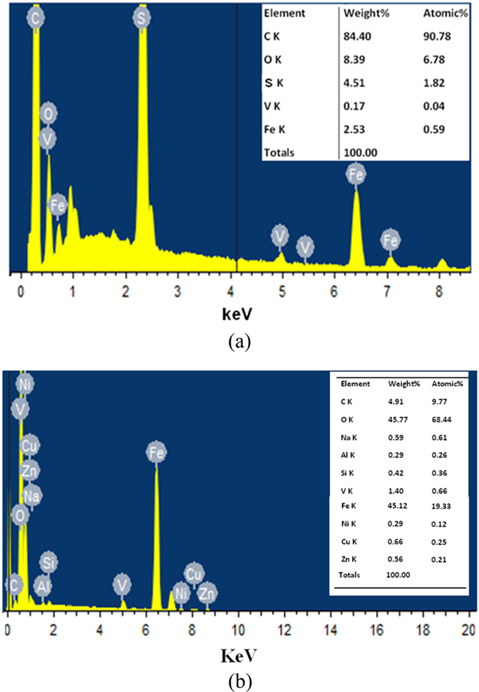
Fig. 1 shows SEM images at different magnifications (images a-c) of the carbon rich fly ash used in this work. These images display microsized particles/fragments with sizes in the range of 1–50 µm. They have a porous structure with an average pore size of around 3 µm. The EDS quantitative and qualitative analysis presented in Fig. 2a shows that pure carbon forms ~90% of this ash. The remaining composition is oxides, mainly of S, Fe, V etc. These oxides were clearly observed by removing a large amount of the carbon atoms. The later could be released by heating the fly ash in air at 750℃. The EDS result of the remaining oxide sample is shown in Fig. 2b. Several atomic elements can be observed at different concentrations. Iron was found to be the major part of these heated fly ash materials. These results are in agreement with those reported earlier on the analysis of carbon rich or heavy oil fly ash [3,6].
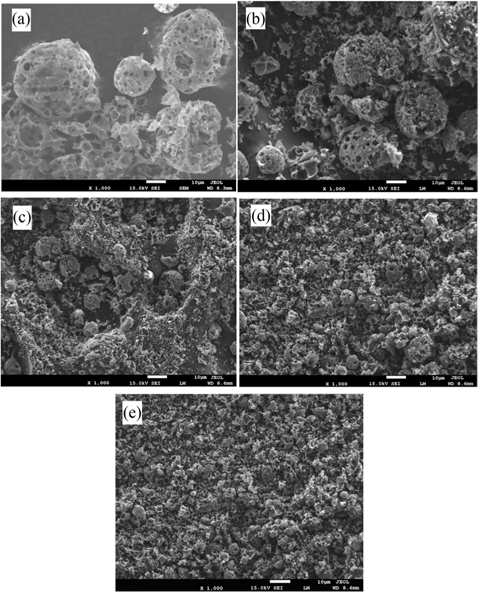
SEM images of the carbon rich fly ash that was untreated (a) and ultrasonically treated at 15 min (b), 45 min (c), 2h (d) and 6h (e) are presented in Fig. 3. The sizes of the ultrasonicated particles were systematically reduced to smaller ones as a function of sonication time in the 15 min–6 h range (images b-e). Small particles and fragments in the micro/submicro range can be seen after 6 h of sonication (e). Obtaining reduced size particles by just sonication is a remarkable result.
The fly ash particles sonicated for 6 h became ultrafine particles with a high porosity. The modified surface/morphology of the carbon rich fly ash particles might be utilized for various applications such as the adsorption of gasses. For example, hydrogen adsorption by carbon materials has been extensively studied for energy storage applications [27-30]. The amount of adsorbed hydrogen is proportional to the specific surface area and porosity of the particle surface. The specific requirements for hydrogen adsorption exist in the sonicated fly ash (Fig. 3e), which are limited in other carbon nanostructures like CNTs
Bulk carbon materials like fly ash or other carbon nanomaterials have limitations that make them inappropriate for the hydrogen adsorption application. That is mainly because fly ash has large sized particles (Fig. 1), which can reach up to 100 µm. Meanwhile, CNTs have no porosity on their surface. Therefore, ultrasonicated fly ash has the potential to be the model material for the adsorption of hydrogen or other gasses. Further study is required to test the adsorption capacity of such treated fly ash. In addition, activating this treated fly ash might provide improvement in its adsorbent properties.
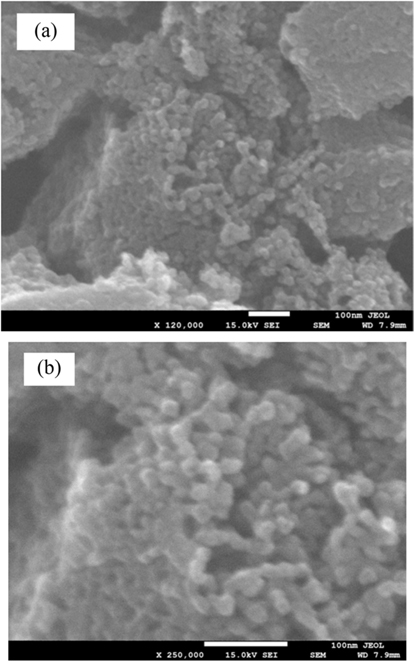
Fig. 4 shows SEM images fly ash particles at different magnifications after being ball milled for 20 h. Ultrafine nanoparticles with almost spherical shapes can be observed with sizes in the range of 20–30 nm. The use of high energy ball milling is a unique method for producing fine nanostructures of solid materials. The produced nanomaterials have no pore structure at the nanoscale, but they exist as big clusters. These clusters have microsized pores. It is well understood that milling is a process involving complex mechanical forces. These forces act equally on all sides of the particles and can form well-shaped nanoparticles due to the long milling time (20 h). However, these forces can be balanced by the material's resistance, to generate a homogenous particle size. In other words, a balance between the striking force causing friction on the particles, and the material resistance, is achieved at a particle size of around 20 nm. Similar results on obtaining ultrafine, well-shaped nanoparticles were also reported earlier [31].
3.4. Structural and optical properties
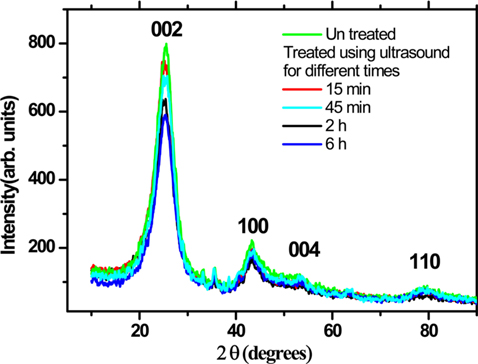
XRD patterns of the untreated and ultrasonically treated carbon rich fly ash is presented in Fig. 5. The XRD result shows several diffracted peaks with hkl values. The prominent diffraction peak at 2θ = 25.6° can be indexed as the C (002) reflection of the hexagonal graphite structure (JCPDS No. 01-0646). A slight shift in this angle of about 0.2° is observed in the sonicated samples, which might be due to a decrease in the order of graphite crystallinity. The other diffraction peaks, located at the angles 2θ of 44°, 53.5°, and 78° are due to the 100, 004, and 110 reflections. The ball milled sample shows similar results with a slight reduction in the peaks’ intensity, and a small broadening in the width of the diffracted peaks.
[Fig. 5.] X-ray diffraction pattern of the untreated and ultrasonically treated carbon rich fly ash.

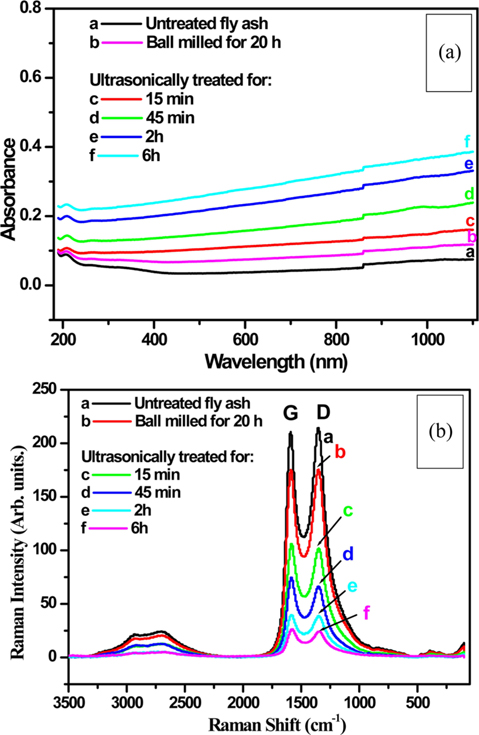
Fig. 6a shows the UV–visible absorption spectra of the untreated (curve a), ball milled for 20 h (curve b) and carbon rich fly ash ultrasonically treated for different times (curves c-f). Curve b of the ball milled sample shows slight increases in absorption compared to that of untreated fly ash (curve a). This absorption is further increased in the sonicated samples. It systematically increased with increasing sonication time, which might be correlated to the reduction in the particle size.
The absorption becomes more prominent in the near infrared ray (NIR) region, particularly in the sonicated samples. However, it is possible that the increase in absorption is not only due to the particle size; if it did, the ball milled sample, which has the smallest particles, would show the same trend, reaching maximum absorption. The observed outcome is most likely produced by a combination of reasons, including the presence of large amounts of small size pores on the surfaces of the sonicated fly ash samples. These pores might have increased the photon scattering/reflections, resulting in more absorption. This scattering or reflection might be higher in case of NIR photons, which have smaller energies than those of the visible or UV wavelengths, thus showing higher absorption in the NIR region.
Fig. 6b shows the Raman spectra of untreated (curve a), ball milled for 20 h (curve b) and carbon rich fly ash ultrasonically treated for different times (curves c-f). Graphite (G) and defect (D) bands can be observed at around 1585 and 1350 cm−1 [32,33] in all spectra. The presence of the G band indicates that the carbon exists in graphite form in the untreated fly ash (curve a). The nanoparticles of fly ash produced by the ball milling (curve b) have a similar spectrum, but with slight decreases in the intensity of the bands.
When the fly ash samples were sonicated for different times the graphite structure was drastically affected (curves c-f). The drop in intensity of the Raman signal for those samples indicates that a considerable amount of the graphite structures was destroyed by sonication. This result shows that ultrasonication is an effective tool for modifying material structures like graphite. In another study, Sim et al. [34] synthesized graphene layers using the ultrasonic dispersion of graphite flakes. Ultrasound treatment was used to study the decrease of the granulometry of graphite, due to the cavitation, which allows erosion by separating grains [35]. Belviso et al. [36] studied the effect of ultrasonic treatment on zeolite synthesized from coal fly ash. They reported that the application of ultrasonic treatment facilitates the formation of zeolites at a lower synthesis temperature (25℃) in comparison to samples not pre-processed by sonication. Krishnamoorthy et al. [37] have also reported on the ultrasound assisted synthesis of graphene nanosheets.
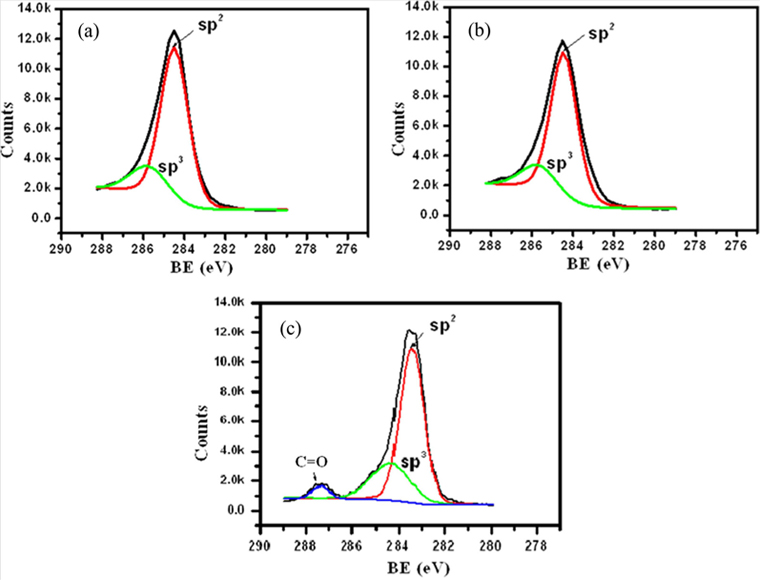
The typical XPS spectra of untreated (a), ultrasonically treated (b) and ball milled (c) carbon rich fly ash are presented in Fig. 7. The figure shows the peaks of sp2 and sp3 carbons [38]. The intensity ratio of sp2/sp3 carbons is found to decrease with increasing sonication time. It decreases from 3.28 to 3.22 eV after sonicating the fly ash samples for 6 h (Fig. 8). This is an indication of the conversion of a small part of sp2 into sp3 carbons.
In the case of fly ash nanoparticles (Fig. 7c) the intensity ratio of sp2/sp3 carbons was found to be around 3.4 eV with the emergence of another band at 287.4 eV. This band may be the double bonds of carbonyl groups [39], formed on the side wall of fly ash nanoparticles. This is a very significant result, showing that functional groups can be introduced without chemical treatment, perhaps due to the ball milling in air. These groups might be quite useful for an array of applications.
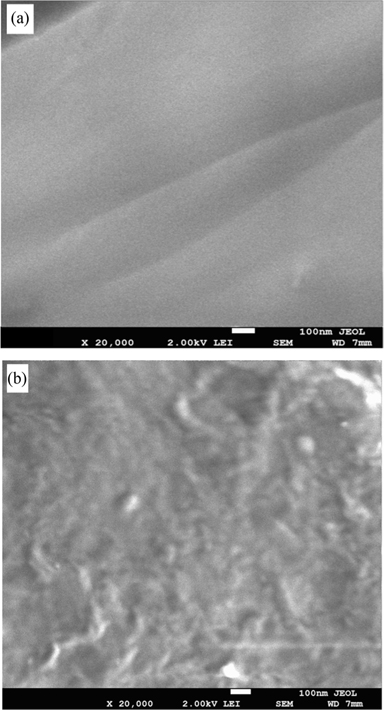
Fig. 8 shows SEM images of the as produced neat epoxy resin (a) and CNPs/epoxy composite at a fraction ratio of 0.5 wt% (b). Image (a) shows that the neat sample has a smooth surface, while the CNPs/epoxy specimen has a rough one, with the appearance of some CNPs close to the surface. An almost uniform distribution of CNPs within the matrix can be observed. This is a remarkable result, since the dispersion of nanostructures in the matrix is considered a critical challenge in nanocomposites. Most of the carbon nanostructures reported so far are supplied in heavily entangled bundles, and they have the tendency to self-associate into micro-scale aggregates [40]. Various researchers have reported that the enhancement of nanocomposites by adding carbon nanostructures might be limited due to difficulties in ensuring the uniform dispersion of the nanostructures, and the absence of excellent interfacial bonding between the nanostructures and polymer matrix. Thus, the present CNPs might be a good choice for composite applications, since they can be uniformly dispersed and have active carbonyl groups for better bonding with the host matrix.
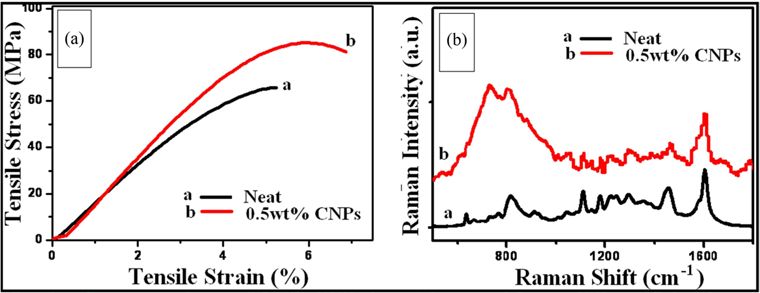
The mechanical properties of CNPs/epoxy nanocomposite are tabulated in Table 1. These properties include Young's modulus, stress at break, elongation at fracture and stiffness. After adding CNPs at a weight fraction ratio of 0.5 wt% to epoxy resin, no significant changes were observed in the Young’s modulus values. On the other hand, considerable increases in the values of the stress at break¸ elongation at fracture and stiffness were observed.
The stiffness value was increased by around 23% above that of the neat sample. It is remarkable to get a measurable improvement in these mechanical parameters. The improvements in these parameters might be due to the presence of CNPs and their active carbonyl groups. The graphitic structure of these fly ash materials in nano form is another factor contributing to this enhancement. As shown in the Raman spectra and XPS results (Figs. 6b and 7) sp2 carbons are the main part of carbon rich fly ash. It is well understood in the literature that sp2 carbon nanostructures like CNTs [20-24] and graphene [37,39] have unique mechanical properties. The value of the fraction ratio, i.e., 0.5 wt%, was chosen in the present study because this value was recommended as an optimum concentration by several authors, who used carbon nanostructures as fillers for polymer composites [41]. However, further work is needed, to explore other ratios and other chemical parameters.
The stress–strain curves of neat and CNPs/epoxy composites at a weight frication ratio 0.5 wt% are presented in Fig. 9a (curves a and b, respectively). The curve of the neat sample is quite similar to that reported in the literature on epoxy matrix [42,43]. It has no significant changes, and lacks an obvious yield point in the curve.
Curve b for the reinforced material is different from that of the pure epoxy matrix. The stress at break is more than 20% greater than that of pure epoxy. Moreover, the strain value and elongation at break are also higher than those of the neat sample. To explain these results, the Raman spectra of neat and CNPs/epoxy composites were recorded and are presented in Fig. 9b (curves a and b, respectively). Curve a in this figure shows the regular vibration bands of pure epoxy [44], while that of the CNPs/epoxy composite has one extra permanent band, induced at around 730 cm−1. This band may be created as a result of bonding between the carbonyl groups which exist in the CNPs (Fig. 7c) and the epoxy matrix, which then results in further enhancements of the mechanical properties of the CNPs/epoxy composite.
From the application point of view, adding a small percentage of CNPs to epoxy resin to improve the stiffness of the material by around 23% is a remarkable result. The fly ash is a waste and hazardous material as mentioned above, but the nanostructure form of this material can produce excellent results. Therefore, this study might offer a partial solution for composite applications using an alternative to CNTs and graphene, which are still very costly. However, these are still a preliminary results and further work is needed to investigate different parameters, such as different values for CNPs weight fractions, other mechanical parameters and synthesis processes, which will be addressed in future work.
The effect of sonication time on the morphology, optical and structural properties of carbon rich fly ash was demonstrated. The ultrasound treatment for this fly ash was found to be an effective tool for reducing the micro size fly ash into ultrafine particles/fragments, with higher porosity. Nanoparticles of fly ash were also synthesized using the ball milling technique and evaluated as reinforcements for epoxy resin. These nanoparticles were found to have the strong double C=O bonds of the carbonyl group. The mechanical tests of nanoparticles incorporated in the epoxy resin showed significant enhancements, mainly in the value of the stiffness of this polymer. However, further work is needed to investigate different parameters such as different values for CNPs weight fractions, other mechanical parameters and synthesis processes. Generally, these nanostructures and the high porosity fragments produced by sonication might be quite useful for other applications, like additives in lubricant oil, gas adsorption, and etc.