Seasoned laver is a unique seaweed product that is prepared by roasting a sheet of dried laver
In the preparation of seasoned laver, vegetable oils are used as the major ingredient (usually 30–40%, w/w) (Lee, 1999; Jo et al., 1995). Our previous study, thermal oxidative stability of six vegetable oils (sesame, perilla, sunflower, rice bran, canola, and olive) was investigated (Kim et al., 2015). In commercial seasoned laver products, a mixture of corn, sesame, and perilla oils is most frequently used. In particular, because it is inexpensive, the corn oil content of seasoned laver oils generally exceeds 80% (w/w).
The blending ratio of seasoned laver oils is usually decided on the basis of economical and sensory considerations. However, the effects of the blending ratio on the oxidative stability of seasoned laver oils have not yet been studied. During the processing of seasoned laver, UHT treatment at 300℃ induces the thermal oxidation of the oils (Jo et al., 1995). In addition, due to the high oil content of the seasoned laver, the thermal oxidative stability of the oil is the most important factor in determining the product’s shelf life (Wang et al., 2010; Hasenhuettl and Wan, 1992).
In this study, the effects of the blending ratio of corn, sesame, and perilla oils on the oxidation and sensory quality of seasoned laver were monitored and optimized using a response surface methodology (RSM). In addition, the variations in price with different blending ratios of seasoned laver oils were also monitored. The thermal oxidative stability of the oils was evaluated by determination of the oxidation induction time using a Rancimat instrument.
Corn (CJ Cheiljedang Co., Ltd., Seoul, Korea), sesame (Chamgoeul Co. Ltd., Seoul, Korea), and perilla (Chamgoeul Co., Ltd.) oils were purchased from a local market and stored in a refrigerator until their use in the experiment. Sheet-type dried laver (
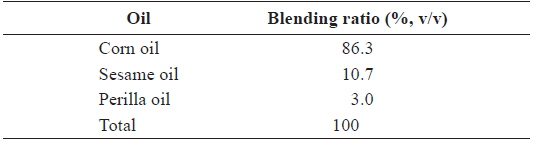
A central composite rotatable design (CCRD; Montgomery, 1996) was used to monitor the effects of the blending ratio of corn, sesame, and perilla oils on the oxidation and sensory quality of the seasoned laver. The oil blending ratio (v/v) at the center point was: corn 86.3 %, sesame 10.7 %, and perilla 3.0%. The center point was based on the average blending ratio of the commercial seasoned laver in Korean market (Table 1). Two independent variables (
X1 = corn oil / (sesame oil + perilla oil) = 6.33 X2 = sesame oil / perilla oil = 3.60
[Table 1.] Blending ratio of corn, sesame, and perilla oils at the center point

Blending ratio of corn, sesame, and perilla oils at the center point
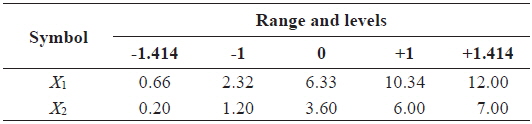
Experimental range and values of the independent variables in the central composite rotatable design for the optimization of blending ratio of corn oil, sesame oil, and perilla oil
The oxidation induction time (
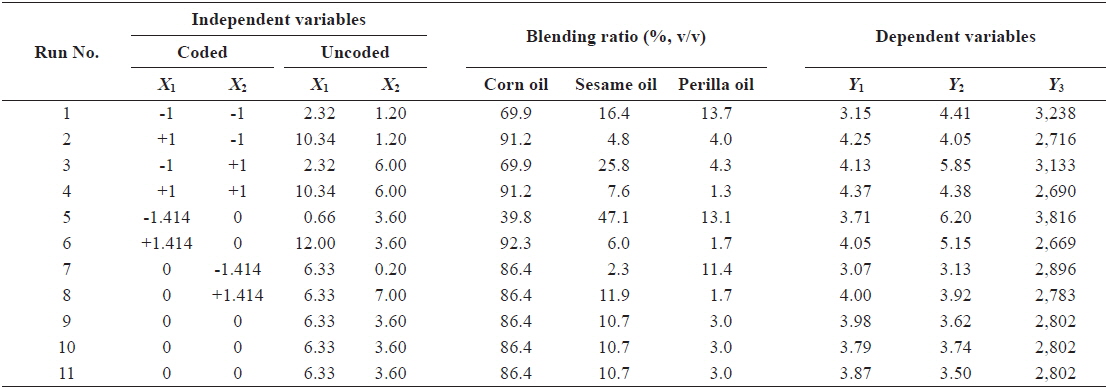
Central composite rotatable design matrix and values of dependent variables for the optimization of blending ratio of corn oil, sesame oil, and perilla oil
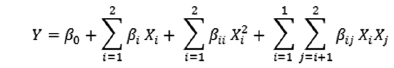
For the response surface regression procedure, the MINITAB software (Ver. 14, Minitab Inc., Harrisburg, PA, USA) was used to fit the following quadratic polynomial equation:

where
The blending ratio of corn, sesame, and perilla oils was individually optimized for the oxidation induction time (
>
Preparation of seasoned laver
Seasoned laver was prepared using an automatic roasting machine (G-400, Woojeong machine Co., Ltd., Seoul, Korea). A sheet of dried laver (2.5 g) was roasted at 150℃ for 10 s. It was the roasted again at 300℃ for 10 s, after the application of salt (0.08 g) and the mixed oil (1.6 g) containing corn, sesame, and perilla oils.
>
Oxidative stability using a Rancimat method
For the measurement of the oxidative stability of seasoned laver oil, the oil samples were isolated from the seasoned laver product using a press machine. The oxidative stability of the seasoned laver oils was evaluated by measuring the oxidation induction time using a Rancimat instrument (Metrohm CH series 743, MetrohmAG, Herisau, Switzerland). The oxidation process was monitored for a 3 g sample of oil using an air velocity of 20 L/h at 120℃. During the Rancimat test, volatile compounds, such as formic acid, were rapidly produced and carried by the stream of air to be collected in deionized water. The vapors were continually monitored by measuring the conductivity of the deionized water. The end point was determined in hours.
The sensory evaluation of the seasoned laver samples was performed with a panel consisting of 10 members (3 male, 7 female, aged 25-40 years). All 11 samples were evaluated simultaneously in a randomized order. The quality attributes selected for sensory evaluation were flavor, taste, and crispiness (Liang et al., 2008; Gkatzionis et al., 2013; Sinija and Mishra, 2011). Panel members were asked to take two or three samples to taste and provide a score for each. Between tastings each panel member rinsed their mouth with lukewarm water. The sensory factors assigned to each of the quality attributes were: dislike very much (1), dislike moderately (2), dislike slightly (3), neither like or dislike (4), like slightly (5), like moderately (6), and like very much (7).
>
Diagnostic checking of the fitted models
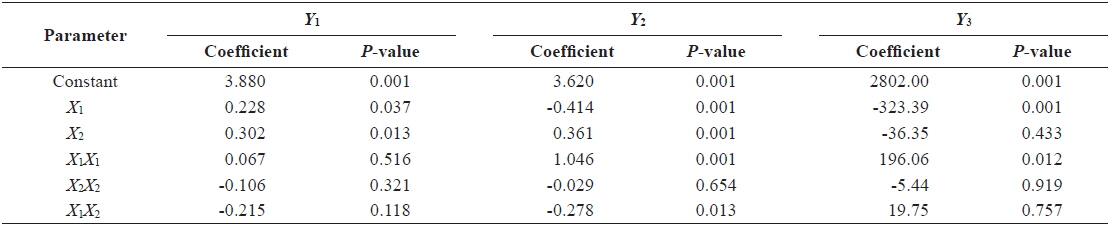
It was necessary to fit a quadratic polynomial equation to describe the behavior of the dependent variables on the independent variables (Bezerra et al., 2008). The response surface regression procedure was used to fit the quadratic polynomial equation to the experimental data. The significance of all the coefficients of the constant, linear (

Estimated coefficients of the fitted quadratic polynomial equation for responses based on t-statistic
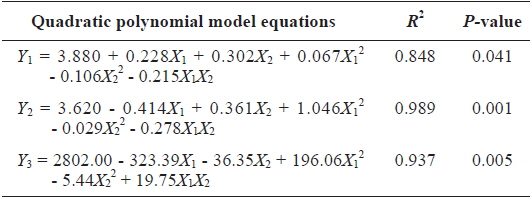
Response surface model equations for the optimization of blending ratio of corn oil, sesame oil, and perilla oil
The statistical significance of the quadratic polynomial model equation was evaluated by an analysis of variance (ANOVA). Table 6 shows the ANOVA results for the models that explain the response of the three dependent variables. The linear terms (
[Table 6.] Analysis of variance for response of dependent variables
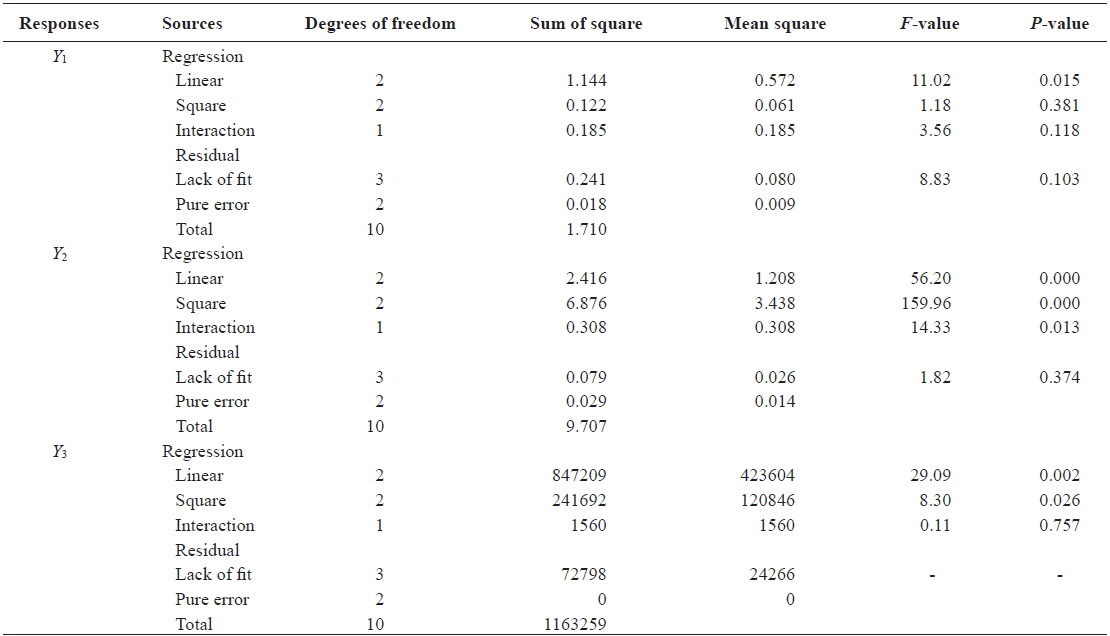
Analysis of variance for response of dependent variables
>
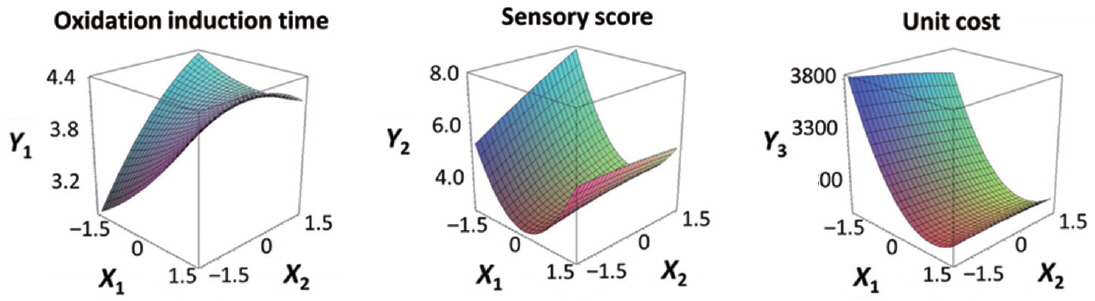
Effects of factors and response surface plots
RSM is a useful statistical technique for the evaluation of the relationships between independent (factor) and dependent (response) variables (Dorta et al., 2013). Fig. 1. shows the estimated response function and the effect of the independent variables (
>
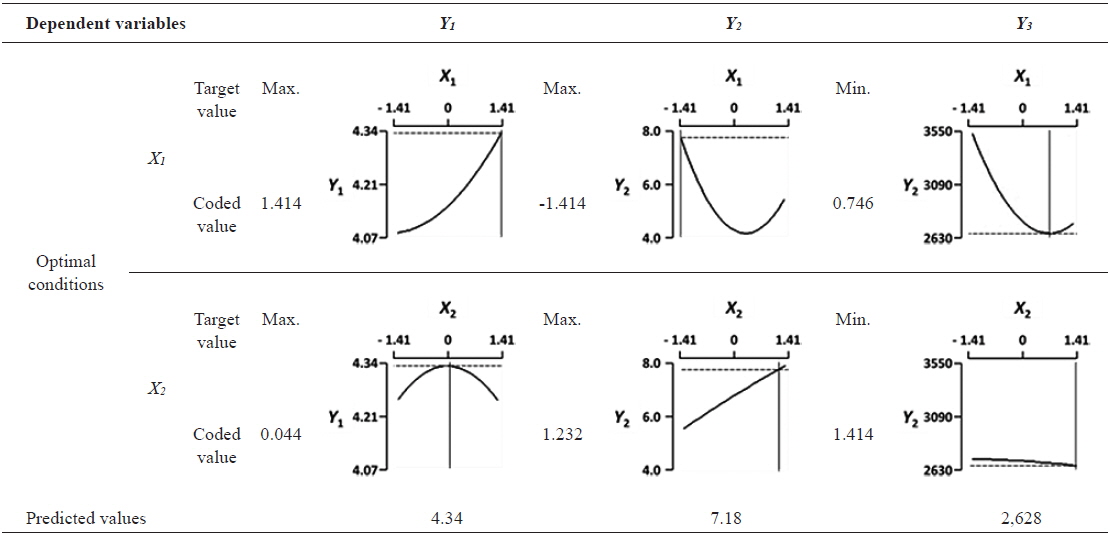
Optimization of the oil blending ratio
The blending ratio of corn, sesame, and perilla oils was individually optimized for the oxidation induction time (
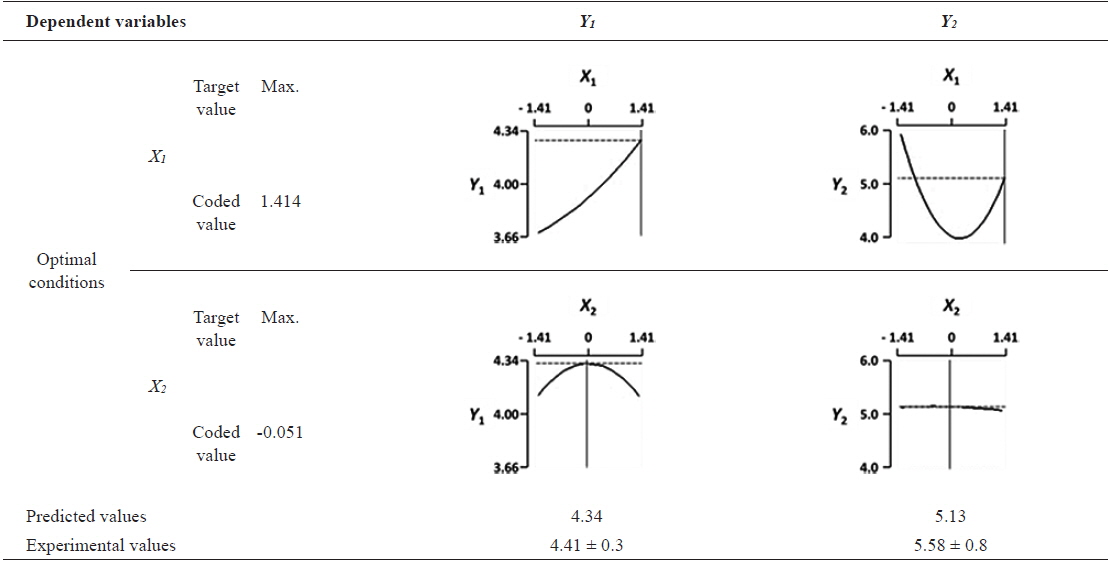
[Table 7.] Optimal conditions for each dependent variable

Optimal conditions for each dependent variable
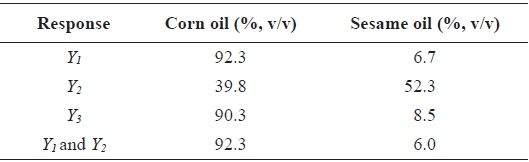
[Table 8.] Multiple optimal conditions and verification of the predicted and experimental values

Multiple optimal conditions and verification of the predicted and experimental values

Optimal blending ratios of corn oil, sesame oil, and perilla oil at the each optimal condition
>
Experimental verification of the predicted values at the optimal condition
The predicted values of the oxidation induction time (
In conclusion, our results show the effects of the blending ratio of corn, sesame, and perilla oils on the oxidation and sensory quality of seasoned laver. The price of the blended oil was also monitored. In addition, this study was designed and analyzed using an RSM. Therefore, the optimal conditions and values of the dependent variables in the RSM design matrix may be useful information for seasoned laver processing companies.