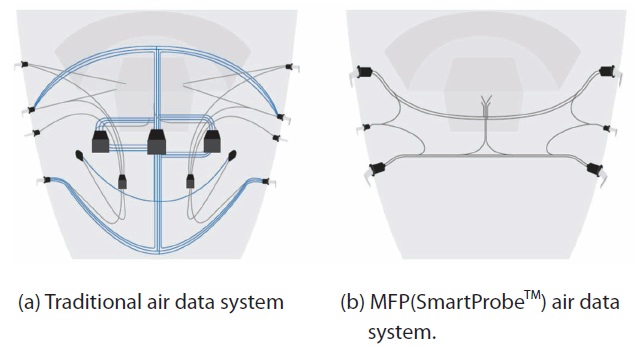
The traditional air data system of an aircraft measures the airspeed and the altitude by using Pitot-static probe and also measures the angle of attack by using the vane type angle of attack sensor independently. The separated measurement system requires very complex pneumatic lines and wires to connect equipments and occupies much space for installation. On the contrary, the MFP measures total pressure, static pressure and angle of attack simultaneously within a single air data sensor unit1.
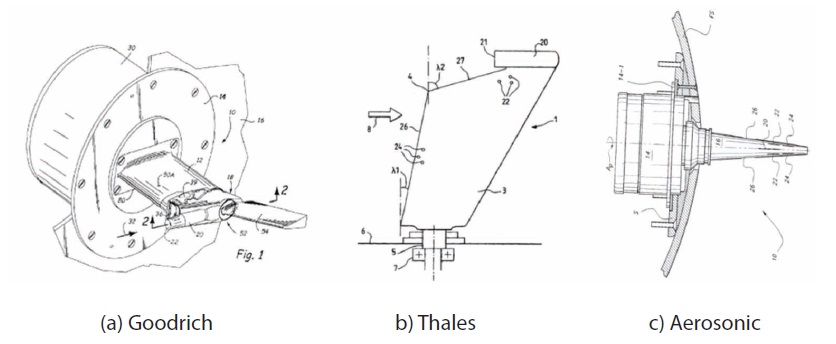
Typical MFPs have an embedded data processor unit located below the probe for direct processing of sensor information. Therefore, the MFP can measure airspeed, altitude and angle of attack simultaneously and can transmit the digital signal of data to the flight control computer directly. This kind of integrated concept makes the air data system very simple and also reduces its weight and volume as shown in Fig. 1. The simplified air data system has the advantage of minimizing the effort required for installation, operation, and maintenance2. Following the trend of the simple and integrated air data system, the present state-ofthe-art aircrafts are being equipped with multi-function type air data sensor more and more, for example, the A-380 as a commercial aircraft and F-22 as a military aircraft. Recently, various kinds of the MFP configurations are in development and commercially available from companies such as Goodrich2, Thales3, and Aerosonic4 in Fig. 2.
MFP can be separated into two categories, the multi-hole Pitot-static probe type and rotating vane type. Of the two types, a vane-type MFP has total and static pressure holes combined with a rotating vane for the measurement of angle
of attack. A vane-type MFP always guarantees the accuracy because the vane of the MFP automatically aligns itself with any flow direction and this mechanism minimizes the pressure measuring error under various flight conditions. The disadvantages of the vane-type MFP are well known as the response time delay and the vibration from overshoot because heavy and light inertia of the vane prohibit the alignment of vane along the freestream. In order to avoid such disadvantages, the shape of vane or the mechanical damper should be designed elaborately in the design process.
In the present paper, the aerodynamic attributes of the baseline model are understood through computational fluid dynamics (CFD) analysis, the design is modified to improve static and dynamic stability and obtain better response characteristics. A vane-type MFP from Aerosonic is selected as the baseline configuration. This model has been used for the previous researches in regard to the aerodynamic stiffness and damping analysis of the vane-type probe by the authors5. The dynamic response time requirement for the MFP is defined as a time constant, and it should be no greater than 100 msec at a speed of 120 kts as typical requirements6.
2. Initial Configuration and Analysis of Aerodynamic Characteristics
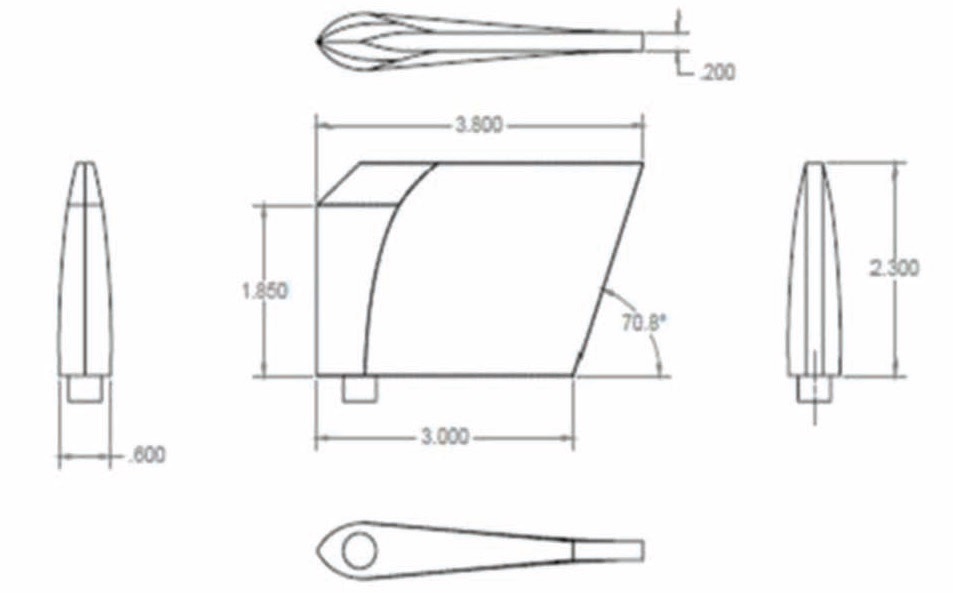
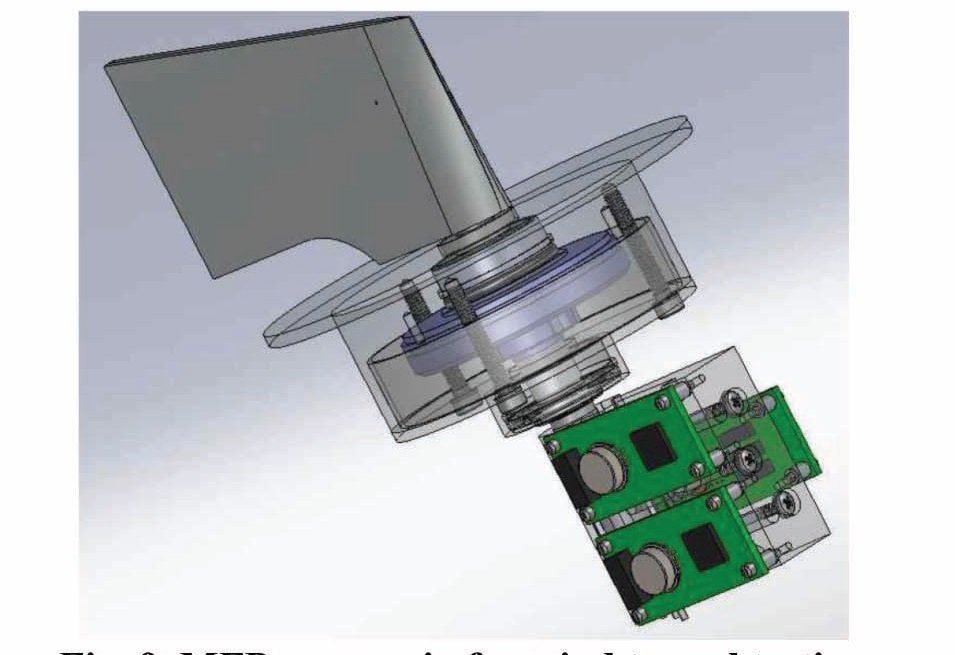
The initial configuration of the MFP from Aerosonic is shown in Fig. 3. Designed to be applied to state-of-the-art
fighter aircrafts, this MFP takes into account a heating sheet for anti-icing and de-icing. However, since the aerodynamic damping of this baseline configuration is not satisfactory, the system needs an additional mechanical damper. As the configuration update presented in this study improves the aerodynamic damping, the mechanical damper is expected to be reduced in size, yielding less system weight and cost.
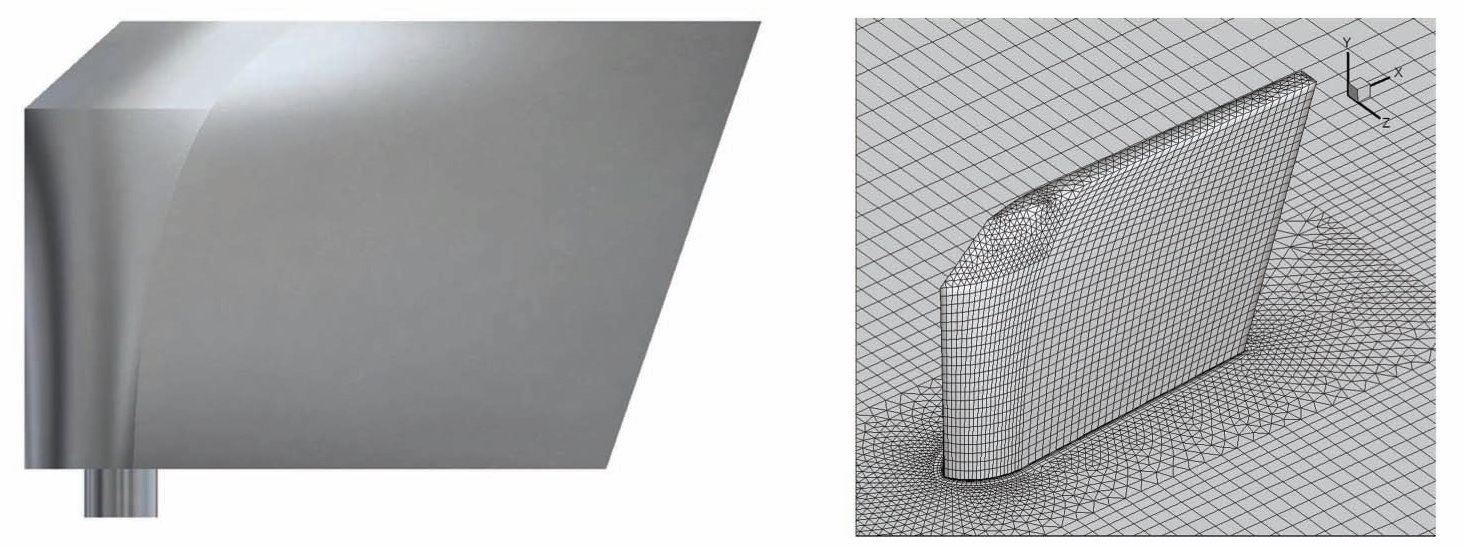
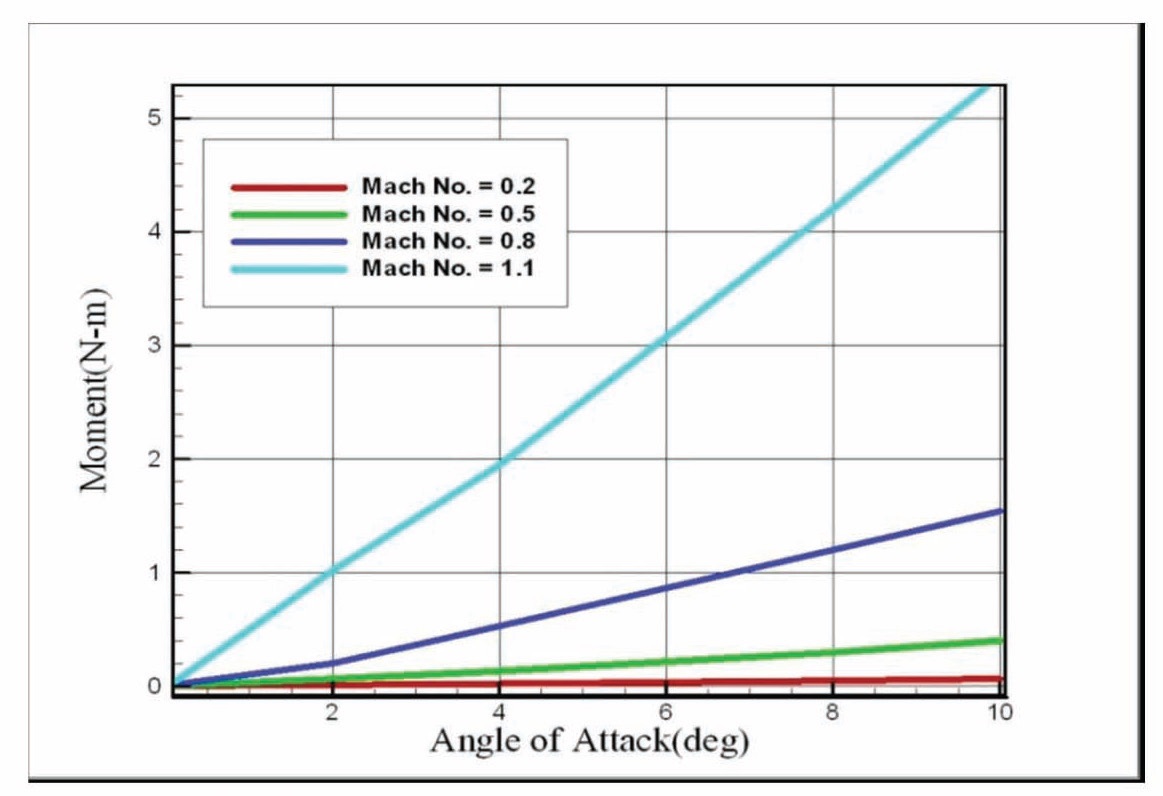
In order to obtain the aerodynamic stiffness, a Navier- Stokes equation solver was used for the analysis along with the Spalart-Allmaras turbulence model. The grid is generated to have 15 viscous boundary layers on the surface, where y+ is less than 10. The total number of nodes is 1,500,000. The physical grid for this analysis is shown in Fig. 4. The CFD analysis is conducted for a flow speed of 120kts, where the
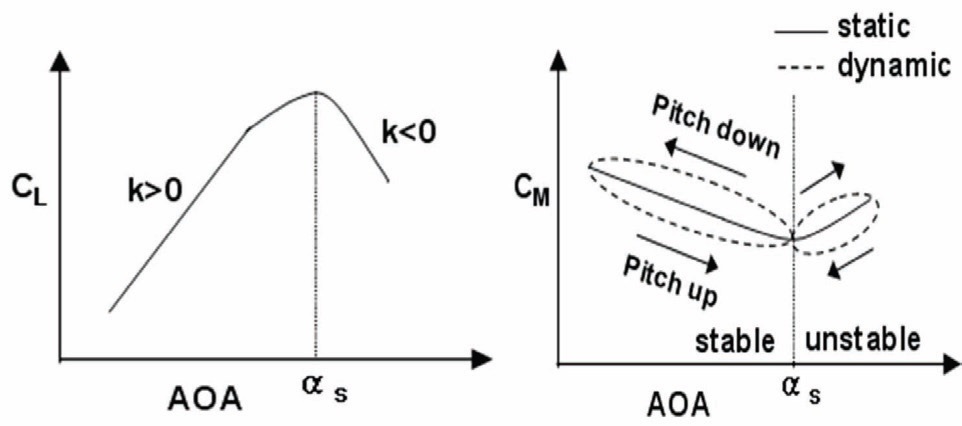
angle of attack is within the linear bounds of -5 deg to 5 deg. Figure 5 presents the aerodynamic stiffness for various Mach conditions. The representative aerodynamic stiffness of initial configuration is 0.23 Nm/rad. The design requirement of aerodynamic stiffness is to increase by 100%.
The aerodynamic damping of an aircraft can be estimated using empirical formulas, such as Datcom, or measured through dynamic stability wind tunnel tests using a rotary balance7. In this study, however, it is calculated using a CFD tool. The damping coefficient can be calculated based on two motions: pitch oscillation and ramp motion8. A brief introduction to the analysis methods using these motions is given below.
- Pitch oscillation


The vane oscillates in harmonic motion around the nominal angle of attack, or pitch angle,
- Ramp motion (pitch-up with constant


If the vane pitches at a constant rate, the change in moment from the static moment can be calculated. Dividing the moment change by the angular speed yields the damping coefficient. This method is efficient as it requires only one calculation to obtain all the damping coefficients within the angle of attack bounds.
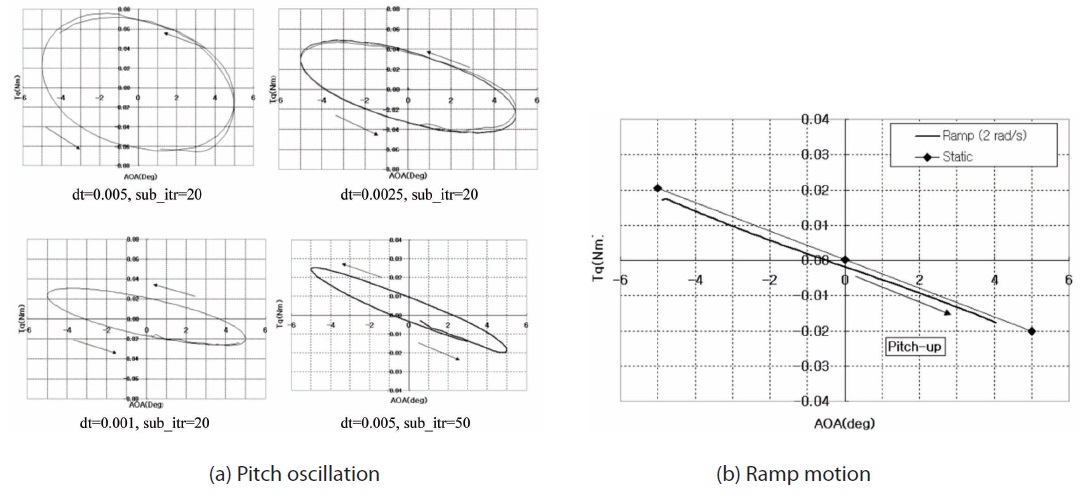
The pitch oscillation method that uses dual time stepping in its calculations gives no single number for the result as shown in Fig. 6. Instead, the result varies depending on the time step and the number of sub-iterations. This is probably because the present flow solver restricts the dynamic mesh to first order temporal accuracy. On the other hand, second order time accuracy is available when using the ramp motion method that incorporates the rotating mesh technique. Therefore, the damping coefficient from ramp motion analysis was used for the analysis of dynamic response. The damping coefficient of the initial configuration estimated from this method is 0.0012 Nmsec/rad at a wind speed of 120 kts. The design requirement of aerodynamic damping is to increase by 30%.
The oscillating MFP is an initial value problem (IVP) and can be simplified by a second-order ordinary differential equation as follows


Where J is the polar moment of inertia, γ is the damping coefficient, k is the stiffness, and τd is the friction coefficient of the bearing. J is calculated using Solid Works, and only the aerodynamic damping is included. It is assumed that there is no mechanical damper.
A new configuration is designed that improves the static stiffness and the aerodynamic damping over those in the initial MFP. The new MFP has better accuracy in measuring the pressure and angle of attack. In addition, it minimizes the use of the mechanical damper, which may ultimately reduce system cost and weight.
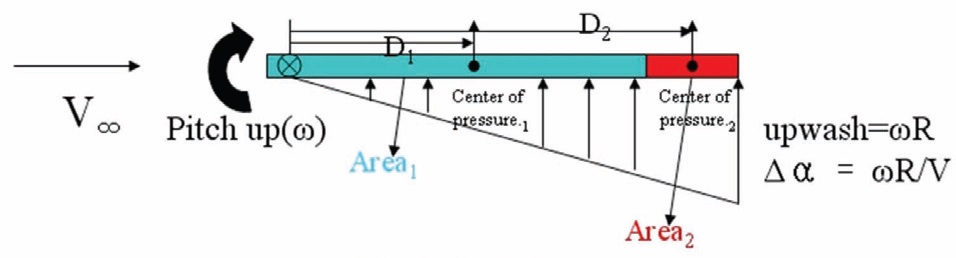
The direction of the design modification is determined by estimating how much improvement in aerodynamic damping can be achieved by adding a surface to the initial MFP. The additional surface has an area of A2 and a center of pressure at a distance D2 from the rotation axis. It is attached to the baseline, which has an area A1 and a center of pressure at a distance D1 from the same axis. In order to simplify the governing equation, the following assumptions are established:
- The center of pitch rotation is located before the probe
- The center of pressure is fixed regardless of the angle of attack
As Fig. 7. illustrates, when the probe rotates with an angular speed ω, the upwash component occurs on the downstream side of the model. This upwash increases the angle of attack, and thus the aerodynamic damping, causing a moment larger than the static (ω=0) condition. Here, the increment of the moment from the static condition is

This also represents the amount of the aerodynamic damping.
It is noticeable from the equation above that C
The damping increment for adding area A2 at the distance D2 is determined as

For example, adding A2, which is 20% of A1, at D2, which is two times D1, increases the aerodynamic damping by 80%.
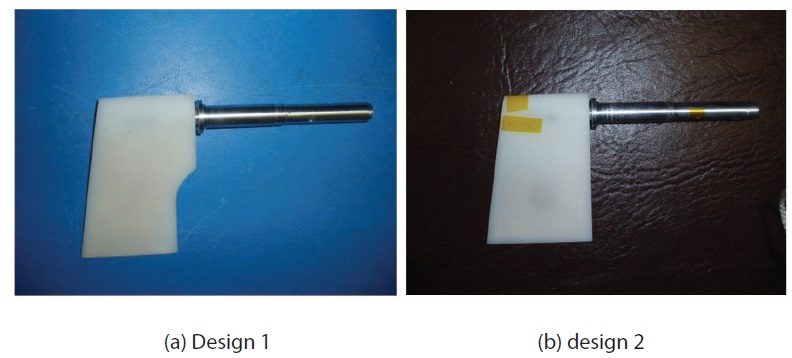
Design 1 has almost the same area as the initial configuration. However, it is designed to have a greater area at the location farthest from the axis of rotation. In addition, the brushing area against the wall is minimized so that the MFP can be installed regardless of the surface condition of
the aircraft. As the MFP is installed apart from the aircraft surface, the need for anti-icing or de-icing of the surface shrinks. Therefore, the overall system becomes simpler.
On the other hand, Design 2 maximizes aerodynamic damping, especially for an aircraft surface for which antiicing or de-icing is available.
The static and dynamic response tests are conducted in Aerosonic’s subsonic wind tunnel. The specifications of this wind tunnel are very suitable for this particular test: it is a suction type wind tunnel with a maximum wind speed of 160 kts and a flow angularity of less than 0.2 deg.
Figure 9 shows that the test rig consists of the MFP model, pressure sensors from Memscap, location sensors from Netzer, a counter mass to balance the weight, and the data acquisition system.
4.2 Multi-function Probe Model
The wind tunnel models of the MFP are fabricated using stereolithography (SLA) for rapid construction. The polar moment of inertia of the SLA model is matched with that of the actual aluminum MFP by inserting a brass plate into the model. The fabricated MFP wind tunnel test models are shown in Fig. 10.
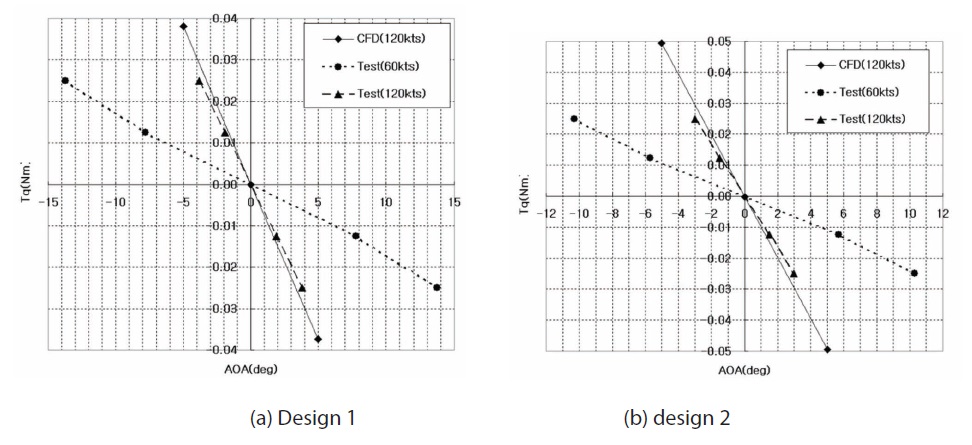
The results from the CFD analysis are compared with results from the wind tunnel test for the new MFP designs. The aerodynamic stiffness is measured in the test by recording the displacement angle corresponding to the moment applied to the model. The moment is adjusted by adding mass to the test rig. The results from the calculation and tests are shown in Fig. 11. Aerodynamic stiffness is defined here to be the opposite sign of the moment curve slope. It is noticeable from the figure that the calculations correlate well with the wind tunnel tests for 120 kts cases, although the test result of Design 2 is 21% lower than that of analysis. The summary of the aerodynamic stiffness of designs 1 and 2 is given in Table 1.
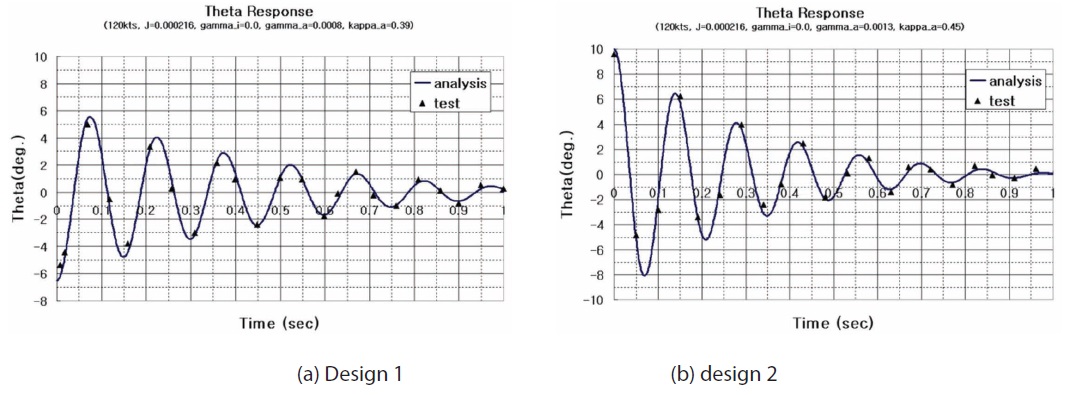
The aerodynamic damping from the test is estimated using the dynamic response data shown in Fig. 12. Using the dynamic response equation, the damping value is found by shooting until the response matches the time history from the test. In the course of determining the damping, the polar moment of inertia J, one of the important parameters, is calculated using Solid Works. The aerodynamic stiffness obtained from previous test is used, and the internal stiffness and bearing friction coefficient are separately measured in advance.
The summary for the aerodynamic damping of designs 1 and 2 is given in Table 2, showing the test result of Design 2 is 19% lower than that of analysis.
According to the CFD analysis, separation is delayed at the rear part of the vane, resulting in overestimation of aerodynamic stiffness. Furthermore, high aerodynamic stiffness, which means more pitching moment, essentially results in high aerodynamic damping, according to eqn. (6).
In this study, modified MFPs were designed and tested. It was verified by analysis and testing that they have better aerodynamic performance than the initial MFP. Analysis showed that the new MFPs result is more than two times greater in static stiffness and 33% higher in aerodynamic damping than the baseline configuration. In addition, it is verified that the numerical estimations of aerodynamic stiffness and damping using the CFD solver, especially for ramp motion, correlate well with the test results.
[Table 1.] Aerodynamic stiffness coefficient of designs 1 and 2
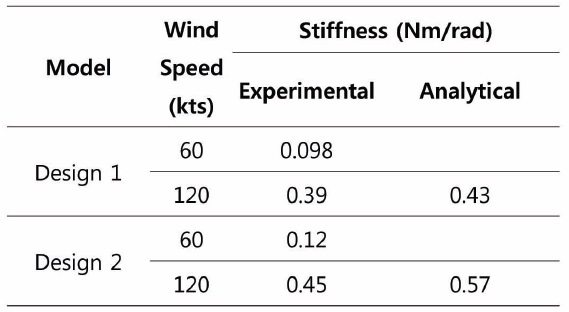
Aerodynamic stiffness coefficient of designs 1 and 2
[Table 2.] Aerodynamic damping coefficient of designs 1 and 2
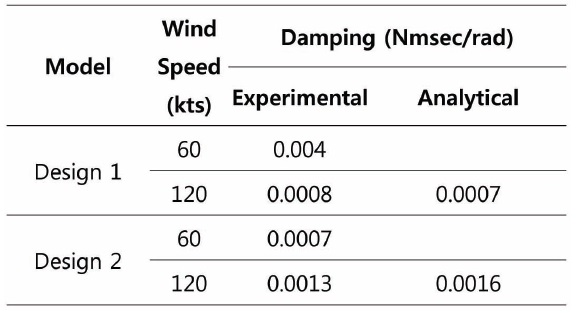
Aerodynamic damping coefficient of designs 1 and 2