Flutter has been realized to be one of the most dangerous aeroelastics of structures in civil engineering, especially after the disaster of the Tacoma Narrow Bridge. Flutter relates to both wind loads and structural response, from the perspective of control structure interactions. The flutter vibration mode is caused by self-excitation force from wind loads. When flutter occurs, the oscillatory motions regarding all degrees of freedom in the structure couple to create a single frequency called the
The question regarding the effective flutter and buffeting control is of growing interest as the span length of suspension bridges increases. This has resulted in a variety of techniques to reduce or suppress the aeroelastic response. The most common control methods can roughly be divided into the structure-based method and the aerodynamics-based method. The former approach exploits stiffened girders and/ or eccentric mass to control the flutter phenomenon passively whereas the latter approach focuses on generating stabilizing aerodynamic forces from the flow to solve the flutter problem.
A high torsion rigidity truss-stiffening girder was widely used in the design of a suspension bridge. For instance, the Akashi Kaikyo Bridge has a vertical stabilizer in the center span located along the centerline of the truss-type stiffening girder to improve aerodynamic stability. However, truss sections usually exhibit reasonably high wind forces (drag loading) which must be resisted by the bridge structure leading to the increase in the construction cost. The development of box-girders with a nearly streamlined section could also achieve the wind stability of a long span bridge. A twin-deck configuration with a center gap has been proven to be an effective means of improving the flutter characteristics (Fok et al., 2004a, 2004b; Kwok et al., 2012). However, the adequate stability cannot be assured beyond a certain limit in regard to length of spans (Brancaleoni, 1992; Ostenfeld and Larsen, 1992).
Research on aerodynamic control by using winglets and flaps (or being called control surfaces) was proposed and developed (Kobayashi et al., 1992, 1996, 1998, 2001 and 2005). The study was continued with experiments on passive flap control in turbulent and smooth flow (Phan and Kobayashi, 2011). However, the numerical simulation was not presented. Furthermore, the effects of flap control on the full span of the suspension bridge were not carried out. An extensive theoretical study on the active control of bridge flutter using a model similar to that proposed by Kobayashi was presented (Wilde et al., 1998; Preidikman and Mook, 1998; Nissen et al., 2004). The active model was then translated to a passive one (Wilde et al., 1999). Omenzetter et al. (2000, 2002) also proposed the passive flap control with springs and supplementary cables.
In order to study the effects of wind on structures, the time domain analysis may be the most effective approach. This approach can be done if forces acting on structures are expressed in the time domain. The famous self-excited forces suggested by Scanlan and Tomko (1971) contain frequencydependent coefficients. These forces are functions of flutter derivatives and reduced frequency. These flutter derivatives are found by experimental testing. To use these forces in the time domain, they have to be transformed into time dependency forces. This can be achieved by using indicial functions (Costa and Borri, 2006; Scanlan et al., 1974) or rational functions (Chen et al., 2000; Chen and Kareem, 2001; Cao and Sarkar, 2012). The simpler approach is to use quasi-steady theory. It is valid in both the time and frequency domain. These forces are the functions of the aerodynamic force coefficients: lift, drag, and moment coefficients.
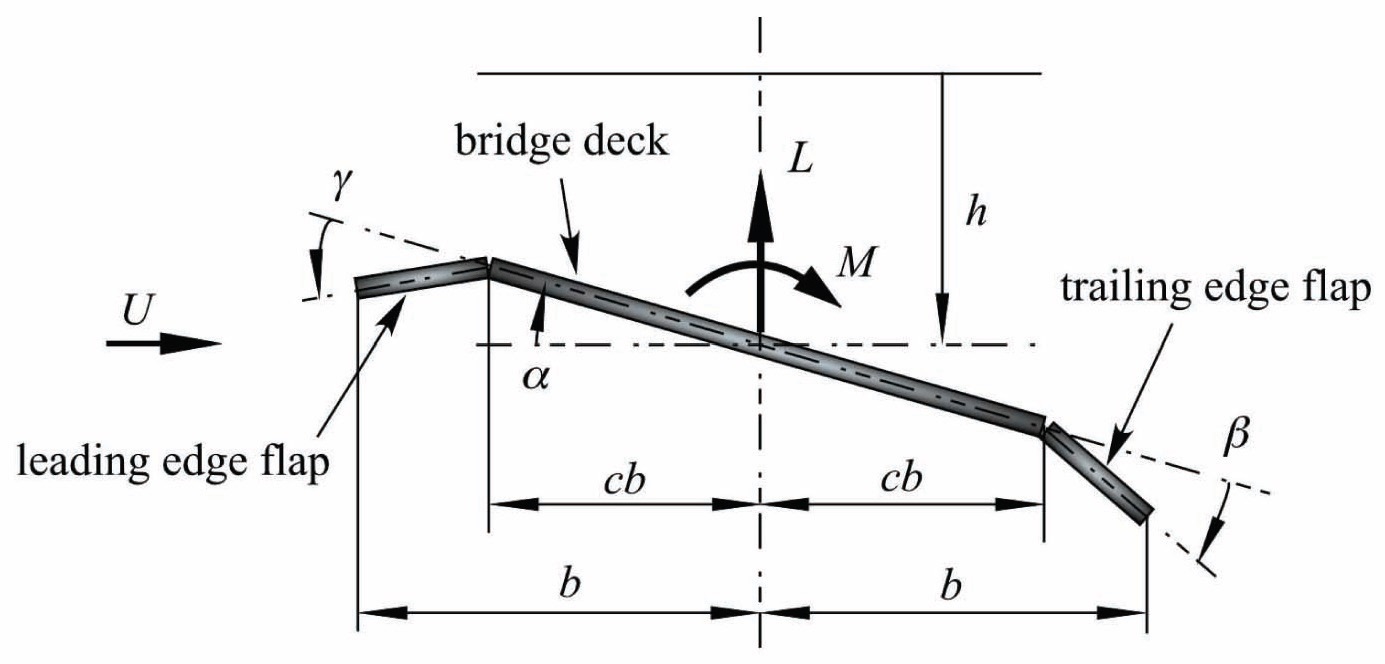
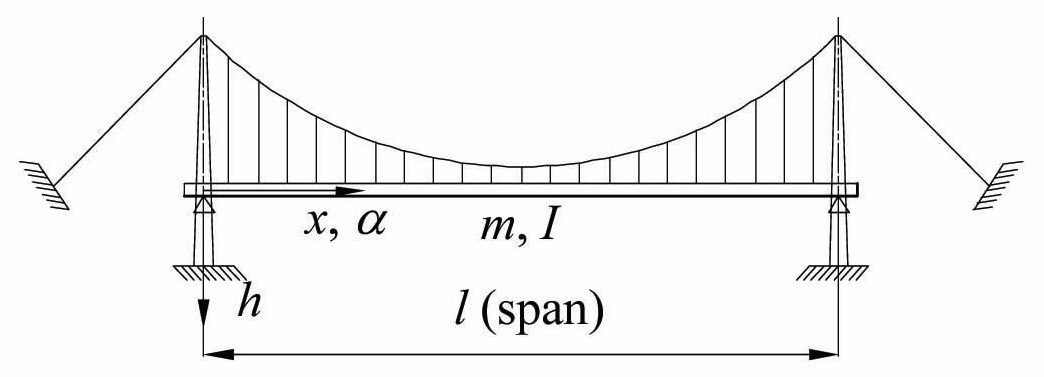
In this study, the efficiency of mechanically driven flaps for controlling the aerodynamic stability of a bridge deck was investigated with both numerical simulation and experiment approaches whereby, a flap was mechanically controlled by the pitching motion of the deck and the aerodynamic damping or suppressing aerodynamic force was then produced. As shown in Figure 1, the flaps were installed on both sides of the bridge deck and allowed the pitching motion. Providing the appropriate pitching motion of, the aerodynamic suppressing forces produced by them overcome the aerodynamic excitation, thus the flutter and buffeting were suppressed. Sectional model tests were also conducted to investigate the effect of the mechanically driving flap on the aerodynamic control. To explore the effects of flap control on both two-dimensional and three-dimensional cases, the quasi-steady theory has been selected with the related force coefficients obtained from the experiment in the wind tunnel. In addition, the numerical study on flutter and buffeting passive control for a super-long span suspension bridge (3,000 m central span) has been taken for the analysis. A three-dimensional model in conjunction with mode-by-mode analysis has been considered in an attempt to predict the flutter speed and buffeting response for full span with and without flaps. The method of analysis in essence is based on the quasisteady forces method as used in the two-dimensional analysis.
2. Two-dimensional analysis by quasi-steady forces
The bridge deck section in this paper was a shallow box girder and was aerodynamically treated as a flat plate. The controlling flaps at both edges of the bridge deck were also assumed to be flat plates. Thus, the numerical model of the bridge deck with the controlling flaps is described as shown in Figure 1.
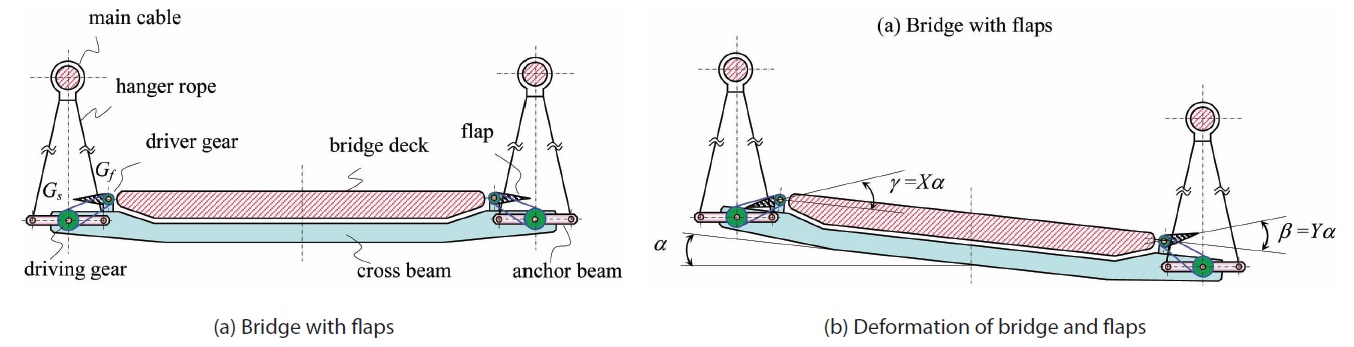
Figure 2 presents the bridge deck system having flaps which were mechanically driven by the rotational motion of
the deck. The flap was fixed with a hinge at the longitudinal edge of the bridge deck. Two hanger cables from a main cable were fixed to an anchor beam at its ends. A cross beam of the deck system was fixed to the anchor beam with a hinge. The gears
The same mechanism of the flap driving system was installed at the leeward side of the bridge deck. When the flaps were driven by the above mentioned manner, if we set the head-up motion of the bridge deck as
The governing equations of motion with respect to the static equilibrium position of a two-dimensional bridge deck excited by aerodynamic forces are given by
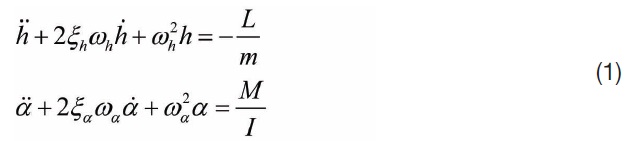
In which m is the mass per unit length;
moment (positive when clockwise).
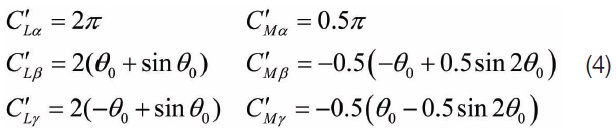
By using the classical thin airfoil theory (Anderson 1984), the static aerodynamic lift
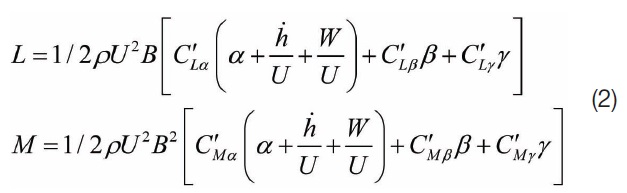
In which
The vertical wind is defined as follows:

where

is the mean vertical wind speed, which is assumed to be zero;
where
The flaps are passively driven by the pitching motion:
With the known values of all parameters, Eqs. (1) were solved by using the Runge-Kutta method to obtain the critical speed and the buffeting responses.
2.3 Numerical results based on the experimental data
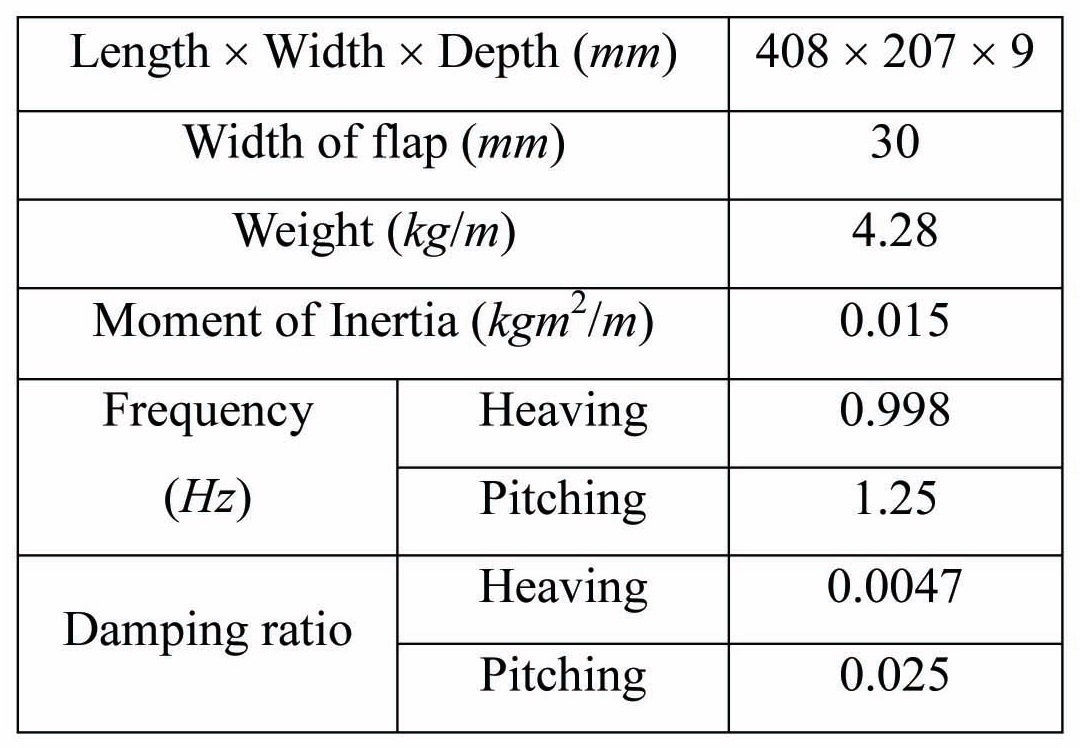
The model dimensions and the dynamic properties of the investigated system are shown in Table 1. In still air, the damping ratios and the natural frequencies were measured when the flaps were fixed.
The vertical wind speed
The sensitivity numerical study in regard to the critical speed was performed with the combination of the coefficients
[Table 1.] Model dimensions and dynamic properties of the investigated system

Model dimensions and dynamic properties of the investigated system
[Table 2.] The slopes of lift and moment coefficients
The slopes of lift and moment coefficients
Kutta method. The slopes of the aerodynamic force coefficients for the numerical simulation were obtained from experiments done in smooth flow. These values are listed in Table 2.
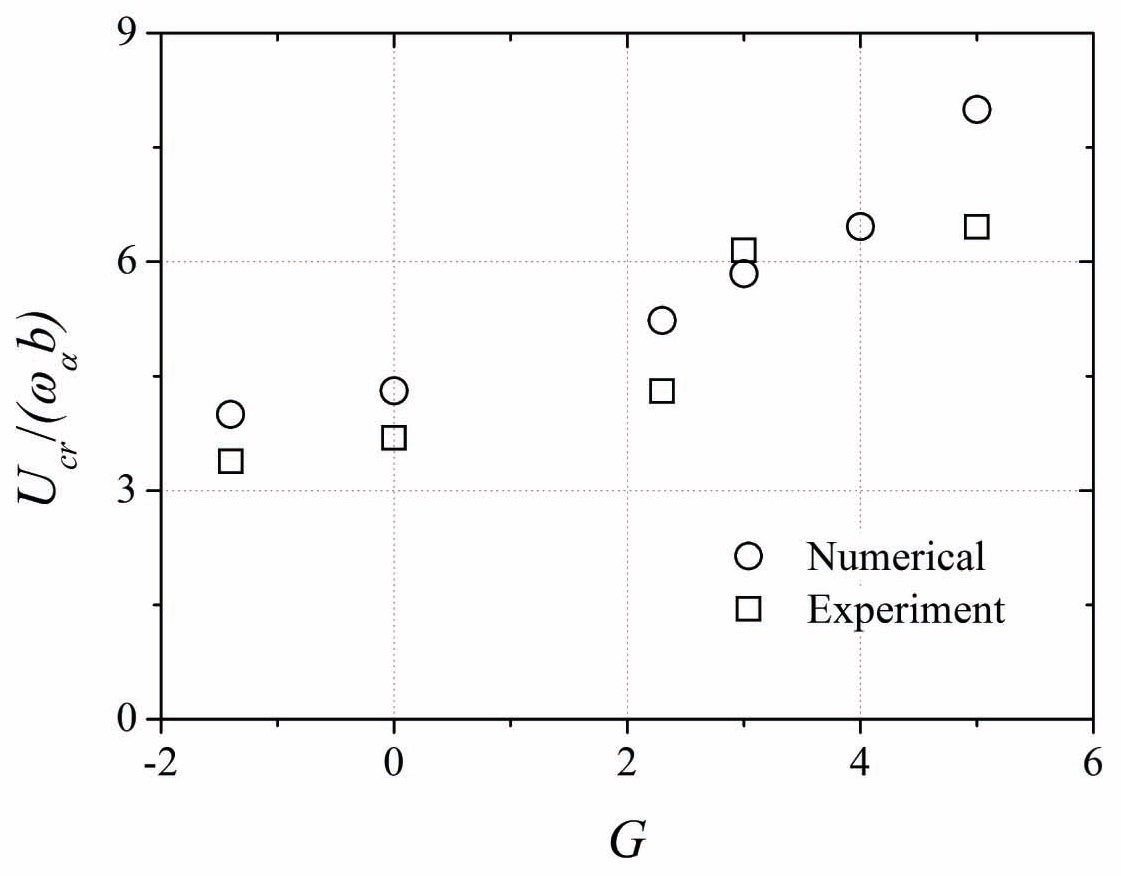
Figure 4, in which the vertical axis shows the critical speed
To check the effect of the amplifying factor
where
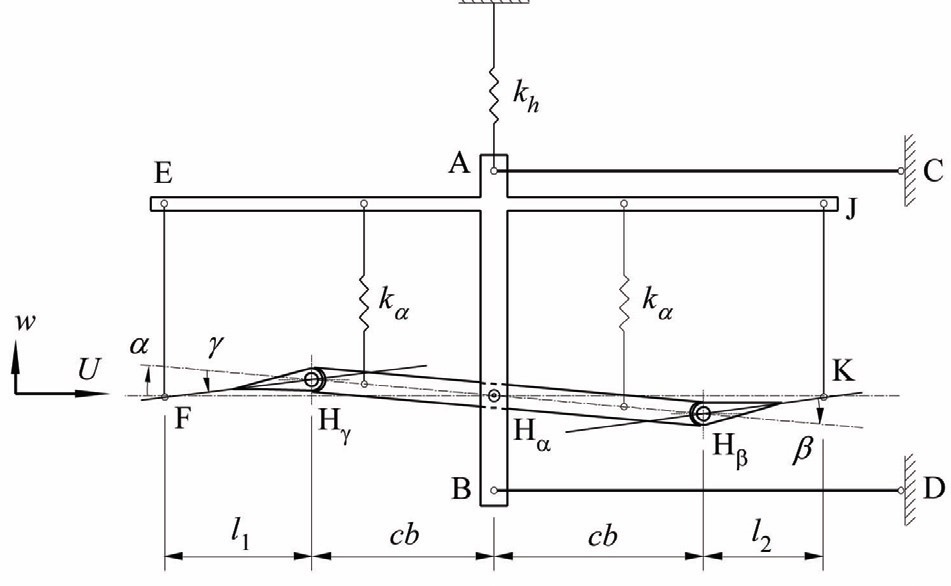
The two-dimensional wind tunnel tests were conducted to investigate the effects of the mechanical flaps on the controlling of the wind-induced oscillations. The springmounting of the model and flaps are shown in Figure 6. Details of the cross sectional shapes are also included.
The model was fixed with the hinge at the point Hα of the supporting frame. The frame was supported by the vertical spring
The flaps were installed at both sides of the model. The leading-edge flap had a driving arm FHγ to its end of the rotation axis. During a heaving motion of the modelmounted system, this driving arm did not move. The vertical tie bar EF connected a given point of the driving arm and the frame. The pitching motion of the flap was given by the pitching motion of the bridge deck through the driving arm. The trailing-edge flap also had the same mechanism. Thus, the control manner described in the above section (Figure 2) was realized in this model.
The magnitudes of the flaps depend on the location of the tie bars
If
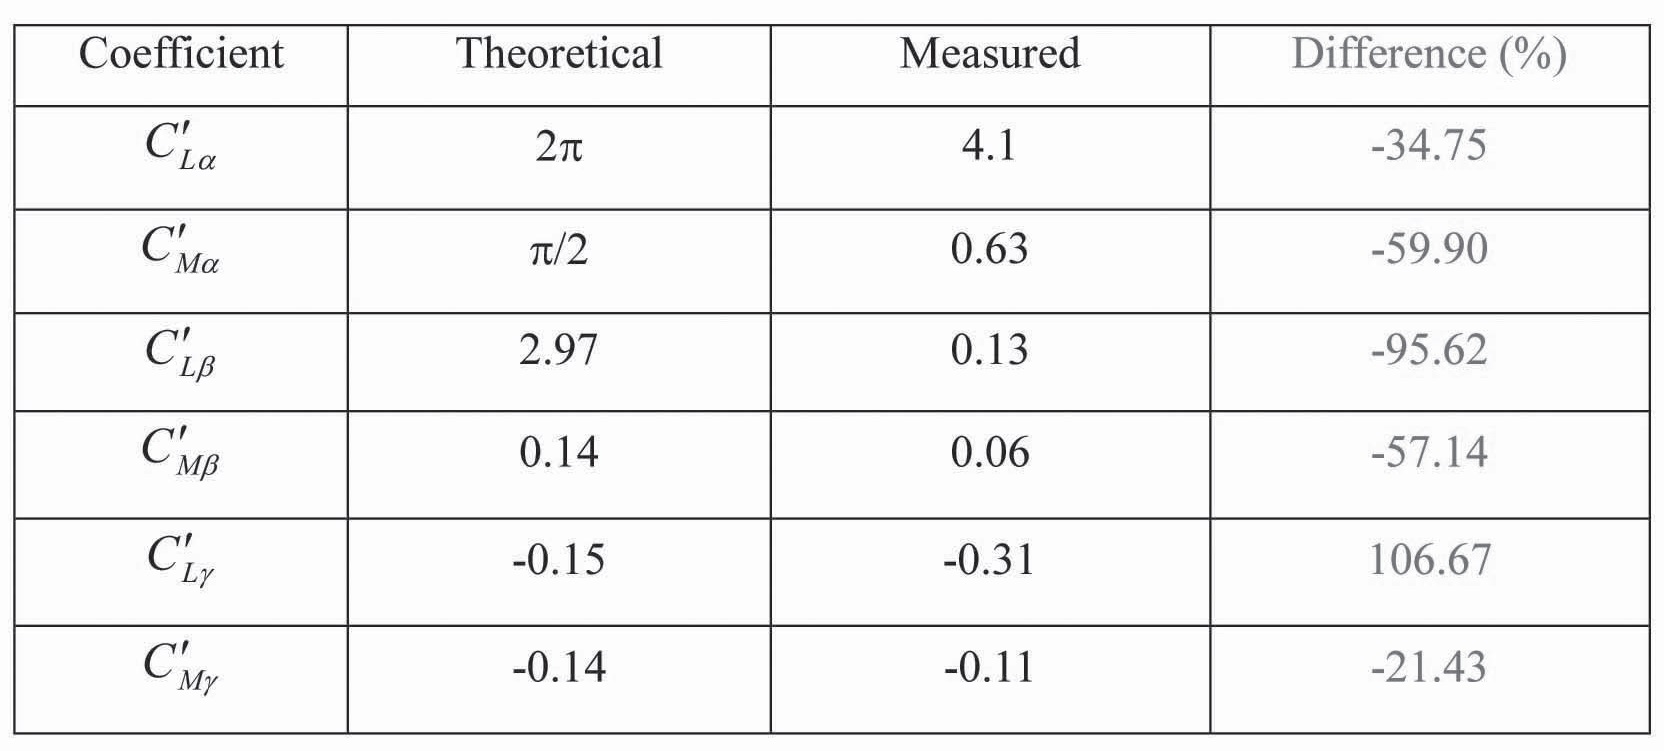
The static aerodynamic force coefficient by the flap was measured in a smooth wind when the angle of attack regarding the bridge deck was 0 degrees. The slopes of the coefficients (derivatives) of the lift and moment among these angles were estimated and compared with the theoretical values on the flat plate. The results are shown in Table 2. A very small lift slope was obtained from the trailing edge flap. It is assumed to be caused by the following reasons. The trailing flap was in a region of the separated flow different from the theoretical flow. In addition, the small gap between the deck and the flap also reduced the aerodynamic force by the flap resulting in the differences between the theoretical and measured values as provided in Table 2. The damping ratios and the frequencies of the model with the controlling flaps were measured in still air. The results are listed in Table 3. These values changed when factor G changed.
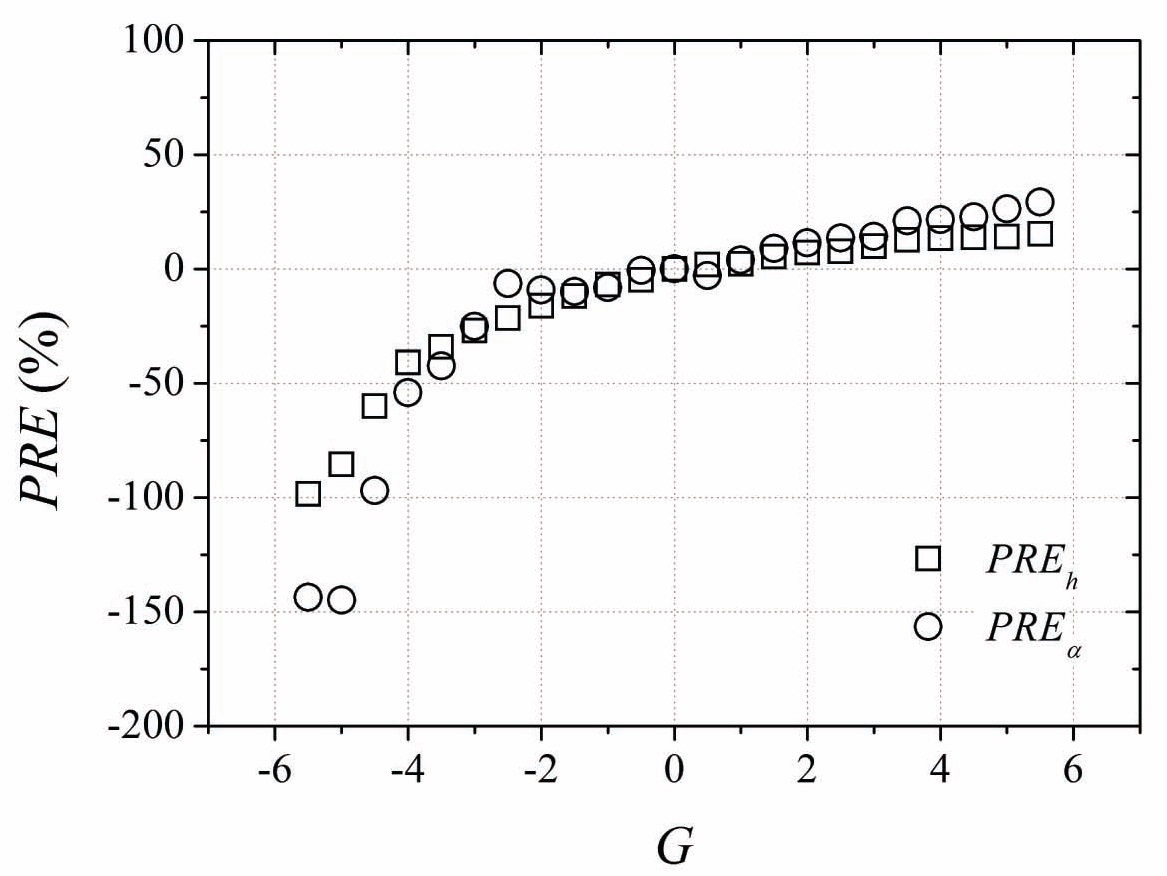
The control effect of the flap control with several values of
[Table 3.] Damping and frequency in smooth flow test
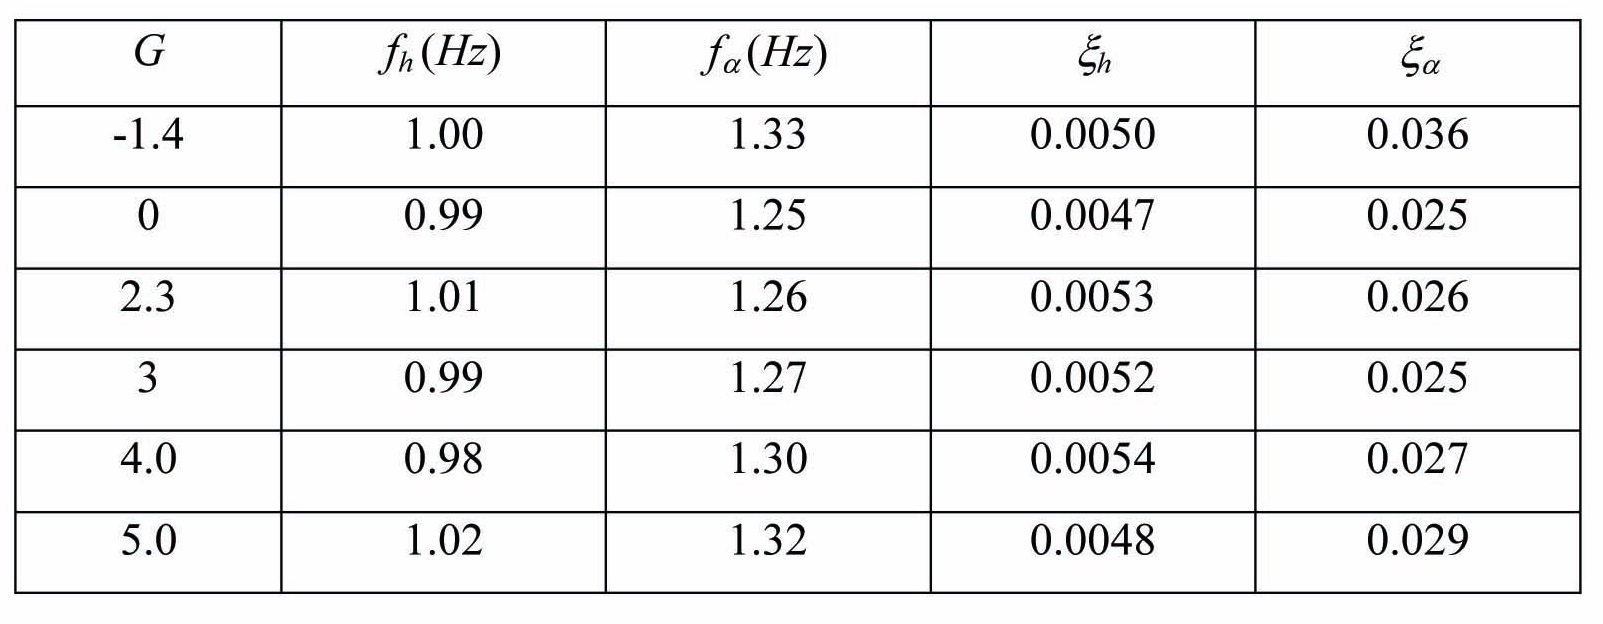
Damping and frequency in smooth flow test
effect for the aerodynamic response. The experimental result by
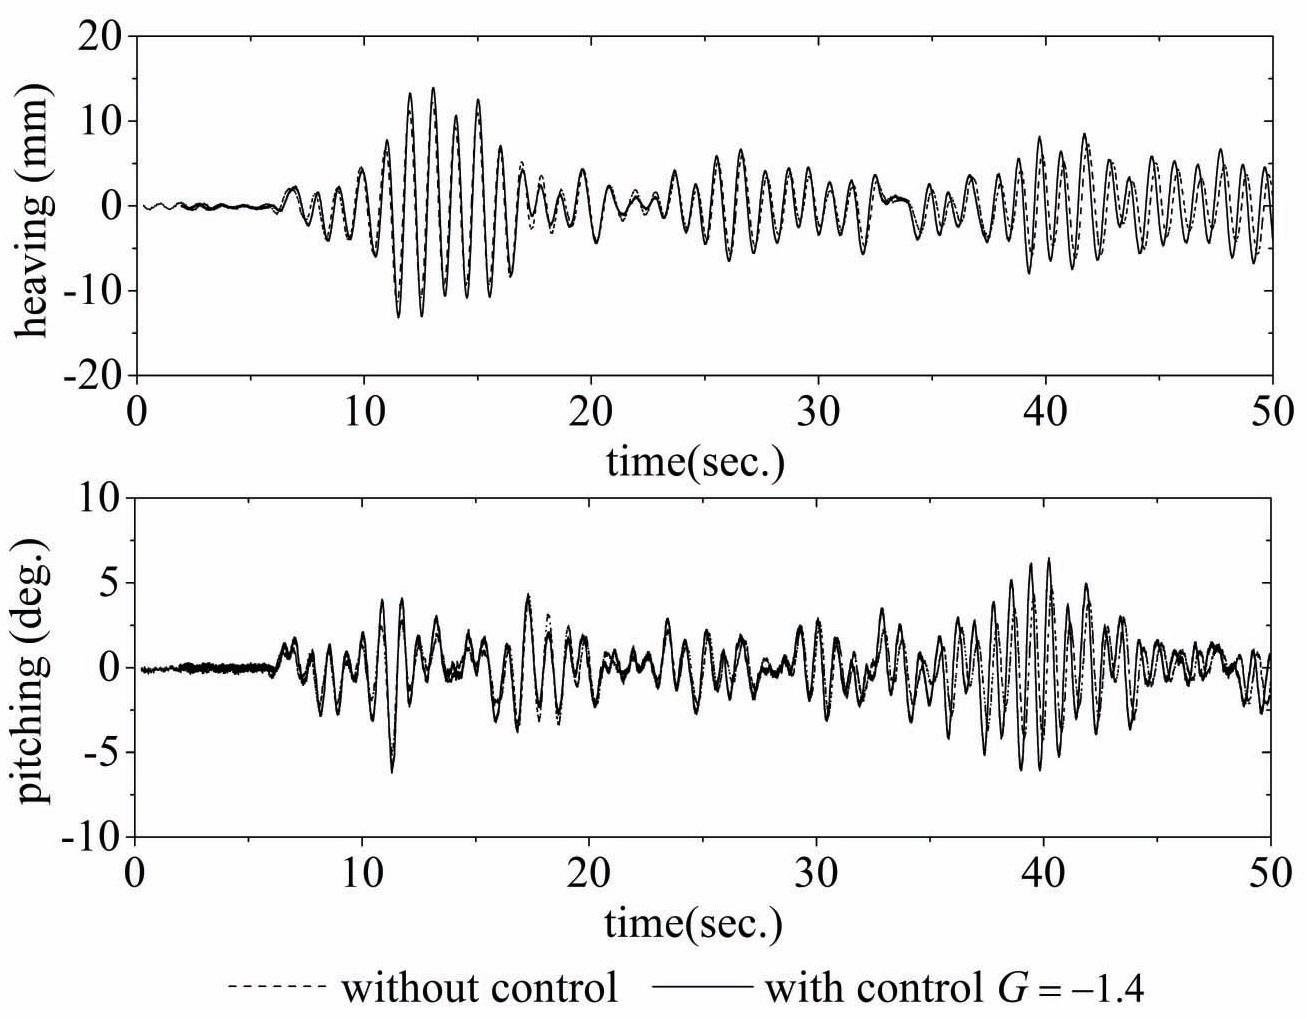
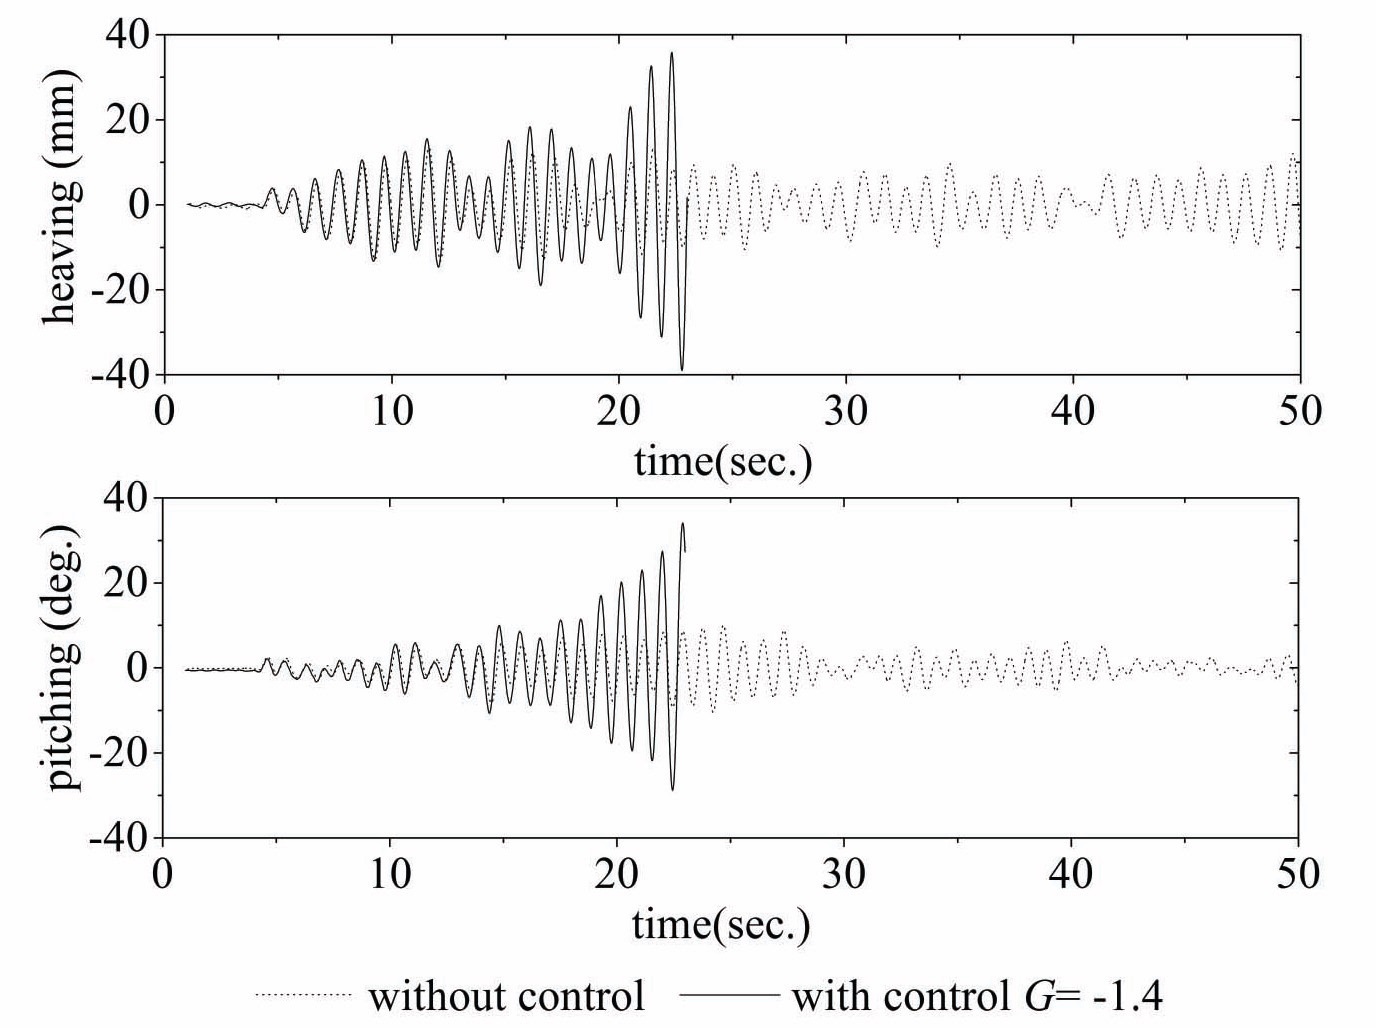
An example for the time history of the response in regard to the model with and without flap control in a turbulent flow is shown in Figures 8-10. The time experiment responses
of heaving and pitching for the reverse effect are shown in Figure 8. For the case without control,
4. The three-dimensional mode-by-mode analysis
4.1 The aeroelastic full model of suspension bridge
To apply the flap control to a full span bridge, the following problems were to be investigated. First, the relation between the install flap length and the critical wind speed was examined. Second, the influence of the vibration mode number on the control result was checked. Finally, the buffeting response of the suspension bridge was also tested.
In this numerical study, a simple span suspension bridge with span length
[Table 4.] Structural properties of the full bridge model and the flaps
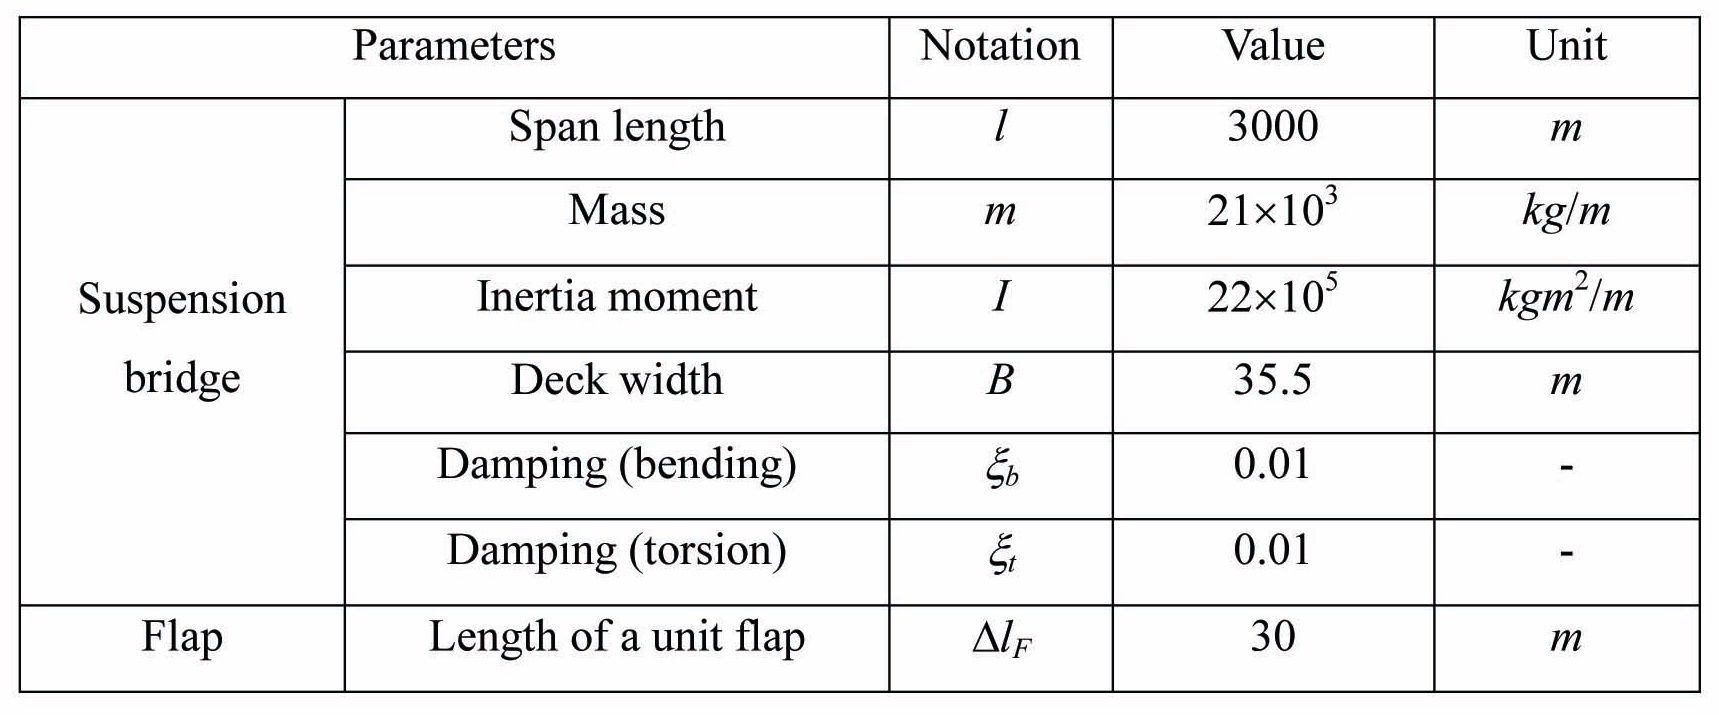
Structural properties of the full bridge model and the flaps
this simulation are listed in Table 4. The damping ratios of bending and torsion modes were assumed to be 0.01 for the mode-by-mode study. This assumption was made for all modes.
The vibration mode shapes and the natural frequencies of bending and torsion motion were obtained by using the finite element method (Abdel-Ghaffar, 1976). The results are shown in Table 5 for the first twenty modes. The lateral motion was neglected in this study.
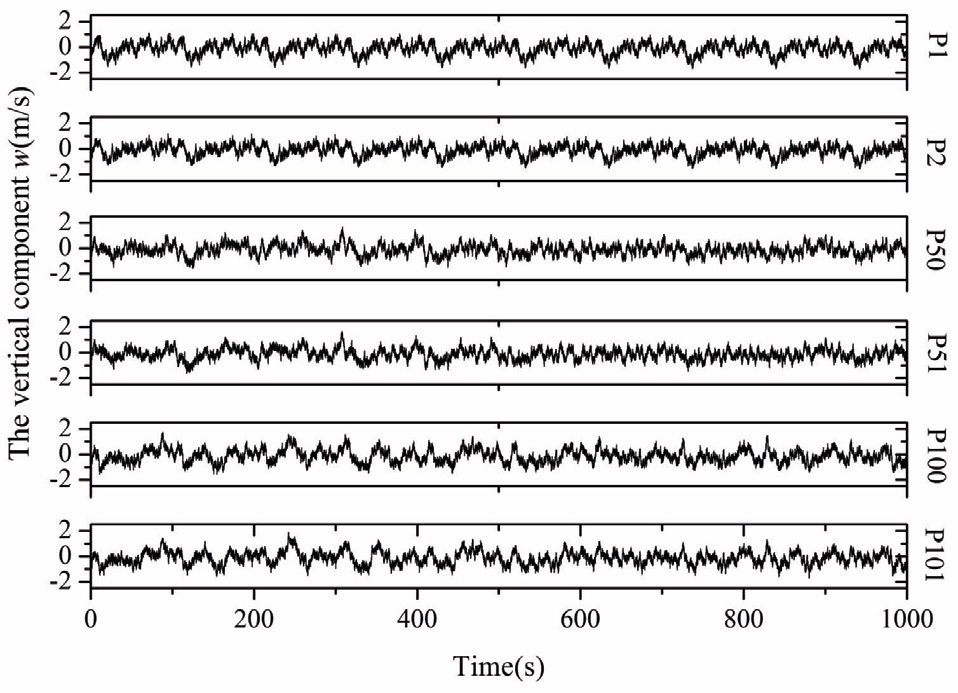
4.2 Simulation of turbulent wind field
The simulation of the vertical turbulent wind field acting on the bridge was carried out. The spectra representation method was used (Paola 1998, Deodatis 1996, Cao
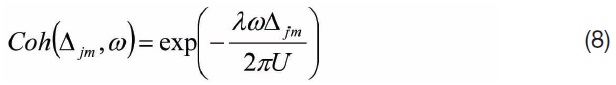
In which
The bridge deck motions were assumed by the combination of one bending mode and one torsion mode as follows:
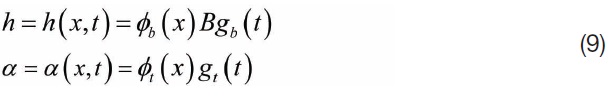
where
[Table 5.] The first twenty natural frequencies of the bridge
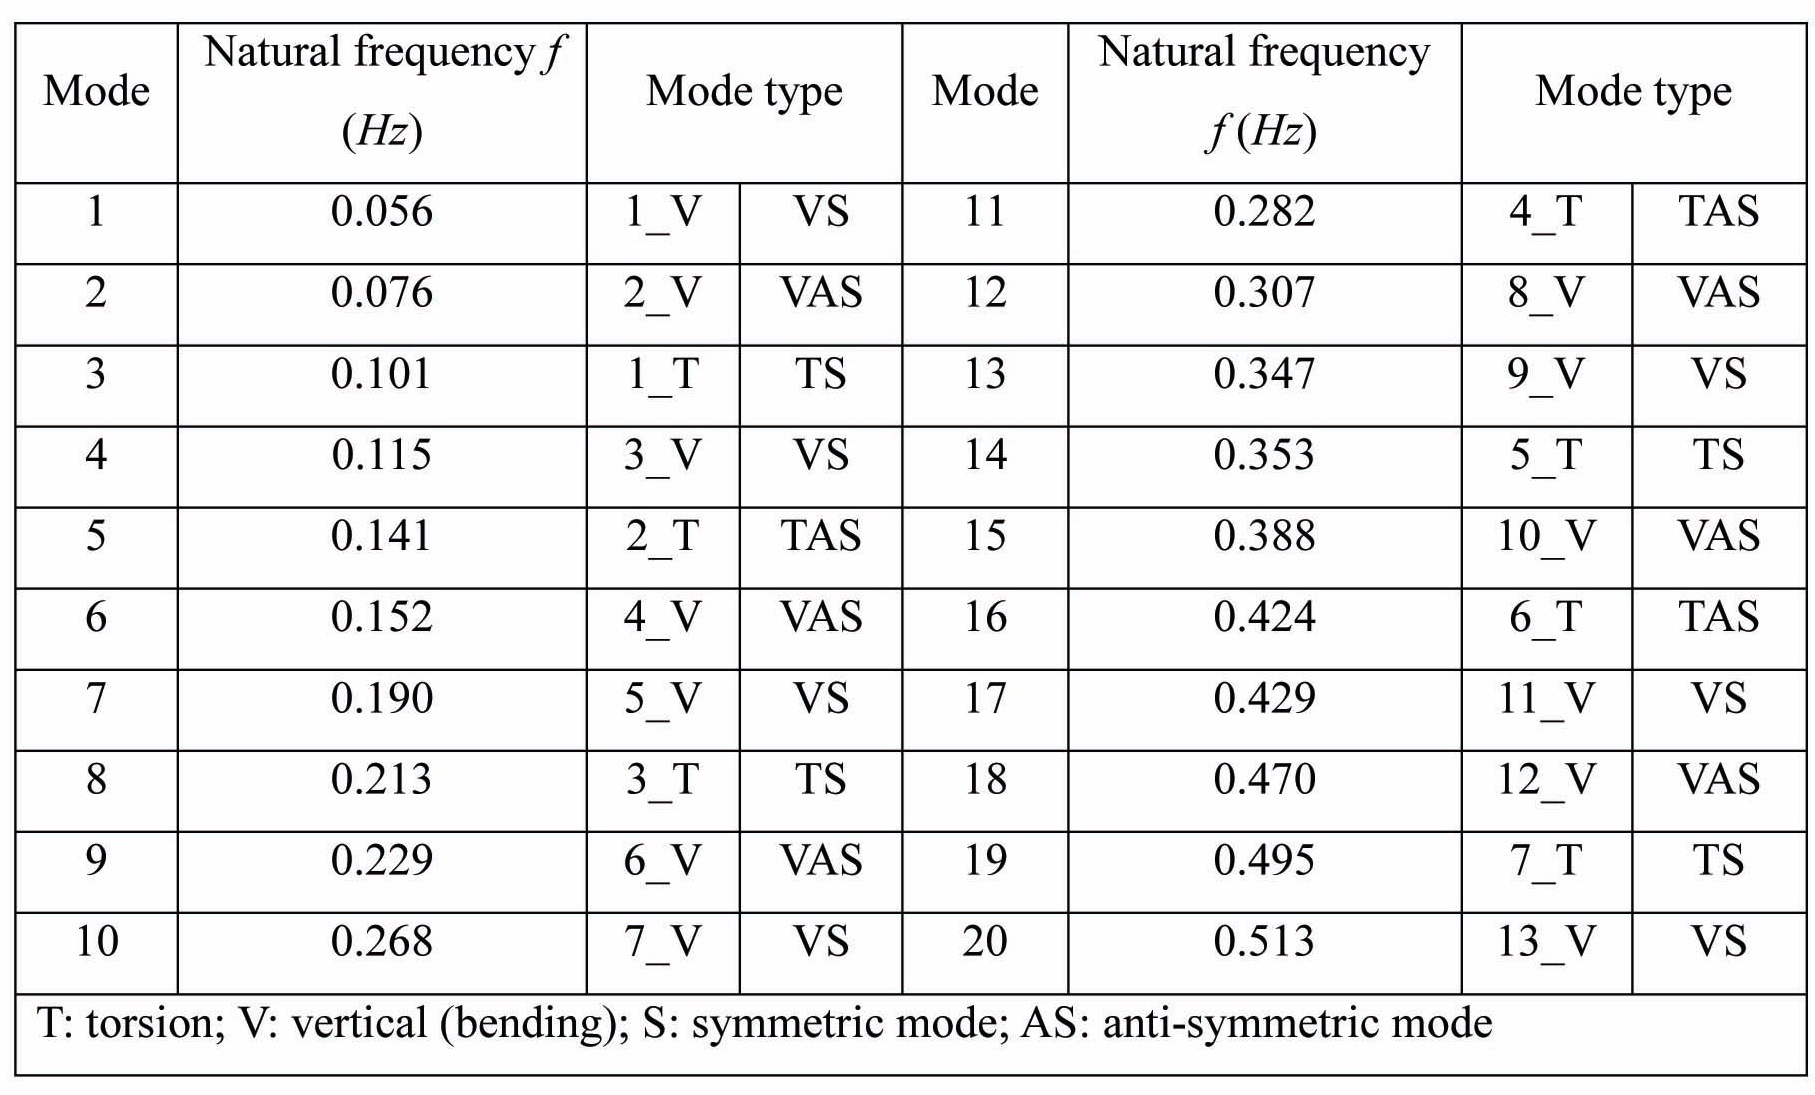
The first twenty natural frequencies of the bridge
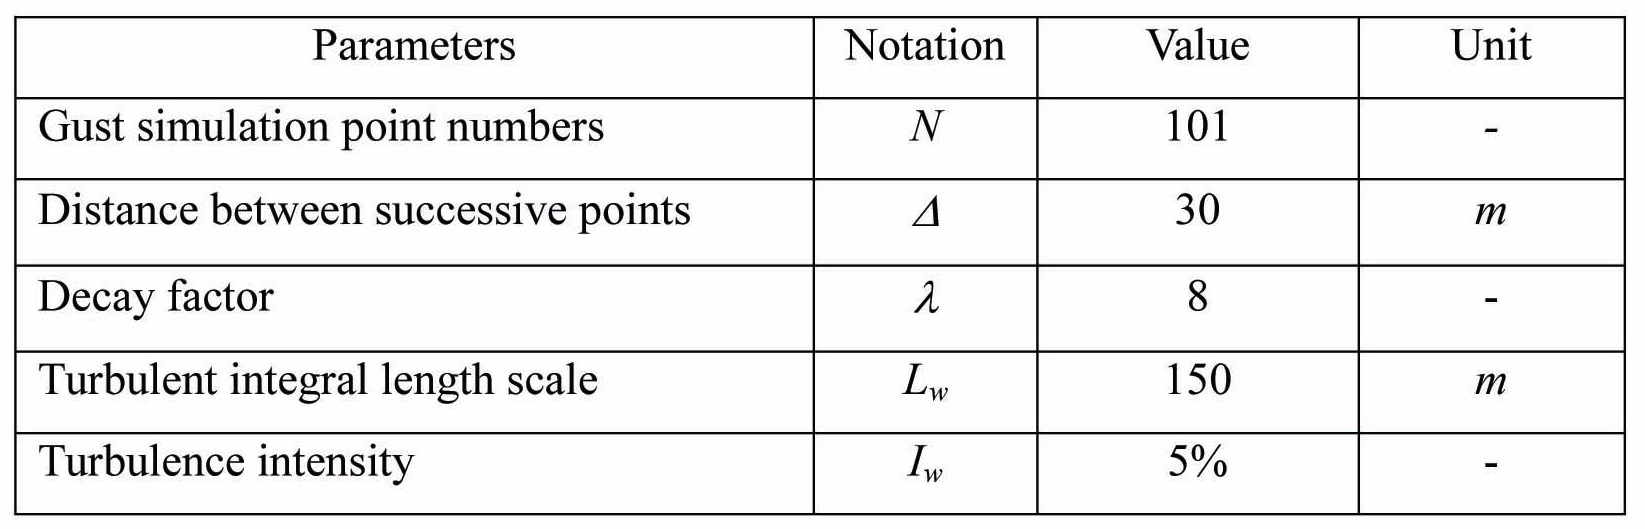
[Table 6.] Characteristic values of the wind field simulation

Characteristic values of the wind field simulation
bending and torsion were examined. The lateral mode was not considered. The response calculation was conducted based on the modal analysis with the second order equations of motion composed of one of the bending modes and one of the torsion modes.
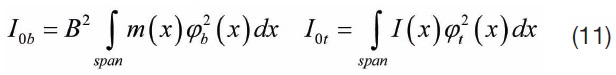
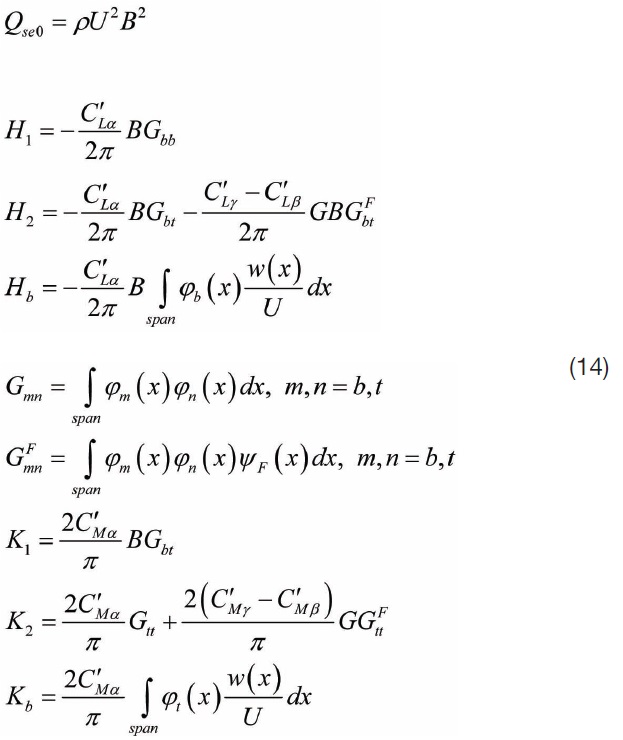
Referring to Eqs. (1), the equations of motion in modal analysis become
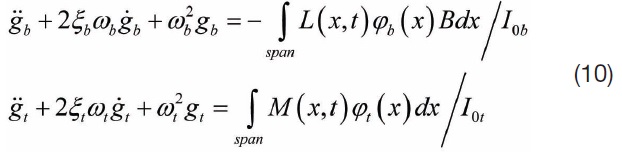
where
The buffeting forces and the self-excited forces are the sum of the forces on the bridge deck and the flaps.
By replacing
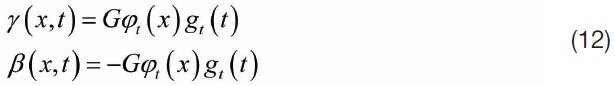
In Eqs. (12), the coefficients
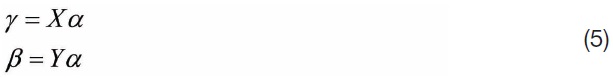
Bridge deck motions are assumed by the combination of one bending mode and one torsion mode, bending and torsion of bridge deck are defined by the Eqs. (9) and (10). If the flap angles are derived by Eqs. (12), the equations of motion for the full span of the bridge are:
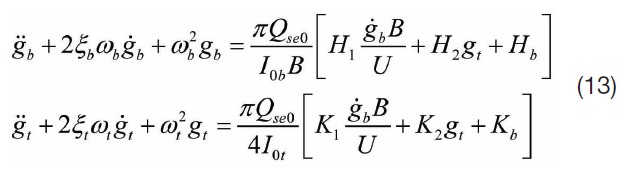
where
[Table 7.] Critical speeds ? without flap

Critical speeds ? without flap
where
At first, the critical speed of the bridge deck without controlling was checked. The result is shown in Table 7. In which, modes(
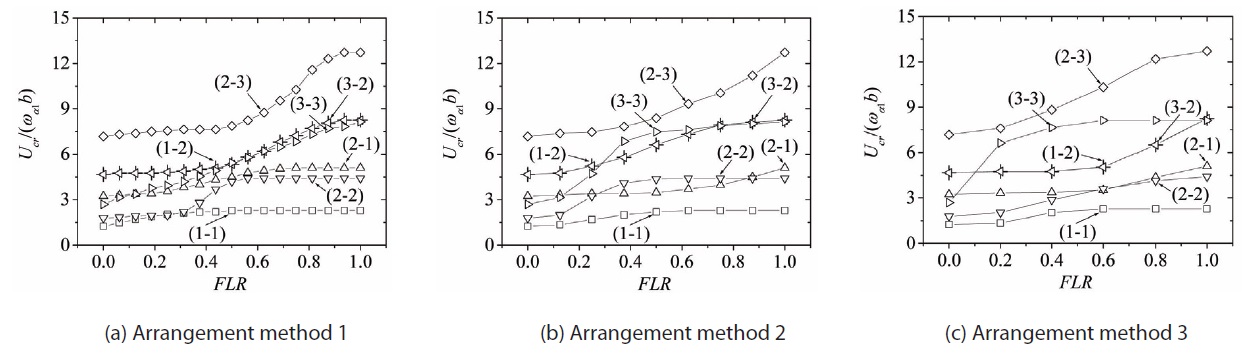
The critical speeds were checked for the arrangement methods with a variation of the flap length ratio, and modes(
The arrangement method 1 could increase the flutter speeds of the modes(2-2) up to 4.19, approximately 2.34 times compared to without control. It was also effective for divergence. Modes(1-2), (2-1), (2-3), (3-2) were the divergence cases. Modes(1-2) and (3-2) were of the same effect, because of the same pitching mode 2. In the real case, the arrangement method 2 is more realistic since the length of the hung cable was long enough to produce the relation motion between the flap and bridge, as discussed above. This method also increased the flutter speed and the divergence speed. The same effect could be seen in the arrangement method 3.
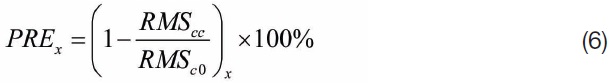
A mechanically turning flap to control the aerodynamic stability was studied with the quasi-steady force approach. We have demonstrated that the quasi-steady force is easy to be applied in the time domain. In the two-dimensional study, the experimental force coefficients and vertical wind gust were used to both simulate and find the best control. The amplification factor
- The quasi-steady force was reasonably accepted to
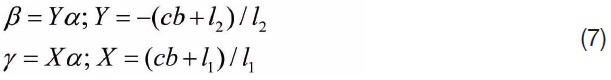
investigate the efficiency of the amplification factor G. The control manner for the leading-edge flap and the training-edge flap such as γ = Gα and β=-Gα can be easily set up in a real case. The positive values of G can be applied to suppress the buffeting response and improve the flutter speed or to improve the aerodynamic stability of the bridge deck. The negative values of G had the reverse effect. The numerical results using the experimental frequencies and damping ratios were compared to the experiment cases to check the efficiency of the flap control and to validate the quasi-steady force method.
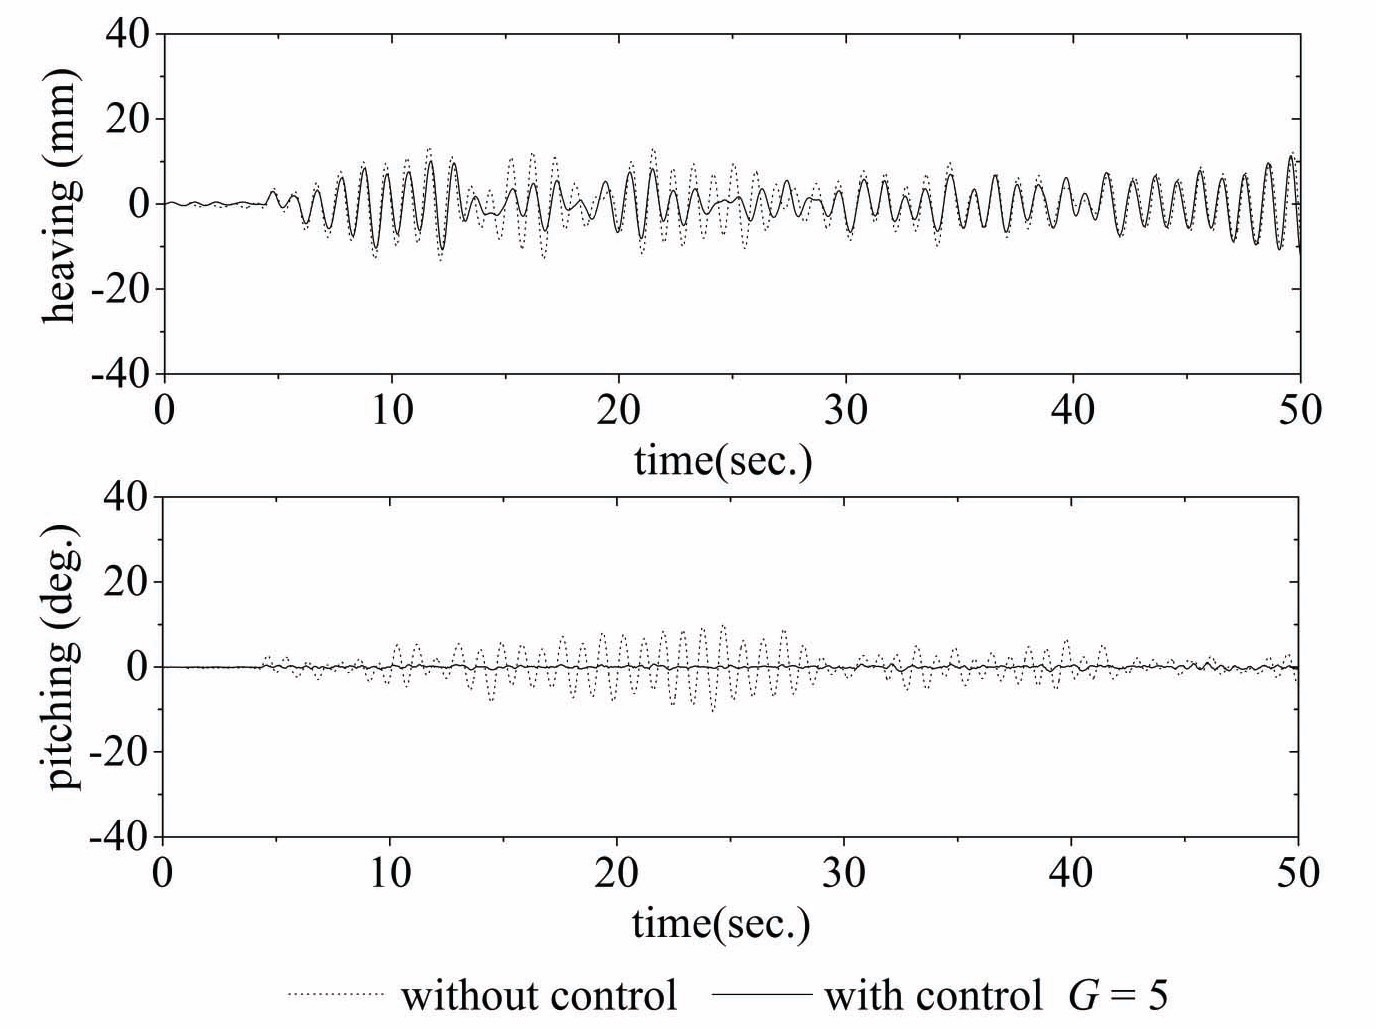
- In a turbulent flow, control by G = 5.0 also improved the flutter speed approximately 2 times and suppressed the divergence phenomenon up to its wind speed. Buffeting in the pitching motion was effectively suppressed but the heaving motion was not.
The quasi-steady force method was also applied for full span bridge to check the efficiency of the flap control. Effects of the flap location, the flap length, and the mode shapes on the control were investigated. The mode-by-mode technique of coupled motions was considered. The flutter speed and the buffeting response for with and without the control were computed. The parameters used in the numerical analysis were the same with those in the two-dimensional cases. The following results were found by the mode-by-mode technique:
- The flaps installed for about 50% of the span length could increase the flutter speed of the modes(1-1) up to approximately 1.8 times.
- For divergence, the passive flap control was proven to be effective.