A digital holographic display is a type of display technology that provides full depth information for real objects. The optical field of an object can be recorded and stored in a digital device such as a CCD camera or optical sensor, with the capability to transfer and display it at any time and place. In a digital hologram, reconstruction devices can only be used for a phase hologram or an amplitude hologram, but not both at the same time. Previous reports have proposed several methods that use a spatial light modulator (SLM) to reconstruct a complex hologram. Such complex reconstructed holography with an SLM may use either of two methods: two SLMs [1-3], or a single SLM [4-6]. The method with two SLMs uses a coupled phase and amplitude for each SLM set up on both sides of a beam splitter, for combination into a complex hologram. This solution provides a full-display complex hologram with high spatial resolution, but coupling the two displays with pixel accuracy is very difficult. Using the second method, with a single SLM, some researchers attempted to overcome the pixel-matching problem by using a phase-modulation hologram [4] or an amplitude-modulation hologram [5], or both imaginary and real parts of a complex hologram with two small windows and a 4-
In this paper we show how to overcome the constraints of complex holography by using a 4-
The proposed method is based on a 4-
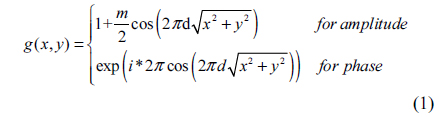
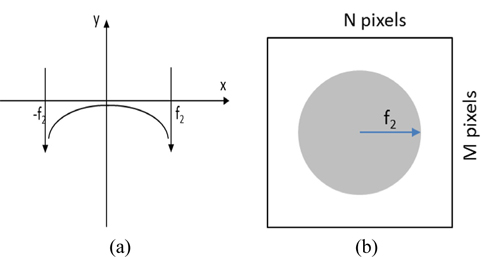
The diffracted light after the circular grating is shown in Fig. 1(b). Prior to formulating the mathematical proof of our proposal, we calculated the Fourier transform of a circular cosine function.
Assume that the circular cosine grating function in Fig. 1(b) is

or
where
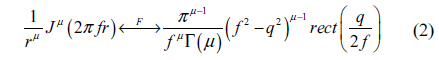
where and . From Spiegel

Thus the Fourier transform of the circular cosine function is
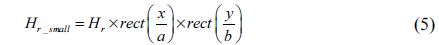
The principle of the proposed method is described in Fig. 1(e): a 4-
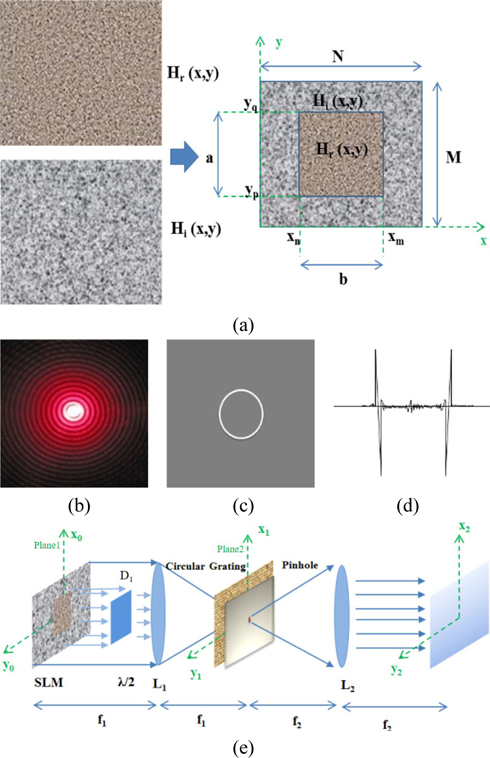
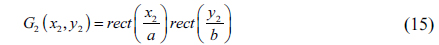
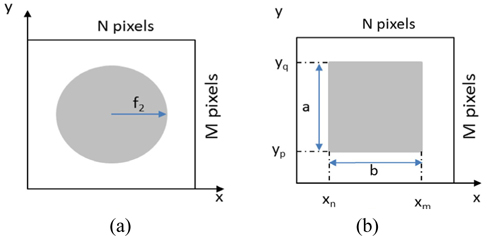
On the SLM, the input hologram is divided into two parts, as shown in Fig. 1(a), with the outside area displaying the pixel values

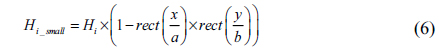
with
The reflected light from the

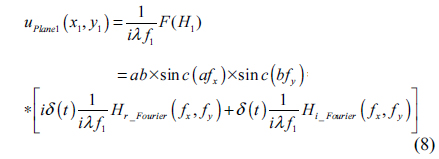
The function of the light after lens

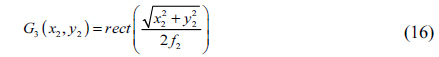
From this, the light after the circular grating has the following function:

where .
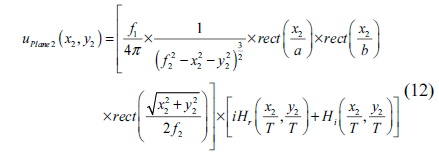
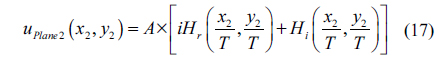
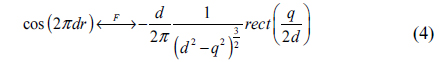
The function for the light after lens
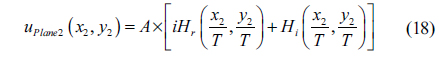
From Eq. (4), we have the function of light after lens
where and .
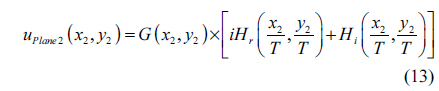
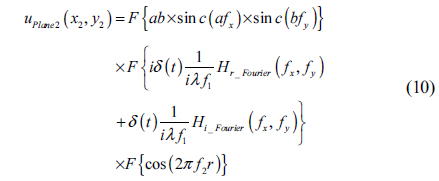
This can be rewritten as follows:

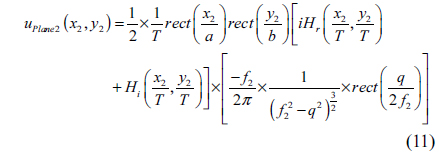
Then

From this function, we see that
Therefore, if the output of this system is a complex hologram, then the parameter


Among these three components, the function
Because
• First case:

where A =
•

where A =
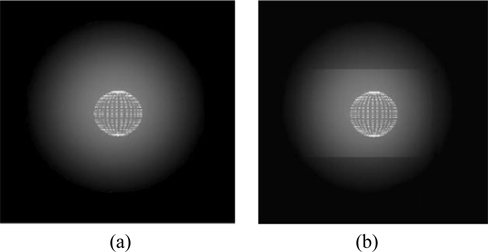
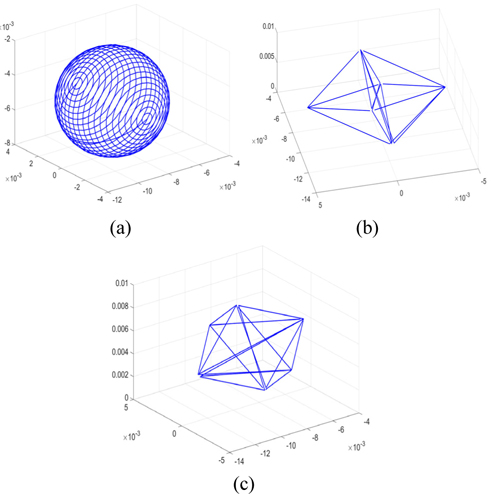
In this section we give simulation results from the Matlab program. The simulation parameters are described as follows: The object was created in Matlab as a spherical object or polyhedron, as shown in Fig. 4, with 104 object points, 5×10⁴ object points, 105 object points, and 5×10⁵ object points. The wavelength of the laser was 532 nm. The size of the hologram was 1200×1920 pixels. The focal length of lens
3.1.1. First Case : a ≥ f2
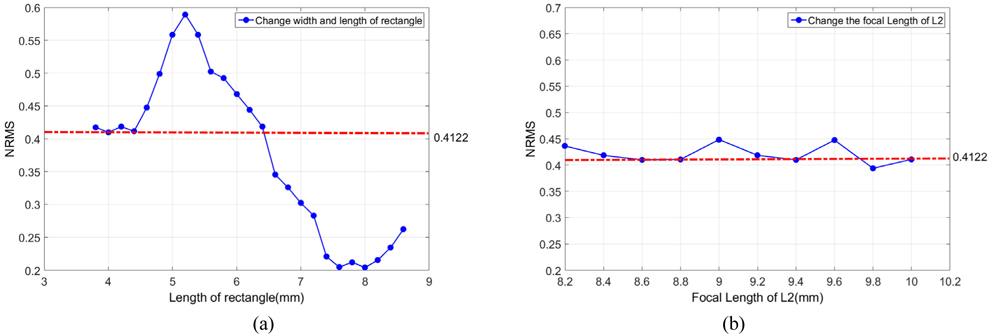
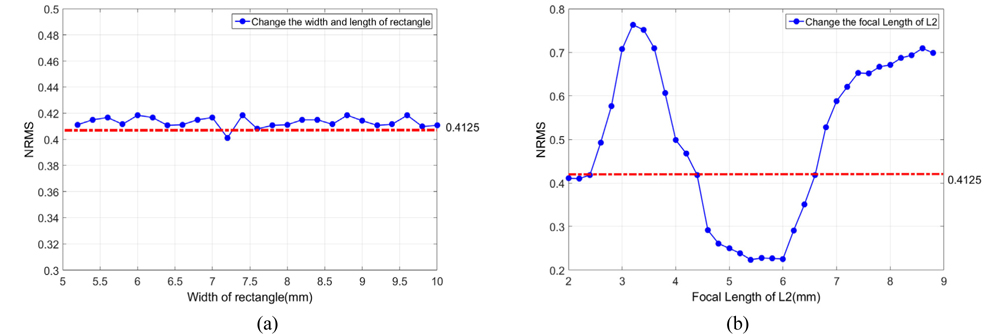
The width of the SLM was 16.39×0.56 mm2. Figure 5(a) describes a normal root mean square (NRMS) error for reconstructing the object, depending on the parameters
3.1.2. Second Case: a2 + b2 ≤ f22
If the ratio of the rectangle depends on the width and length of the SLM to satisfy this condition, the maximum values are
The simulation of the reconstructed hologram is shown in Fig. 7, for a spherical object of 104 points.
3.2.1. Using a Quarter-wave Plate for D1
In the experiment, a laser of wavelength 532 nm was used; the focal lengths of lenses
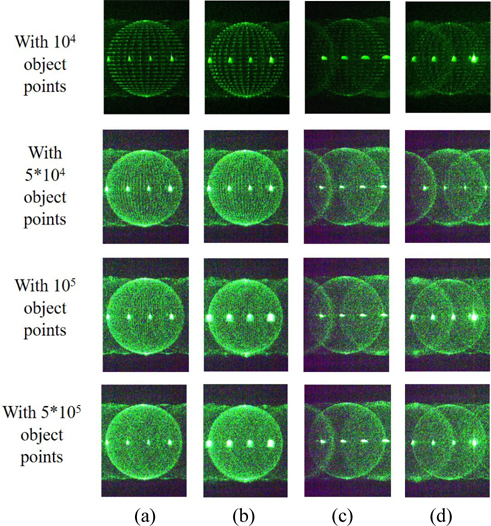
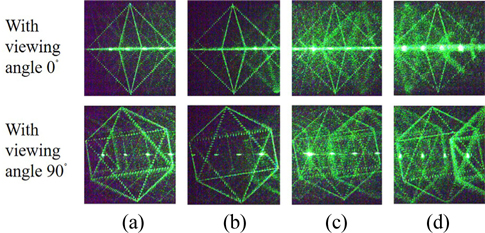
Figure 8 shows the reconstructed holograms of spherical objects with 104 object points (Fig. 8(a)), 5×10⁴ object points (Fig. 8(b)), 105 object points (Fig. 8(c)), and 5×10⁵ object points (Fig. 8(d)). Moreover, these reconstructed holograms shown in Figs. 8 (a), (b), (c), and (d) were obtained by applying respectively the techniques of the first case, second case, previous 4-
Figure 8(d) shows that the reconstructed original phase hologram has better overlap with the object points than does either the proposed method or the previous 4-
3.2.2. Using Thick Glass for D1
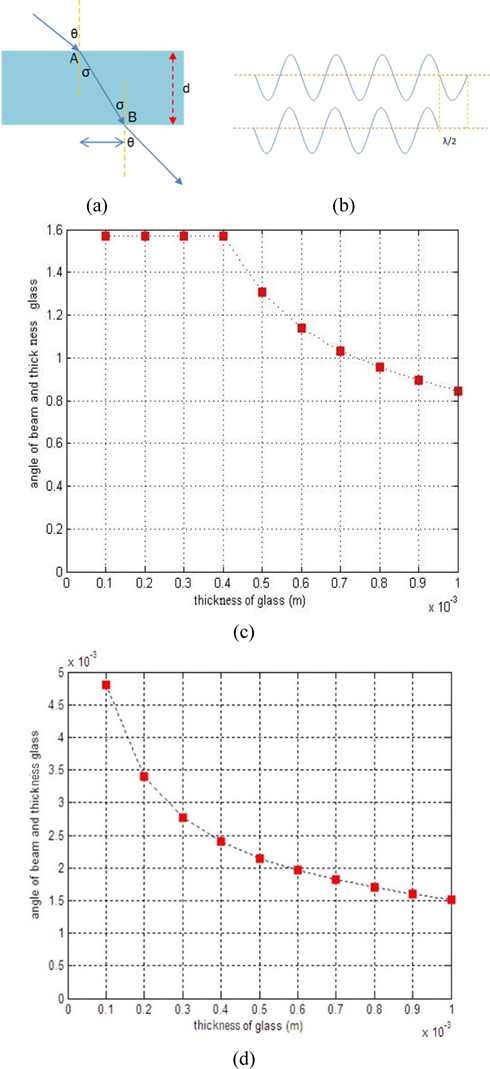
A thick glass device changes the phase of light that passes through it. We used this property to calculate the phase change between light passing through thick glass and light not passing through it. We assume that the thick glass has a thickness
In this figure we see that the light passing through the thick glass travels a longer distance than the light that does not pass through it. This distance is described as

For incident light passing through the thick glass and light not passing through to have a phase difference of π/2, the distances traveled must differ by an odd number of half-wavelengths:

where
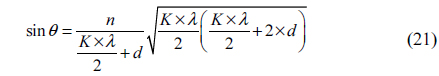
From Eq. (21), when
In Fig. 10 an experiment was conducted with the wavelength of the laser at 532 nm, where the refractive index of the glass was
Figure 10 shows the reconstructed hologram of a polyhedral object with two different viewing angles of 0˚ and 90˚. The parameters in the first and second cases were similar to those for a spherical object. This shows that the quality of the reconstructed hologram was better than with either the previous method or the original phase hologram.
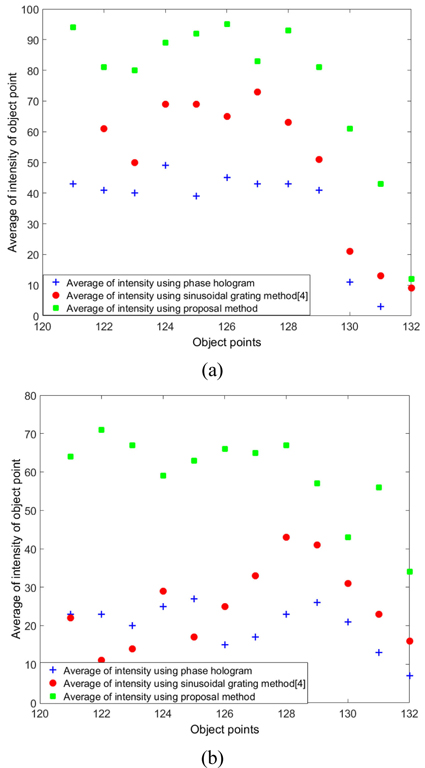
Figure 11 shows the average of the intensity of ten object-point layers from 121 to 132 of the reconstructed hologram from three methods: the reconstructed original phase hologram, a complex hologram using a sinusoidal grating method, and the proposed method. Figure 11(a) shows the average intensity of the object points from layers 121 to 132 of the reconstructed hologram for a spherical object using quarter wave plate. It can be seen that the average intensity of object points with the phase hologram was mainly in the range from 30 to 40, while with the sinusoidal grating method it was mainly in the range from 50 to 60, and from 80 to 100 with our proposed method in the second case.
Figure 11(b) shows the average intensity of object-point layers from 121 to 132 of the reconstructed hologram of a polyhedral object. In this figure the intensity of the object points in the original phase hologram was mainly in the range from 10 to 20, whereas with the sinusoidal grating method it was in the range from 20 to 40, and in our proposal method using thick glass with
Figure 8, 10, and 11 confirm that the quality of the reconstructed hologram for a spherical object using the proposed method is better than the quality of either the original phase hologram or the hologram obtained by the previous method using the 4-
In this study we proposed a method to display a full-display complex hologram with a single SLM and a circular grating, and demonstrated it experimentally. By calculating the difference between the size of the area of the changing phase of the hologram and the SLM, we were able to generate a complex hologram through a 4-