The automotive lighting system is an important part of a vehicle, for the driver’s safety and comfort. Recent development of car headlights has been focused on improving the driver’s emotional satisfaction. For example, intelligent headlamps, such as AFS (adaptive front-lighting system), and matrix headlamps [1, 2], have been studied and developed, and can be used to reduce the glare that an oncoming driver may experience, as well as to enhance the illumination needed by the car’s own driver. In addition, it is necessary to reduce the color lines at the cutoff line; for example, the bluish line caused by high-intensity-discharge headlamps should be removed, using an appropriate optical design. The range of color coordinates in the illumination area of the headlamps is defined by regulations, the SAE and ECE white limits (SAE, 1995; ECE, 2001) [3]. In spite of the fact that color dispersion at the cutoff line is not dealt with in these regulations, reduction of color lines has been requested by car makers for better driver satisfaction.
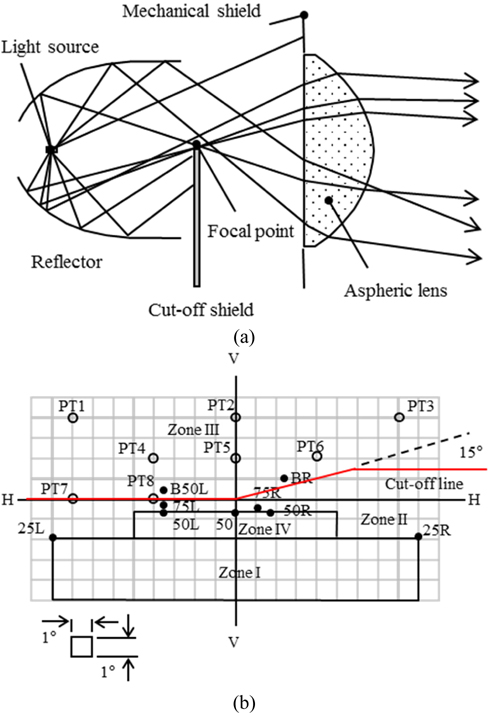
Figure 1(a) shows a schematic optical structure for a typical projection headlight. The light emitted from the source, which is located at one of the two foci, is collected on the other focus via the quasiellipsoidal mirror. This focus is the same as the focal point of the aspheric lens, realizing parallel rays after departing the lens. However, the rays incident on points near the focus of the aspheric lens are spreading along horizontal or vertical directions. In the case of the low beam emitted from a car headlight, there is a legal regulation that defines the intensity test points, and the headlight should satisfy the standard for the intensity distribution.
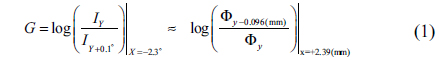
Figure 1(b) shows the intensity test points in the candela space, according to the ECE-R112 regulation [4]. Regarding the cutoff line in the figure, the intensity should be dark above this line and bright below, i.e. the intensity gradient should be very large along the cutoff line. As one specification for the intensity contrast at the cutoff line, the minimum value for the intensity gradient at X = −2.3°, which is the glare index G, is prescribed to be G = 0.08 in SAE and 0.13 in ECE [5]. To form this cutoff line, a cutoff shield is located near the focus as an aperture stop to absorb light.
From the viewpoint of a car maker, reducing weight, number of components, and material cost have been very important in developing headlights with new optical designs and functionality. One approach is to switch the lens material from flint glass to plastic, and polycarbonate (PC) has been preferred over acrylic materials because of its high thermal stability. However, a PC lens sometimes suffers from color separation at the cutoff line due to the inherent dispersion of the material, i.e. the substantial dependence of its refractive index on the wavelength of light. Reducing this color dispersion by adopting an appropriate optical structure is necessary for using PC lenses in car headlamps.
Optical simulation has been an important tool for developing and optimizing the optical structures of automotive lighting systems [6, 7]. This study aims at the optimization of the shield geometry at the cutoff shield for a projection headlight, to realize a high intensity gradient and low color separation at the cutoff line. For this purpose, we adopt a PC-based aspheric lens. The performance of the proposed Petsval-surface-based shield is compared to those of previous flat or cylindrical shields using the ray-tracing technique. In particular, cutoff characteristics of the intensity and degree of the color separation are analyzed and compared in detail.
II. DESIGN STRATEGY: CONSIDERATION OF CUTOFF INTENSITY AND COLOR FORMATION
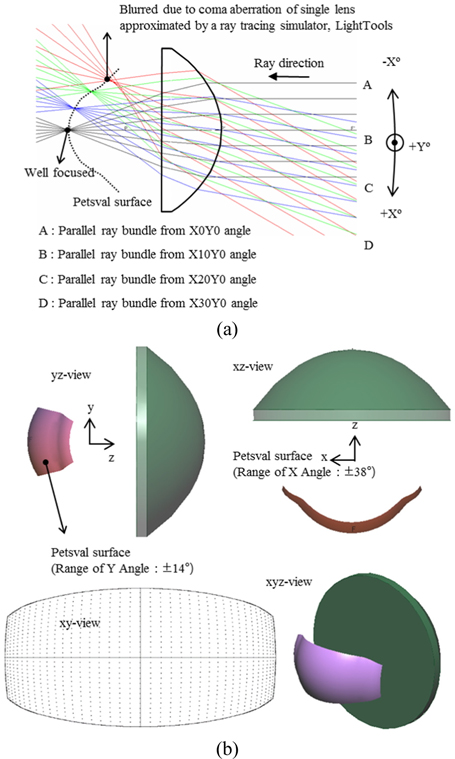
Understanding the Petsval surface of an aspheric lens is important for an analysis of the formation of the intensity gradient and color distribution at the cutoff line. The Petsval surface can be considered as the three-dimensional (focal) curved surface consisting of the focal points formed by the lens, depending on the angle of incidence of the oblique parallel ray bundle incident upon the aspherical surface of the lens. That is, there is a functional correspondence between the three-dimensional coordinates (
The Petsval surface of an aspheric lens with a diameter of 70 mm and a focal length of 40.187 mm can be obtained by using a ray-tracing simulation technique, as shown in Fig. 2(a). In this figure A, B, C, and D denote the parallel ray bundles at illumination angles of (0°, 0°) (abbreviated as X0Y0) and X10Y0, X20Y0, and X30Y0 respectively, which were incident on the lens from the opposite side, i.e. the front side of the headlight. In this study we obtained the three-dimensional coordinates of the focal point of each ray bundle by positioning an illumination receiver near the focal point. The “calculated best focus” option in the commercial ray-tracing software (LightTools v. 8.2 [8]) was used for this process. Focusing the ray bundles was easy for paraxial rays, but the rays incident at high angles contributed to blurring, due to coma aberration. Accordingly, the Petsval surface obtained in this way may be considered to be approximate. Figure 2(b) shows the shape of the approximate Petsval surface. The X and Y ranges were chosen to be −38°−38° and −14°−14° respectively, by considering the necessary intensity distribution of the low beam required by the specification at the design stage. The angular resolution of the incident parallel ray bundle was 2° and 1° for the X and Y directions respectively. The inflection points at the right and left ends of the Petsval surface in the
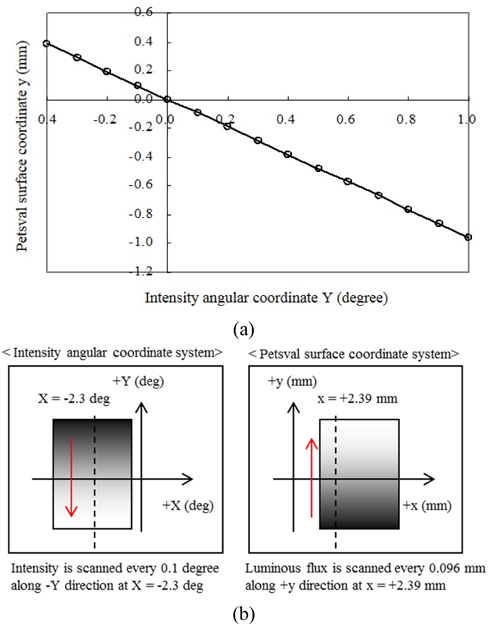
Figure 3 shows the linear relationship between the intensity angular coordinate system and the Petsval surface coordinate system in the candela space. Figure 3(a) shows the linear relationship between Y and
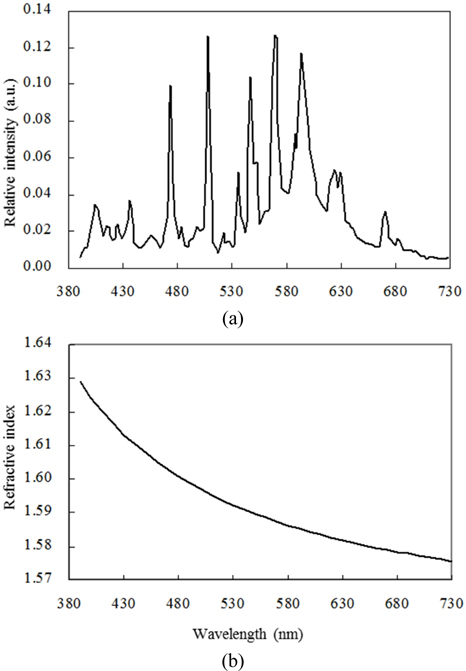
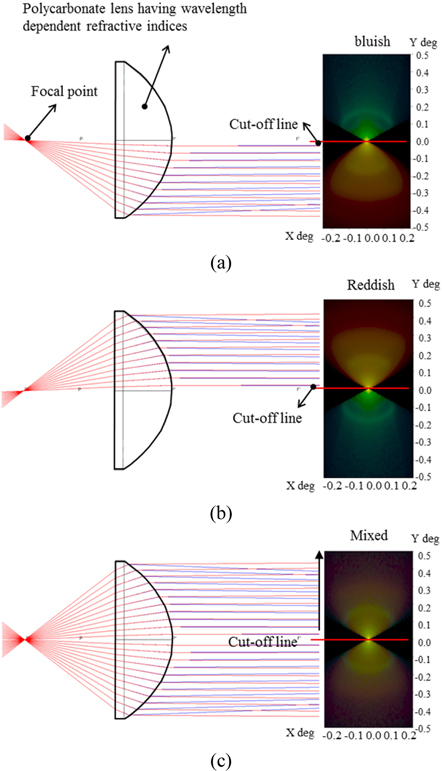
We carried out ray-tracing simulations for a point source located at the focal point of the lens under different emission angles, to investigate the color separation at the upper part of the cutoff line. Figure 4 shows this ray-tracing process. The emission spectrum of this point source is shown in Figure 5(a), which is a typical spectrum for an HID lamp. The dispersion of the refractive index of the PC lens is given by the Raurent model, as shown by Eq. (2) and in Fig. 5(b).
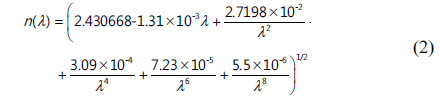
The unit of wavelength in Eq. (2) is μm. According to the simulation result, it was found that the rays headed toward the lower part of the lens contributed to the bluish color above the cutoff line (Fig. 4(a)), while the rays headed toward the upper part of the lens contributed to the reddish color above the cutoff line (Fig. 4(b)). This is mainly due to the chromatic aberration of the PC lens, which cannot be avoided unless the PC is replaced with a low-dispersion material. Therefore, the only way to minimize the color-separation problem is to use color mixing of the rays incident on the lower and the upper parts of the lens, as shown in Fig. 4(c). This result indicates that the degree of color separation may be altered, depending on the
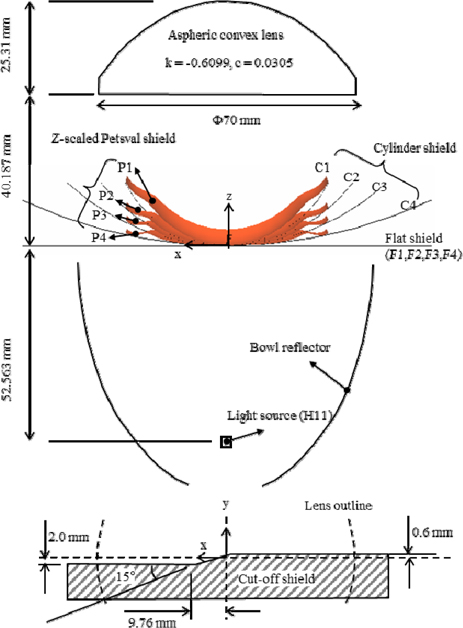
Figure 6 shows the simulation model of the projection headlight lamp. The geometric shape was constructed using the model “PES low beam; variable weights” in the ray-tracing simulator LucidShape [9]. H11 source modeling was used for the light source, the emission spectrum of which is shown in Fig. 5(a). The correlated color temperature was 3200 K, and the corresponding color coordinates were
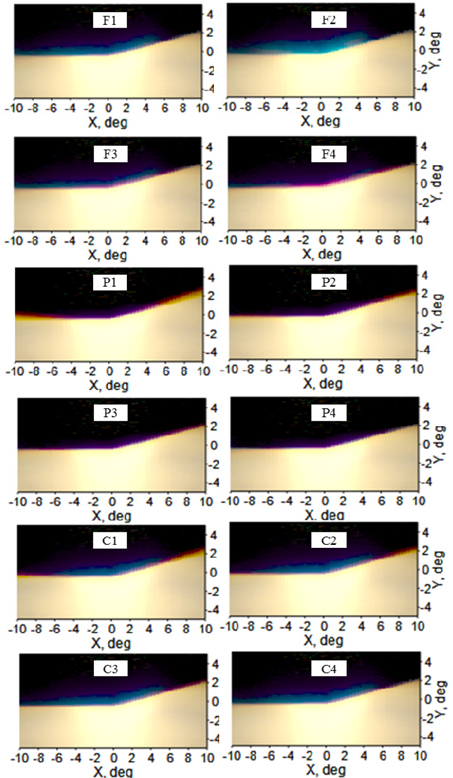
We chose 12 cutoff-shield geometries in total, i.e. 4 flat shields, 4 Petsval-surface-based shields, and 4 cylindrical shields. The Petsval-surface-based and cylindrical shields were trimmed to match the shape of the flat shields when they were observed in the
[TABLE 1.] Geometric parameters of the 12 cut-off shields
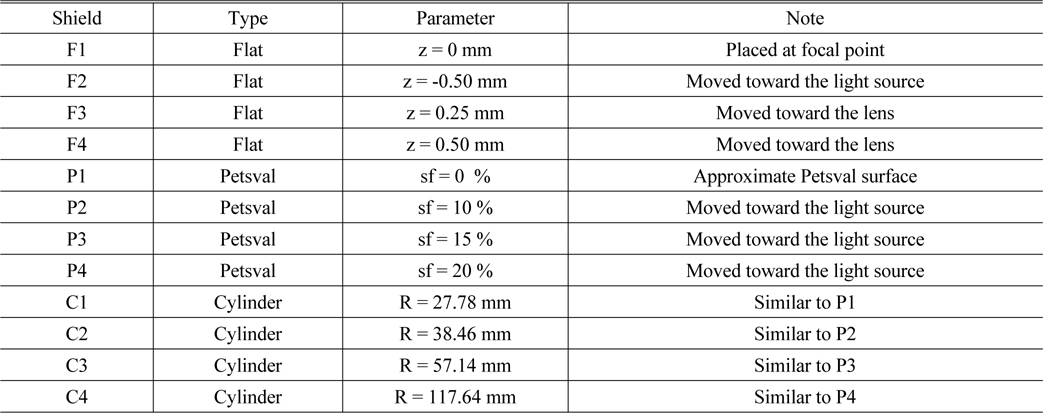
Geometric parameters of the 12 cut-off shields

The reason for scaling the Petsval surface along the optical axis is that the Petsval surface obtained by ray tracing is an approximate surface that includes the blurring effect caused by lens aberration, an effect that can be reduced by increasing the
The ray-tracing simulator used in this study was LightTools (Synopsis, v. 8.2), and the number of rays was 50,000,000. An intensity receiver of the photometric type A was used to monitor the simulation result. The angular resolution of the receiver was 0.3° and 0.1° along the X and Y directions respectively.
Figure 7 shows the extended view of the beam patterns formed by the 12 cutoff shields. As can be seen by comparing the results for the F1, F2, F3, and F4 shields, bluish color separation occurs near the cutoffs formed by shields F1 and F2. F2 was offset along the
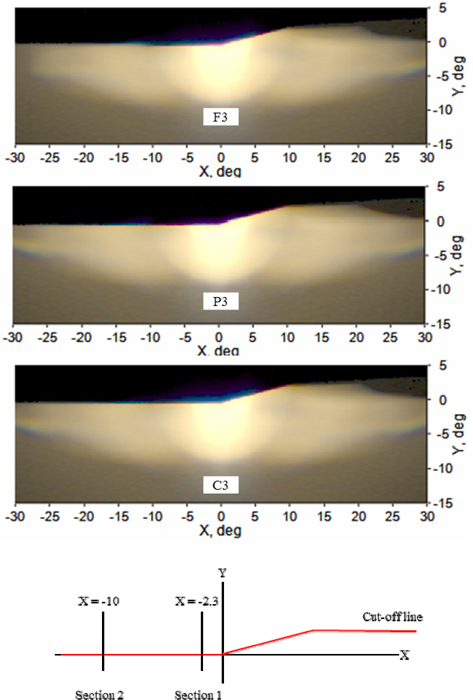
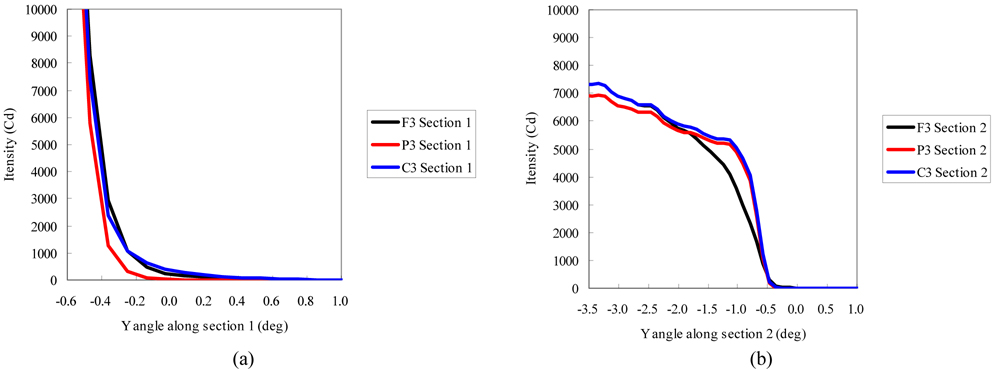
Figure 8 shows the entire view of the beam intensity patterns formed by F3, P3, and C3, which displayed better cutoff characteristics among their respective shield types. The central regions formed by shields F3 and C3 are a bit reddish and bluish, respectively, while that formed by the P3 shield does not produce any noticeable color separation. The horizontal line formed by the F3 shield in the range X = −10−−15° is blurred to some degree, while those formed by the P3 and C3 shields look clearer. The changes in intensity and color coordinates in sections 1 (X = −2.3°) and 2 (X = −10°) were analyzed quantitatively (see the lowest panel in Fig. 8).
Figures 9(a) and (b) show the change in intensity as a function of angle Y for sections 1 and 2 respectively. The P3 shield shows clearer change in intensity at the cutoff, compared to shields F3 and C3 at section 1. In the case of the intensity distribution at section 2, shields P3 and C3 exhibit better cutoff characteristics than F3. Based on Eq. (1), the glare index for shields F3, P3, and C3 was calculated to be 0.45, 0.65, and 0.50 respectively. These results satisfy the minimum value for glare index prescribed in the ECE and SAE regulations. The present study shows only that the cutoff of P3 exhibits the largest gradient; it is not certain, however, what glare index is favorable for reducing the glare that human eyes perceive. The exact evaluation of the glare sensed by human eyes is beyond the scope of this study.
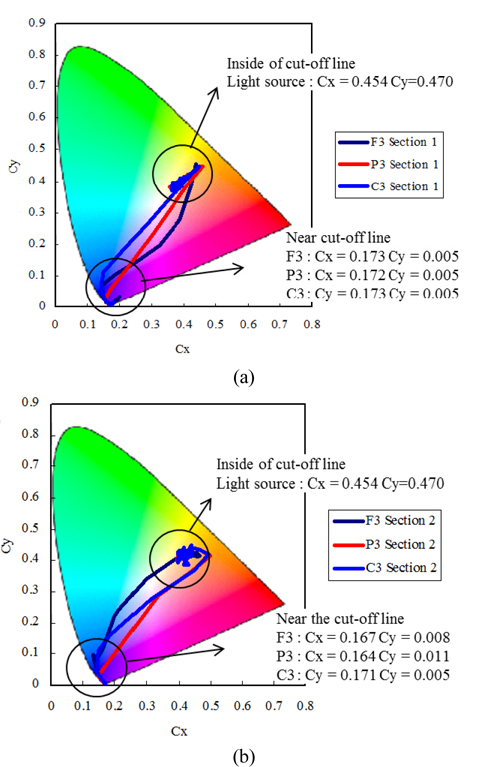
Figures 10(a) and (b) show the change in the color coordinates (
A projection headlight consisting of a bowl reflector, a cutoff shield, and a convex aspheric lens was studied by optical simulation to optimize the shape of the cutoff shield. Four flat, four Petsval-surface-based, and four cylindrical shields were studied by ray tracing. We found that the shield based on a Petsval surface exhibited a clear intensity gradient and less color separation at the cutoff line. Relocation of the shield between the reflector and the lens further improved the cutoff characteristics. This study shows that color separation caused by the dispersion of the lens material and blurring at the offline may be removed by optimizing the shape and location of the cutoff shield in the headlight.