Biochar is a carbon-rich material obtained after the thermo-chemical pyrolysis of organic matter which has wide application as; soil management, mitigation of climate changes, waste management and energy production [1, 2]. Scientific and technological information on biochar has been increasing over the past decades since the discovery that it is the key reason for the sustainable and highly fertile dark earths in the Amazon Basin,
While most of cases using biochar for crop growth have resulted in the increase of root mass, stem height, and fruit productivity, a few cases have shown negative effects on crop growth [2]. Even though many environmental factors such as soil texture, weather, and microbial community may affect plant growth, a certain biochar may contain any compounds that may be harmful to soil microorganisms and may inhibit the growth. Biochar from different feedstocks and process conditions such as pyrolysis temperature may contain toxic compounds such as polycyclic aromatic hydrocarbons (PAHs) and dioxins [4, 5]. Some other contaminants such as potentially toxic elements i.e. trace metals (Cu, Cd, Pb, Cr, Ni, Zn, As, etc) may also be found in biochars [6, 7]. A study conducted on biochar properties regarding to contents of contaminants revealed that biochar from miscanthus was characterised by higher levels of Cd, Ni, Zn and Cr [8].
Fertilizers produced from seaweed has been found to be superior to chemical fertilizers due to its high organic matter content and are more economical [9]. Commercial seaweed extracts such as Maxicrop (Sea born), Algifert (Marinure), Goemar GA14, Kelpak 66, Seaspray, Seasol, SM3, Cytex and Seacrop 16 has been found to stimulate plant growth and increase yield as well as quality of crops [10]. Seaweed applied as farmyard manure repels slugs and other pests. Charred seaweed could have several added benefits to crop growth and yield due to high nutrient contents.
However, so far, the effects of seaweed biochar on plant growth have not been studied. In this study, kelp seaweed biochar (KBC) and fir wood pellet biochar (FBC) were produced and applied in corn cultivation to ascertain their effect on its growth. The cultivation of the corn was done with or without the biochars and/or compost fertilizer. A cell viability study of the biochar extracts at different exposure times and pre-washing conditions of the biochar prior to extraction were also investigated with a representative soil bacterium,
Two different types of biomass, fir wood pellet and kelp seaweed, were purchased from a local market in Daejeon, South Korea. A 40 L aluminium can was used for the pyrolysis of biomass in field. Four square holes (10 cm × 10 cm) were punched in even distribution under the can to allow the passage of air. To produce biochar 500 g of biomass was loaded in a stainless steel bowl with a lid having 7 holes, with each hole having a 0.5 mm diameter. The stainless steel bowls were packed in the aluminium can and heated with wood waste as fuel for about 3 h to char. After charring the biomass, the biochar produced were ground into - 1000 μm to + 212 μm for the entire experiment.
2.2. Characterization of biochar
The elemental compositions of CHON of the raw biomass, biochars as well as washed biochar samples were analyzed using Elemental analyzer (EA1108, Fisons, USA). BET specific surface area and pore volume of biochars were determined on the basis of nitrogen adsorption at 77.3 K by using a Surface Area analyzer (ASAP 2010, Micromeritics, USA). The specific surface area was calculated according to the Brunauer-Emmett-Teller (BET) method. ICP-OES (Perkin Elmer 5300DV, USA) was used for the analysis of metal concentrations in the raw and washed biochar samples. The morphology of kelp seaweed and fir wood pellet biochar samples was observed by scanning electron microscope, SEM (JEOL JSM-6390, USA).
Proximate analyses comprising moisture, volatiles, ash, and fixed carbon content of raw and washed biochar samples were conducted using ASTM D1762-84 Chemical Analysis of Wood Charcoal after modification [11]. The fixed carbon (FC) contents were calculated by subtracting the sum of the ash contents and the volatile matter contents from the dry matter [12].
The pH values of raw and washed biochar samples were determined in a mixture of 0.5 g biochar and 10 mL of deionized water using a pH meter (Thermo Scientific Orion 420A+, USA). To promote effective wetting, 1.5 h equilibrium period was chosen and the samples were kept in a shaking incubator (VISION SCIENTIFIC VS-8480SF, South Korea) at 150 rpm at a temperature of 30 ℃.
The mass of dried water-extractable residues of KBC and FBC were determined by using a biochar to wash water ratio of 1:5, 1:10 and 1:20 w/v. Exactly 6 g of each biochar sample was weighed into three separate 250 mL Erlenmeyer flasks. Deionized water was added in volumes of 30 mL, 60 mL and 120 mL to the separately weighed samples. The flasks were stoppered and macerated for 1 h at 150 rpm at 30 ℃ in the shaking incubator. Separation of wash water from biochar was achieved by centrifugation at 3,500 rpm for 10 min. The supernatant solution was filtered using a 0.45 μm Whatman PVDF syringe filter. To determine the mass of dried residues, 25 mL of filtrate from each washing was evaporated without boiling on a hot plate to incipient dryness in a tarred flat-bottom shallow dish and dried at 105 ℃ in an oven to constant weight. Cooling was done in a desiccator for 30 min, and weighing done without delay.
2.3. Field cultivation of corn
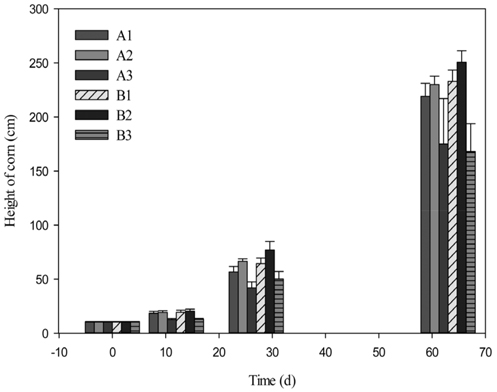
Corn seedlings of average height 10.3 cm and compost fertilizer were purchased in a local market in Daejeon, South Korea. They were planted in the field soil with six different cultivation conditions in the middle of spring. Each condition had 4 - 8 replicates. The conditions were without (A) or with (B) 20 g of compost fertilizer and without (1) biochar, with fir biochar (2), or with kelp biochar (3). The height of corn was measured in a proper time interval within 63 days.
2.4. Biochar and activated carbon extracts preparation
Kelp seaweed and fir wood pellet biochar samples as well as activated carbon as a control were washed by adding deionised water (0, 7.5 mL, 15 mL, 30 mL) to 1.5 g of samples (1:0, 1:5, 1:10, 1:20 w/v of biochar to wash water) and mixed thoroughly by shaking in an incubator for 1 h at 30 ℃ and 150 rpm. The samples were then centrifuged at 3,500 rpm for 10 min and the supernatant solution filtered using a 0.45 μm Whatman PVDF syringe filter. The residues after filtration were dried for 2 h at 100 ℃ after which 100 mg of each samples were weighed into E-tubes. Exactly 1000 μl of deionised water were mixed with respective samples at 150 rpm for 1 h and filtration following centrifugation was done as in the washing step into E-tubes. Each sample was prepared in triplicate.
K-5 microbes were maintained in the laboratory for toxicity test [13] and cultured in 50 mL of BD DifcoTM nutrient broth for 24 h after which they were centrifuged at 4 ℃ for 5 min at 15,000 rpm. Supernatant solution containing nutrient media were decanted after centrifugation and the mass of cells quickly determined. The cells were resuspended in 50 mL of 0.05 M phosphate buffer of pH 7.1 and the optical density at 600 nm was adjusted to be 0.92.
Exactly 100 μl each of biochar and activated carbon extracts were added and mixed with 900 μl of prepared inoculum in buffer and kept at room temperature. The effect of exposure time of microbes to extracts was done at 30 min, 60 min and 120 min time intervals. Also, the effect of each washing condition (0, 5, 10 and 20 mL) prior to extraction was investigated by adding biochar extracts to K-5 for 60 min. Exactly 20 μl of serially diluted mixture of extracts and microbes were plated on BD BactoTM Agar plates by spreading and kept at room temperature for growth observation and counting.
3.1. Characterization of biochar
The raw materials of fir showed typical CHON content and others similar to other wood biomasses in literature [1, 11] as seen in Table 1. However, kelp showed low carbon content and high content of others, which would be mostly inorganic materials. After pyrolysis, the carbon content of fir was increased from 47.2% to 82.4%, while oxygen, hydrogen, and nitrogen were all reduced through the carbonization process. However, in the case of kelp, carbon content was not much changed during the pyrolysis probably due to the presence of high amount of inorganic materials. The H, O, and N of kelp decreased during the pyrolysis, while others increased from 31.16 to 58.63% due to the removal of organic materials. Washing of fir biochar reduced C, H, and N, while washing of kelp biochar reduced N and inorganic materials.
[Table 1.] Elemental analysis data of raw biomass and its unwashed and washed biochar
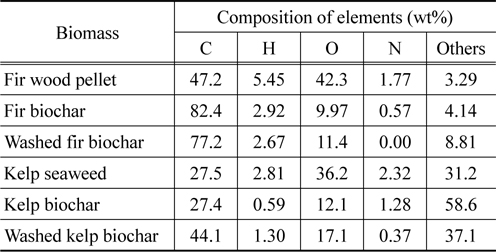
Elemental analysis data of raw biomass and its unwashed and washed biochar
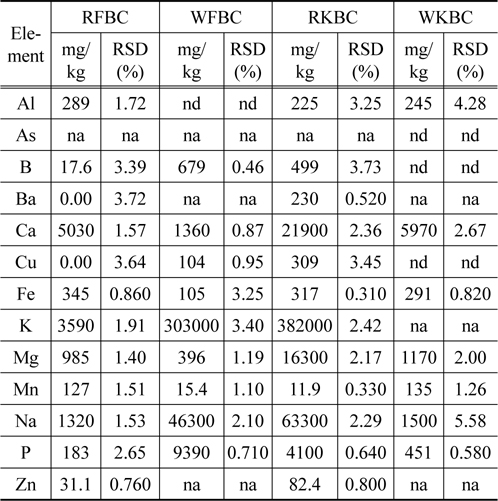
The metal concentrations in raw kelp biochar were high as compared to the raw fir biochar (Table 2). With the exception of Al, Fe, Mn, the concentration of the remaining metals including Cu and Zn were higher in the raw kelp biochar (RKBC) as compared to the raw fir biochar (RFBC). Higher concentrations of most trace metals especially Cu and Zn may have toxic effect. In most cases, the concentrations of trace metals were reduced after washing the kelp biochar.
[Table 2.] Metal concentration in raw and washed biochars measured by ICP-OES

Metal concentration in raw and washed biochars measured by ICP-OES
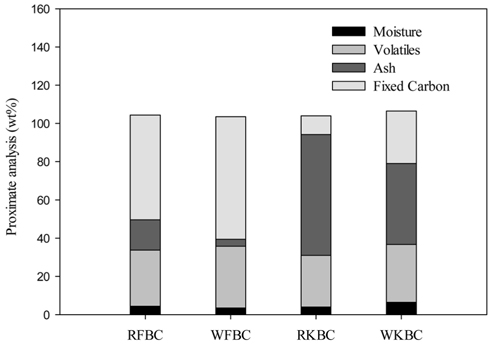
Proximate analysis conducted (Figure 1) showed that RFBC has a higher fixed carbon (54.80 ± 3.49%) but lower ash content (15.82 ± 0.59%) as compared to RKBC which rather has higher ash content (63.19 ± 0.11%) but a lower fixed carbon percentage (9.80 ± 3.28%). Since kelp biochar has higher ash content, the trace metal concentrations were also high as shown in Table 2. Whilst the ash content reduced to 3.65 ± 0.23 and 42.29 ± 0.17, the fixed C content increased to 64.11 ± 0.18% and 27.48 ± 2.61% respectively for the washed fir biochar (WFBC) and washed kelp biochar (WKBC). The effect of washing caused a reduction in metal and salt concentrations, especially in kelp biochar. The volatile matter content for both biochars increased after washing (29.38 ± 2.91% - 32.24 ± 0.05% for FBC and 27.01 ± 3.39% - 30.23 ± 2.78% for KBC). The moisture contents were found to be very low for all biochar samples.
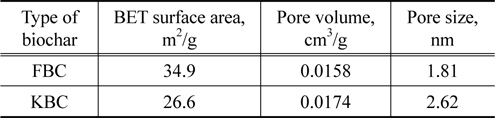
[Table 3.] BET surface area, pore volume and pore size of biochars

BET surface area, pore volume and pore size of biochars
For the various wash conditions of 1 : 0, 1 : 5, 1 : 10, and 1 : 20 w/v of biochar to wash water, the pH of FBC were respectively 6.42 ± 0.03, 6.51 ± 0.02, 6.57 ± 0.02, 6.67 ± 0.03. That of KBC were found to be 9.18 ± 0.01, 9.04 ± 0.03, 8.98 ± 0.01, 8.81 ± 0.02 for the respective wash conditions as stated above. Thus, washing reduced the acidity of FBC and the alkalinity of the KBC (Figure 2). It is noticeable that KBC has higher water extractable residues than FBC which could be due to its high content of mineral salts and that could account for the relatively high pH of KBC.
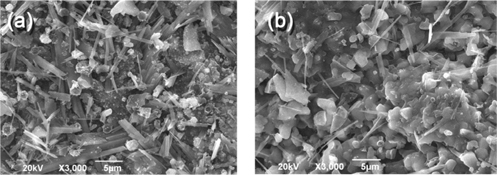
The SEM images of FBC and KBC are shown in Figure 3. It can be noted that the KBC shows relatively high portion of crystal structures with a small organic portion than the FBC which is indicative of the high mineral contents of KBC. A higher magnification of FBC shows spongy-like or fibrous structures with a higher microporosity which was evident in BET specific surface area analysis. The BET surface area of FBC was higher than that of KBC, which is likely because low carbon fraction in kelp biomass could not develop pores enough. Whilst both samples had similar pore volumes, the pore size of KBC was higher than that of FBC.
3.2. Field cultivation of corn
Biochar was positively effective but only when compost fertilizer was added together in the soil for the corn growth, which is reasonable because biochar plays a role in the retention of nutrients (Figure 4). It was observed that FBC increased corn growth by 4.9% without fertilizer and by 7.6% with fertilizer after 63 days cultivation, while KBC decreased it by 20.2% without fertilizer and by 27.9% with fertilizer. KBC has lower carbon storing effects than woody biomass on the basis of the total weight of raw biomass. KBC also showed significant inhibition of corn growth probably due to toxicity caused by higher contents of salts and/or heavy metals. The high concentrations of these alkali metals and alkaline earth metals could be present in the forms of oxides such as K2O, CaO, P2O5 and MgO which could have toxic effect on the growth of maize. The toxic effect of kelp biochar was serious in the initial phase, but recovered at some extent with time, indicating soil minerals mitigated the toxicity.
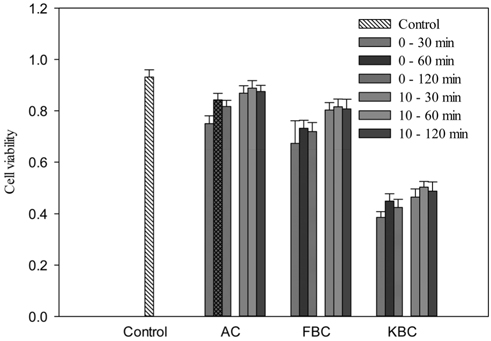
The microbial cell viability tests with water extracts show that KBC has a high level of toxicity than FBC. For activated carbon (AC) and FBC, the numbers of viable cells were not significantly different from the control. Figure 5 indicates that the cell viability at 60 min exposure time was higher than 30 and 120 min. At 60 min exposure time the percent viable cells compared to the control were 90.5% and 95.4% for the 0 and 10 mL washings respectively for AC. The respective values for the 0 and 10 mL washed FBC were 78.6% and 87.6% as well as 48.2% and 54.0% for KBC.
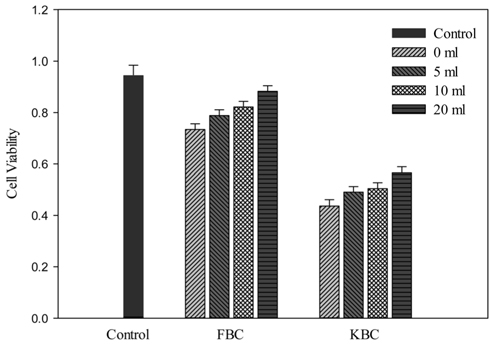
Effect of washing with different amount of wash water prior to extracts preparation shows that the cell viability for the 20 mL wash in all cases was higher than the 10 mL wash which was also better than the 5 mL wash. The 0 mL wash condition had the least number of viable cells for all materials (Figure 6). It could be noted that the higher level of toxicity to K-5 cells from KBC extracts could possibly be due to its higher trace metals or minerals concentration. It seems to be evident that the inhibition to corn growth by KBC was mainly due to biochar toxicity, even though there are numerous environmental factors during field cultivation. Therefore, effective washing pretreatment to potentially toxic biochars such as KBC and sewage sludge biochar [14] before application to soils may help reduce the level of short-term toxicity to soil microorganisms and the negative effect generally on plant growth.
Biochar produced from general wood biomass, FBC in this study, showed the increase of corn growth during field cultivation both with and without additional compost fertilizer. However, KBC showed significant inhibition to corn growth at the initial stage of cultivation and that could be due to higher levels of salt and metal concentrations present in KBC. A comparative toxicity test of extracts from AC, FBC and KBC revealed that whilst the extracts from AC and FBC had a low toxic effect, KBC showed a higher toxicity on