The terahertz region is located between the microwave and infrared regions of the electromagnetic spectrum and covers the frequencies between 0.1~10 THz (1 THz=1012 Hz), corresponding to a wavelength of 3 mm to 30 µm [1]. Owing to the recent technological development, terahertz sources and detection systems have now made a break-through and are currently used in research, engineering and medical fields [2, 3]. The unique spectral position of terahertz in the electro-magnetic spectrum gives it many special properties that are different from other electromagnetic waves, which also makes terahertz a uniquely advantageous detection system in the biomedical field [4, 5].
Consistent with the aforementioned, TeraView, a high-tech company based in the University of Cambridge (United Kingdom), has conducted long-term systematic research on the application of terahertz in tumor diagnosis. Their many research works include the terahertz-based tissue classification, diseased tissue imaging, and analysis of the interaction mechanism between terahertz waves and tissue mass, occupying the forefront of research in the field of terahertz medical diagnosis [5-10]. Similarly, the University of Adelaide (Australia) has carried out extensive work on the application of terahertz systems in the field of biomedical engineering especially in the detection of cancerous and dementia lesions [11]. These include studies on the effects of tissue hydration on terahertz signaling and probing studies of misfolded proteins [12-15].
Prostate cancer is one of the most common malignant tumors in the urogenital system, with an annual increase of 660,000 people worldwide, accounting for 10% of male malignant tumors [16]. Computed tomography (CT), magnetic resonance imaging (MRI), Ultrasonic Testing (UT) and prostate-specific antigen (PSA) testing have been used to identify the shape and size of prostate tumors [17]. However, all these detection methods have their peculiar limitations. For instance, MRI has limitations in detecting some patients with metal stents. Ultrasound testing (UT) has no biological effect of radiation and will not cause harm to the human body. However, the frequency of ultrasound is in the megahertz level, which leads to a wavelength of hundreds of microns. This emission wavelength limits the resolution of the ultrasound image and makes the quality of ultrasound image unable to compare with CT and MRI. At the same time, it is easy to produce artifacts due to sidelobe effects, multiple reflections and gas scattering [18]. Histopathological examination is the internationally recognized and most reliable tumor diagnosis technology [19]. Although the method analyzes the structure and function of the different regions of the sample, it is also time-consuming and to some extent limited by the surgeon’s clinical experience. All these facts clearly indicate that histopathological examination makes it impossible to provide real-time and accurate testing services for the surgical diagnosis and treatment process. Therefore, in the process of resection of tumors, the tumors cannot be accurately located in time, which leads to the failure of complete resection of tumors, and greatly affects the quality of tumor diagnosis and treatment [20]. To this end, exploring new diagnostic techniques for prostate cancer is of great significance in the diagnosis and treatment of prostate cancer patients.
In this work, results of reflective terahertz spectroscopy studies, based on the absorption coefficient and refractive index are reported. A comparison of the prostate tumor with other tissue on the same paraffin-embedded prostate cancer tissue is performed. The absorption coefficient and refractive index of each tissue region were used to classify the tumor, normal prostate tissues and smooth muscle of prostate cancer tissue by principal component analysis (PCA) and least squares support vector machine (LS-SVM). Subsequently, an attempt was made to map up the margins of prostate tumors using terahertz images based on the distribution difference of terahertz reflection intensity and absorption coefficient on the two-dimensional sample space. Four paraffin-embedded prostate cancer tissues were imaged using a THz time-domain spectral imaging system (TeraPulse 4000, TeraView, Cambridge, United Kingdom) in the reflex module. The size and shape of the tumor area were compared with the results of histopathological examination. Results obtained demonstrate the feasibility of the application of terahertz time-domain spectroscopy and imaging technology in the diagnosis of prostate cancer and are thus clinically valuable.
2.1. Patients and Specimen Preparation
In this study, we selected the prostate tissues with canceration in some regions, so that the paraffin-embedded tissue block may contain three kinds of tissues at the same time, including tumor tissue, normal prostate tissue, and smooth muscle tissue, thus ensuring the uniformity of the thickness and the consistency of the experimental environment of each kind of tissue area. Randomized selection of 4 patients with prostate cancer after radical surgery from January 2017 to August 2019 was included in the study from Haikou People’s Hospital. Prostate tissue samples containing tumors that were fixed in formalin and paraffin-embedded were collected from the archives of the hospital.
We need to choose the appropriate sample thickness during the measurements, because too thin a sample will lead to the overlap of the second echo and the first echo, and the absorption effect of the sample to terahertz is not obvious, while too thick a sample will lead to the absorption effect being too large and the echo signal being weak. However, it is worth noting that the paraffin-embedded cancer tissue after dehydration treatment is used in our study, which makes thickness control easier and more convenient than in fresh tissue. We fixed the tissue thickness to 3 mm by adjusting the paraffin-embedded die. For this thickness, the first echo and the second echo can be clearly separated without overlapping, and the interference of the echo can be eliminated by further using the appropriate window function.
Based on the above considerations, 4 paraffin-embedded prostate neoplasms at a thickness of 3 mm were used for reflective terahertz spectrometry and pulse imaging. Then, the sample was sliced at a thickness of 5 μm for histopathologic examination. Based on the histopathological examination, the margins of the cancerous area in the 4 paraffin-embedded prostate cancer tissues were clearly drawn. The study protocol was approved by the Ethics committee of Central South University Xiangya School of Medicine Affiliated Haikou Hospital (Haikou People’s Hospital).
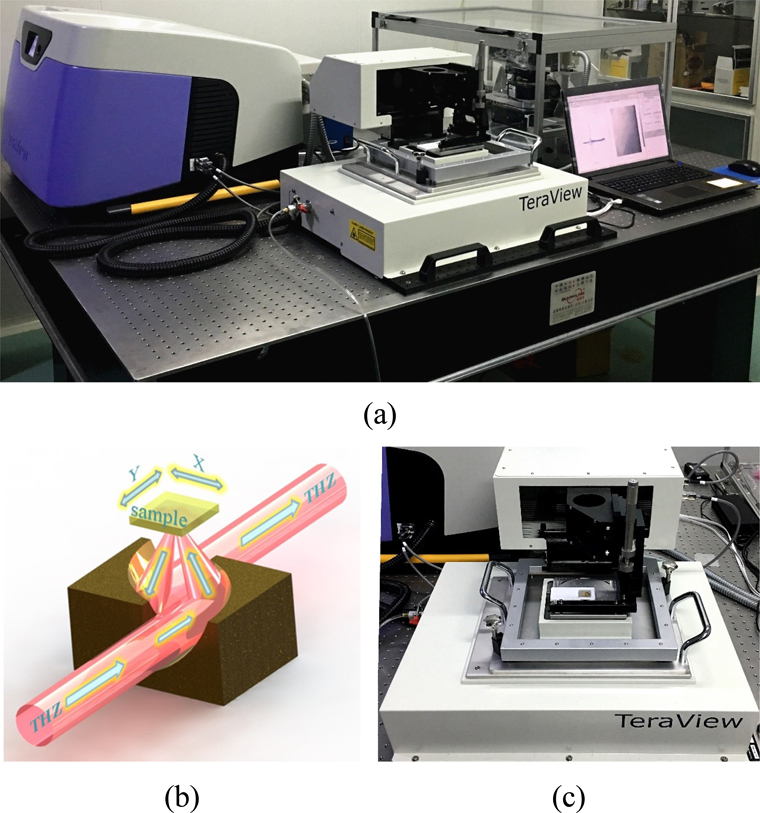
The modular design of the TPI system (TeraPulse 4000, TeraView, Cambridge, England) units can be configured to suit the application and accommodate maximum flexibility in a wide range of experimental conditions and requirements (Fig. 1(a)). TeraPulse 4000 also provides plug-and-play modules with the industry’s biggest scope of proven performance, dependability and functionality in the field, which makes the system easily changeable from the transmission to reflection modes. The system is devised to operate in transmission, reflection or variable incidence geometries to adapt to various kinds of measurement circumstances. The range of scanning up to 1200 ps with a rapid scanning frequency of 50 Hz making the TeraPulse 4000 ideal for high-velocity scanning and imaging for nondestructive testing application. For TeraPulse 4000, the noise level determining the active range of the system is over 90 dB at the peak. A wide and stable terahertz spectrum ranges from 0.06 to 4.5 THz (1 THz =1000 GHz) is sufficient to provide a variety of material analysis and imaging studies. In this research, measurements were performed successively at the Reflection Spectrum Module and Reflection Imaging Module (RIM). Throughout the tests, the samples were placed in a nitrogen (N2) purge sample chamber to avoid the effects of moisture in the air on the experiment.
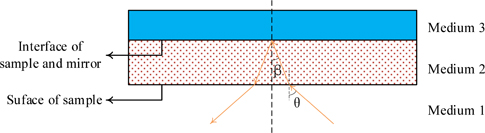
A typical reflective module is used, which has the function of both spectral testing and imaging. For this module, the terahertz beam is focused on the sample along the vertical plane through a parabolic mirror and then reflected by the sample layer, followed by a parabolic mirror to collect the reflected beam. The reflected beam retaining the amplitude and phase information of the sample and sending it to the laser-gated photoconductive semiconductor detector. The terahertz optics are indicated in Figs. 1(b) and 1(c). By amplifying and processing the reflected terahertz signal at each pixel point, a terahertz time-domain image can be obtained, which can be further extended to its frequency domain version by means of Fourier transform.
2.3. Terahertz Imaging and Spectroscopy Data Acquisition
All prostate tissue were tested using a TPI system (TeraPulse 4000, TeraView, Cambridge, England) operating in Reflection Spectrum and Imaging Module (RIM). This module adopts a single-point scanning imaging method. A raster-scanning system that changes the position of the sample through a mobile station in an X-Y plane was used, which allowed the terahertz radiation to pass through the individual points of the sample to be measured. The maximum size of the sample that the system can scan is 20 mm* 20 mm, and the minimum scanning step is 0.1 mm. The axial resolution of our TPI system used is around 30 microns and the maximum lateral resolution is around 250 microns. In this study, the scanning area of the sample was about 15 * 5 mm, the resolution of each point was 0.2 mm, and the diameter of the terahertz spot at the focal point is 0.2 mm, The whole scanning imaging process takes 25 minutes. The terahertz beam was focused on the surface of the sample through a parabolic mirror, and the reflection terahertz signal from the surface of the sample was obtained. By focusing the terahertz beam on the back surface of the sample and adjusting the optical delay appropriately, we were able to get the deep reflection terahertz signal of the sample. Also, by amplifying and processing the reflected terahertz signal of each data point, we were able to obtain the terahertz image and the optical parameters (refractive index and absorption coefficient) at each point of the sample.
2.4. Histopathological Examination
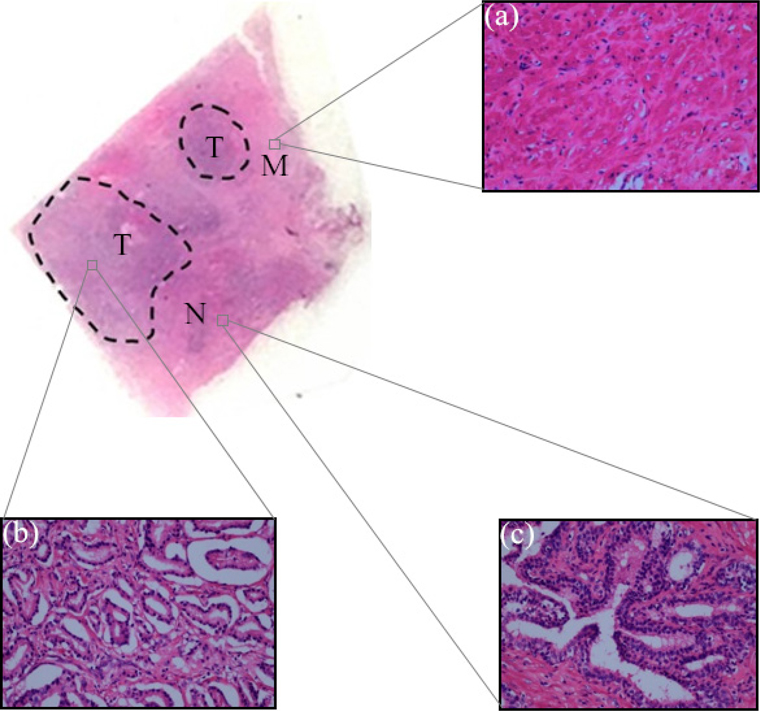
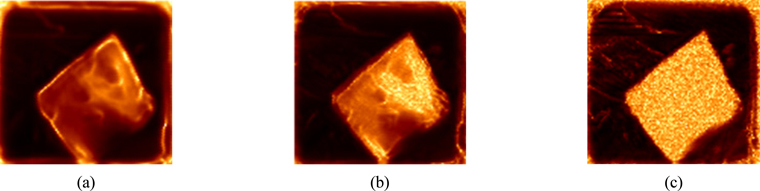
A 5 μm thick tissue sheet along the cross-section of the paraffin-embedded sample was cut and fixed to the surface of the viscous slide for H-E staining. The H-E staining results are shown in Fig. 2, where Fig. 2(a) is a microscopic image of smooth muscle staining. The normal prostate cancer is composed of large and branched acinar with epithelial papillae in the lumen, so the shape of the lumen is often an irregular plum blossom. Under low magnification microscopy, normal prostate acinar has lobulated structure and fibrous smooth muscle interstitial segmentation between lobules. Results indicate that there are concentric circles of amyloid bodies in the glandular lumen, as shown in Fig. 2(b). However, prostate cancer lacks the above-mentioned normal structural features and are mainly composed of small acinar structures. The volume of cancerous glands is obviously smaller than that of normal acini and most of them are round and oval. The outline of cancerous glands is clear, and there is no intraluminal papilla. Usually, the margin of the glands is relatively flat and there is no amyloid body in the cavity. This small acinar hyperplasia is the most common structural feature of prostate cancer, with the decrease of differentiation degree of tumors; the proliferated small acinars are back-to-back, wall-to-wall and bridge each other, forming a large group of fused acinars. The outline of a single gland is no longer clear, and only a lot of small sieve-like glands lumen are retained, as shown in Fig. 2(c).
2.5. Optical Parameter Extraction
The smooth muscle, normal prostate, and tumor tissue regions of each sample were determined according to H-E staining. Using the terahertz spectroscopy data obtained by scanning on the X-Y plane, we were able to extract the refractive index and absorption coefficient of each point of the sample in the terahertz band. To this end, the conventional terahertz time-domain spectroscopy optical parameter extraction methods were used to obtain the optical experimental parameters such as the refractive index and the absorption coefficient of the specimen.
Assuming the initial terahertz pulse waveform is
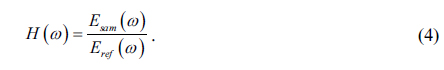
In order to obtain the frequency-dependent optical constant of the sample, the terahertz time-domain waveform needs to be Fourier transformed to obtain its frequency domain waveform


where
(Transmission coefficient at the a - b interface, the incident angle is θ),
(Reflection coefficient at the a - b interface, the incident angle is θ),
(Propagation coefficient in the medium a over a distance l).
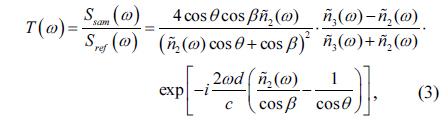
By dividing the signal light from the reference light, we can easily obtain the transmission spectrum of the sample [21, 22]:

Substituting the expression

where

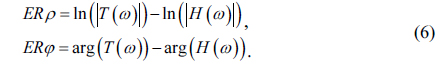
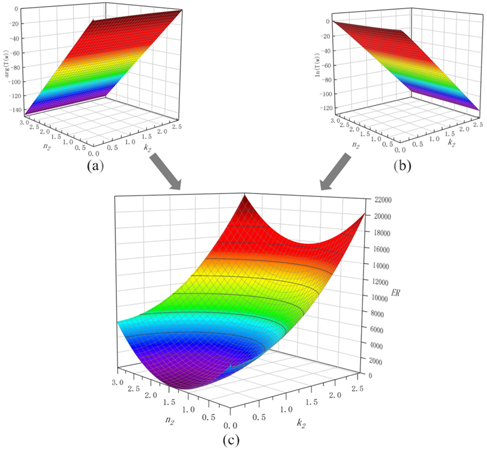
Combined with the experimental results, the error function can be drawn as Fig. 4.
2.6. THz Spectrum Analysis Technology
When the measured substance has a significant difference in refractive index and absorption coefficient in the effective THz band, it can be used as the basis for substance identification. However, in the actual detection of complex materials, there is no considerably stable difference in the refractive index and absorption coefficient. In addition, the terahertz spectral data has a high dimension. If the spectral data is not dimensionally reduced, the classification effect may be poor. Therefore, pattern recognition of these materials requires first dimension reduction and feature extraction of the original data. In this paper, Principal Component Analysis (PCA) is used to extract the THz frequency domain spectrum and combined with the Least Squares Support Vector Machines (LS-SVM) to classify the terahertz spectral data.
The Principal Component Analysis (PCA) method transforms the parameter variables at several hundred frequencies in the terahertz optical parameter spectrum into several principal components by using dimensionality reduction technique and uses these principal components to replace the original data to characterize the physical properties of the prostate tissue samples. This helps to grasp the main contradictions of the research objects and to simplify the problems.
Support Vector Machine (SVM) is a supervised learning method first proposed by Cortes and Vapnik [23]. It shows many unique advantages in solving nonlinear relations, small sample statistical classification or regression analysis [24, 25]. The basic idea of SVM is based on the principle of structural risk minimization induction and VC dimension and seeks the best compromise between model complexity and learning ability based on limited sample information to achieve the best promotion ability. The -LS-SVM used in this paper is a new support vector machine method proposed by Suykens and Vandewalle [26]. It is a functional extension to the standard SVM, which is used to solve problems such as function estimation and pattern recognition. LS-SVM uses the least-squares linear system as the loss function instead of the quadratic programming method adopted by SVM. Therefore, the complexity of the algorithm is greatly reduced and the computational efficiency is improved.
2.7. THz Spectral Imaging Technology
The terahertz image can be reconstructed based on the distribution of the reflected terahertz signal and the absorption coefficient in the two-dimensional sample space. In this study, both the time-domain peak-to-peak imaging and frequency-domain absorption coefficient slice imaging were used to samples.
Terahertz time-domain peak-to-peak imaging shows the difference between the maximum and minimum values of the entire time-domain waveform at each pixel point. At each pixel, the maximum and minimum values of the time domain signal are subtracted to get the peak-to-peak values. The peak-to-peak image is presented by using the two-dimensional reconstructed image. This model clearly shows the outline of the sample and removes the strong reflection wave on the air or object interface by focusing only on the information inside the sample.
In the case of slice imaging of the absorption coefficient in the frequency domain, the reconstructed image consists of the absorption coefficient at a specific frequency point. For example, the frequency domain absorption coefficient extracted from the terahertz imaging data file is a matrix of M*N. The data in each column of the matrix is the discrete value (number M) of the frequency domain absorption coefficient signal of each pixel where N represents the number of pixels. Frequency domain absorption coefficient slice imaging mode is to select the absorption coefficient at the same frequency position for two-dimensional image display at each pixel.
3.1. Evaluation of Terahertz Spectroscopy Data and Optical Parameter
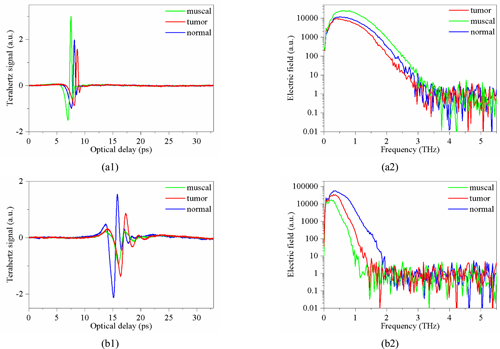
As shown in Fig. 3, two sets of different terahertz spectral data are obtained and Fig. 5 shows the reflected THz pulses and their spectral amplitudes of prostate cancer tissue at the corresponding position of the different types of tissue selected from Fig. 2. The reflection signal and spectrum of the terahertz beam passing through the lower surface of the sample are shown in Fig. 5(a) and the interface for Fig. 5(b). A comparison between the above two curves reveals that the three kinds of tissues can be distinguished irrespective of the experimental scheme used.
However, results indicate that the order of intensity arrangement from the two methods is clearly different. Also, the results of the two experimental schemes are quite different in attenuation frequency components. The first group of spectral curves can only see simple attenuation in intensity, while the second group of spectral curves is accompanied by the disappearance of many high-frequency components. The reason is that the first group of results is obtained from reflected signals from the surface of the sample. The difference observed in reflected signals between different tissues is mainly due to the difference of THz reflectivity, which may be caused by the difference in the surface morphology of different tissues. For example, the reflectivity of the surface of smooth muscle tissue to terahertz wave is higher than for the other two kinds of organizations. In the second group, the terahertz beams penetrate the sample twice before and after reflecting through the mirror. Different types of tissues have different absorption capacities for terahertz waves and different absorption frequencies, which lead to the difference of terahertz reflection echoes.
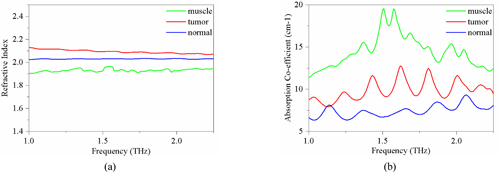
From the terahertz spectrum curve in Fig. 5, it can be inferred that the difference of the reflectivity of different sample tissues to terahertz waves did exist. However, it is not as great as the difference in the absorption characteristics of terahertz waves in tissues. The absorption of terahertz waves by different types of tissues varies in intensity and frequency. In order to further verify this point, terahertz spectral data was used to further extract the refractive index and absorption coefficient of three kinds of tissues in the terahertz band as shown in Fig. 6.
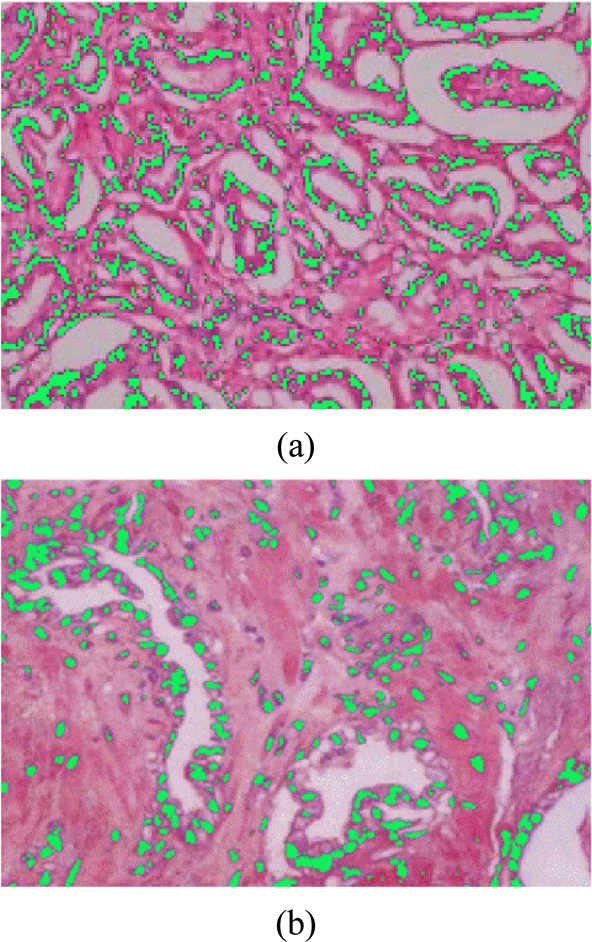
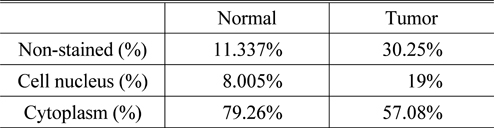
It can be seen from the results that the refractive index and absorption coefficient of smooth muscle tissue are quite different from those of prostatic tissue. The reason is that there are great differences in tissue density, structure and composition between smooth muscle tissue and prostatic tissue, suggesting that the response of these two tissues to terahertz is also quite different. For normal prostate tissue and prostate cancer tissue, the refractive index of cancer tissue was found to be nearly 0.1 higher than that of normal tissue in the range of 0~3 THz spectrum. There is also a big difference in the comparison of absorption coefficients, in the frequency range of 0.5~1.5 THz, the maximum difference of absorption coefficients reaches 10 cm-1. Since the samples used in this study are paraffin-embedded tissues, the effect of moisture on the refractive index and the absorption coefficient can be excluded. Under this condition, we can then use H-E staining images to explain the origin of this difference from the perspective of cell density. From the H-E staining images, it can be seen that prostate cancer is mainly composed of small acini with close distribution, whose volume is much smaller than that of normal acini. In case the degree of differentiation of tumors is decreased, these small acini are back-to-back, wall-to-wall, bridging and forming large fusion acini groups, which only retain many small sieve-like glands lumens. The cell density of cancer tissue is greatly increased. At the same time, the rapid proliferation of cancer cells has led to a significant increase in the number of nuclei in tissues, and the nuclei of prostate cancer cells often have significantly increased nucleoli. Compared with other components of cells, the nuclei of prostate cancer cells are denser because of the large number of high-quality and dense nucleic acids. This was verified by calculating the proportion of cell nucleus, cytoplasm, and non-stained areas per unit area of tissue using image analysis software. The results of nuclear recognition are shown in Fig. 7, and the calculation results of the proportion of each component are shown in Table 1. From the results, we can see that the proportion of nuclei in cancer tissue is about 2.375 times that in normal tissue, which means that the cell density increases greatly.
[TABLE 1.] The analysis results of the H-E staining images

The analysis results of the H-E staining images
In the case of the same cellular components, higher density of the tissue cells often leads to a higher refractive index and absorption coefficients. Therefore, the higher the density of the material, the greater the number of unit molecules and hence the higher the dielectric constant [27, 28].
Of course, for the problems of how cell density directly leads to the change of terahertz absorption coefficient and characteristic absorption at some special frequencies, we need direct terahertz spectroscopic measurements of the nuclei and other components of prostate cancer tissues, combined with biomolecular dynamics analysis, which is the future direction of our research.
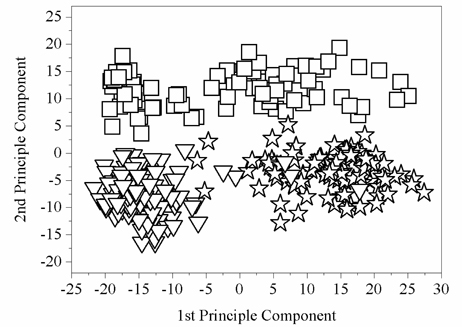
Firstly, we make the Principal Component Analysis (PCA) of terahertz spectra. From Fig. 6(b), some differences in the absorption coefficients of the three kinds of tissues in the frequency range of 0.2~2 THz can be easily seen. Therefore, the absorption spectrum information in the frequency range of 0.2~2 THz was chosen as the eigenvector for analysis. Since the spectral resolution of TeraView 4000 terahertz time-domain spectrometer is 7.6 GHz, each spectrum has 240-dimensional characteristics. Contrasting with H-E staining, 120 sample points are randomly selected from three different tissue regions, then the original spectral data constitute a matrix A of 360 × 240. The PCA of absorption spectrum data A in the frequency domain is then carried out. As shown in Fig. 8, 360 sample points are concentrated in relatively independent regions in the space composed of the first two principal components. This shows that the principal component method can theoretically distinguish the types of sample tissues. Therefore, the first two principal components of the original spectral data are selected as the input variables of least squares support vector machines (LS-SVM).
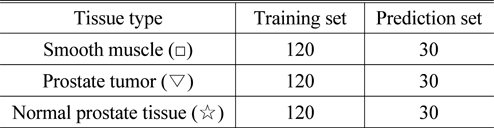
The absorption spectrum data of 120 sample points in each group of tissues were selected as training samples for LS-SVM. Moreover, 30 additional sample points were selected as prediction samples for each group. The sample number of each grouping is shown in Table 2.
[TABLE 2.] The results of the training set and prediction set grouping

The results of the training set and prediction set grouping
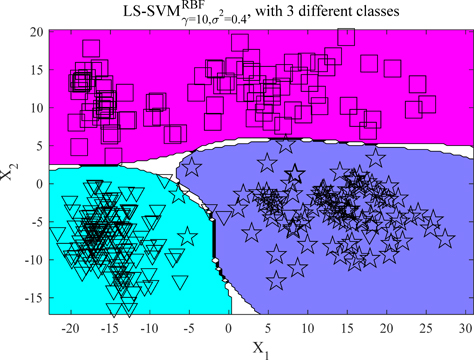
The classification effect of the LS-SVM model has a great relationship with the choice of the kernel function. Here, the kernel function used is the Radial Basis Function (RBF). RBF kernel function is a kind of non-linear function with good radial symmetry and smoothness, which can reduce the complexity of the modeling process. At the same time, the results of classification prediction are greatly influenced by the penalty parameter γ and kernel parameter
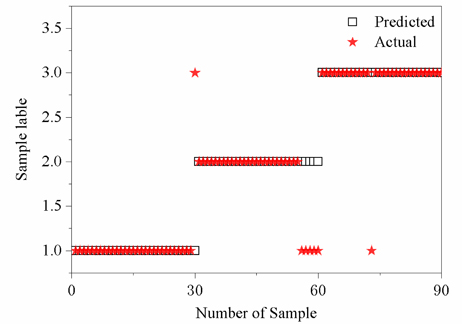
The predicted results of the test set are shown in Fig. 10. The abscissa represents the number of the test samples and the ordinate represents the category of each test sample (category labels 1, 2 and 3 represent prostate cancer, smooth muscle and normal prostate classification samples, respectively). Figure 10 indicates that one of the samples in the first category was misclassified into the third category with a classification accuracy rate of 96.7%. It is important to indicate that five samples in the second category were misclassified into the first category with a classification accuracy rate of 83.3%. Similarly, one sample in the third category was misclassified into the first category with a classification accuracy rate of 96.7%. The overall average recognition rate was found to be 92.2%, suggesting that this method is effective in the classification of different tissues of the prostate cancer samples.
3.3. Analysis of Terahertz Imaging Results
In order to visualize the difference in the terahertz responses of the different tissues in the same sample, we used a terahertz spectral imaging method to obtain the terahertz image of the sample based on the intensity of the reflected terahertz signal and terahertz absorption characteristics.
In this study, we use the frequency domain slice imaging method to image paraffin-embedded prostate tumors, which means that a terahertz image can be obtained at each distinguishable frequency in the 0.5~2.0 THz band, as shown in Fig. 11. We find that terahertz images of different frequencies do differ in their ability to distinguish multiple tissues.
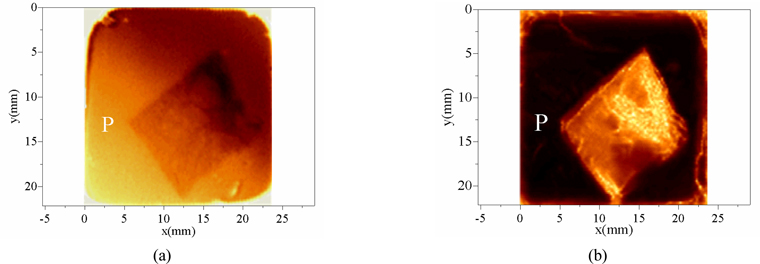
Based on the experimental scheme of focusing the terahertz spot on the surface of the sample, the intensity of the reflected terahertz signal on the surface of the sample is collected. The image obtained at 1.2 THz by using the frequency-domain slice imaging method is shown in Fig. 12(a). Based on the experimental scheme of focusing the terahertz spot on the back surface of the sample, the image at 1.2 THz using frequency domain slice absorption coefficient imaging method is shown in Fig. 12(b).
A comparison between the two terahertz images indicates that terahertz images can clearly show the contour of tissue embedded in paraffin. However, the two images have distinct characteristics in distinguishing different cell regions within the tissue. The elliptical contours of different cell groups can be clearly observed, and the uneven roughness of the tissue surface can also be clearly shown in Fig. 12(a). This is because the imaging parameters are chosen to observe the distinct boundaries between different cell regions within the tissue. As opposed to the results in Fig. 12(a), the color values of different tissue in Fig. 12(b) are quite different. All the different tissue regions can be distinguished by edge recognition method according to different color values, as shown in Fig. 13. This is because the imaging parameters of Fig. 12(b) are the terahertz absorption coefficients of the different tissues. The terahertz wave signals penetrate the samples twice before and after being reflected by a plane mirror. During the propagation process, the terahertz wave interacts fully with the tissues. The absorption of the terahertz waves by different types of tissues will vary greatly in frequency and intensity, which is well reflected in the absorption coefficient. When the absorption coefficient is used as the imaging parameter, the color value of a pixel in the image is related to the THz absorption coefficient of the tissue at that point. Therefore, the color value of different tissue regions on this THz image will be quite different. For Fig. 12(a), it is very difficult to separate different regions of the sample by color values, which can be clearly seen from the paraffin part (P) around the tissues in the two graphs. The paraffin section in Fig. 12(a) is bright in some places and dark in others, while the color value of the paraffin part in Fig. 12(b) is uniform and quite different from that of the tissue part.
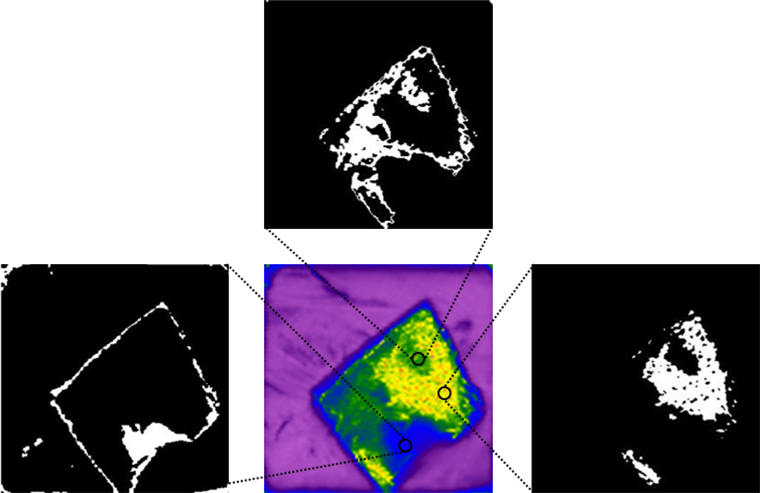
Figure 12(b) is represented as a rainbow image, and the image contour is recognized and extracted using Microsoft visual studio 2017 based on the color values of each pixel as shown in Fig. 13. Firstly, the pretreatment (beneficial to the image processing discrimination) was carried out to gray the image and binarization is carried out by the OTSU method then the morphological operation kernel is set up. Through a morphological algorithm, the binary image opening operation was carried out to eliminate the isolated and small useless noise points in the image. Finally, FindContours was called to find the outline of the picture, judge the extracted outline, extract the useful regions, and draw this region on the pre-defined three-channel drawing board.
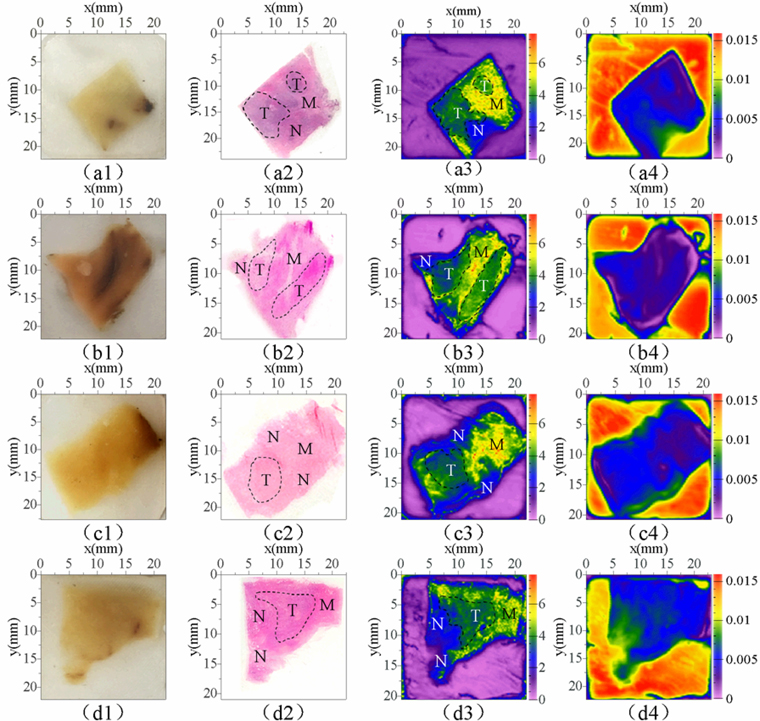
Results of frequency domain absorption coefficient imaging and time-domain peak-to-peak imaging were compared with those of H-E staining and sample photographs as shown in Fig. 14. Prior to that comparison, results of H-E staining were carefully observed using the high power microscopy and the cancer area was marked. This process was completed with the assistance of teachers and students in the hospital. We can see that the THz image clearly distinguishes between tumor areas (T), normal prostate tissue areas (N), and smooth muscle tissue areas (M) and showed good correlations with histopathologic findings. This differentiation, however, was not evident in the optical images.
This research is mainly divided into three main parts namely terahertz time-domain spectroscopy, terahertz spectral classification, and recognition, terahertz time-domain spectroscopy imaging. These three parts are investigated one by one and in this order. The former is the basis of the latter, and the logic is more clear and reasonable. The application effects of surface reflection terahertz signal and deep reflection terahertz signal in tissue recognition were compared in detail from two different aspects (spectrum and imaging), and their advantages and disadvantages were investigated.
The results of this preliminary study show that the classification of three different types of tissues in the paraffin-embedded prostate cancer tissues using the surface reflection terahertz signal is not as effective as extracting deep reflection terahertz signal with refractive index and absorption coefficient. However, the refractive index and absorption coefficient of three different kinds of tissues of the same sample in the terahertz band is clearly different. The main reason is that the cell density of cancer tissue is much higher than that of normal tissue. After two-dimensional point-by-point scanning of the samples, the absorption coefficient data of each scanning point are used as the training set. The principal component analysis (PCA) and least squares support vector machine (LS-SVM) are used to classify the three tissues in the samples, and good prediction results are obtained. Furthermore, the samples’ terahertz images are obtained by both the peak-to-peak terahertz imaging in the time domain and slice absorption coefficient imaging in the frequency domain based on deep reflection terahertz signals of samples. A comparative analysis of the terahertz images and H-E staining image shows that under certain experimental conditions there is a clear correlation between these two results. Therefore, it is easy to perform edge recognition of the paraffin-embedded prostate cancer tissue tumor regions by terahertz image.
Terahertz spectroscopy combined with mathematical computer analysis can be used to distinguish prostate cancer tissue, normal prostate tissue, and smooth muscle tissue. Also, terahertz images can be used to find the approximate boundary between these tissues on the same paraffin-embedded tissue block. This means that terahertz can help the primary pathologists and non-pathologists to easily find cancer lesions and make an accurate diagnosis decision based on the observed pathological changes in the lesions. THz has the potential to be used as an exploratory diagnostic technique in the diagnosis of prostate cancer. The application of terahertz spectroscopic imaging in the detection of paraffin-embedded prostate cancer tissue is still in its infancy and has some limitations, which clearly suggest that additional research in this area is still warranted.
Although this technique can help inexperienced doctors to find cancer lesions in paraffin tissues to some extent, the gold standard for diagnosis is still pathological biopsy. To this end, terahertz can only be used as an exploratory technique in the detection of prostate cancer now. Secondly, since the wavelength of terahertz radiation is in the order of 100 microns, the resolution of terahertz far-field imaging is also of the order of sub-millimeter. The axial resolution of our TPI system used is around 30 microns and the maximum lateral resolution is around 250 microns. This resolution is sufficient for distinguishing large areas of cancerous tissue, but not enough for some microstructures that need to be measured. For example, a single cell of an organism is generally in the micron or sub-micron scale (single prostate cancer cells are generally at 10 micron scale). If we want to use terahertz imaging technology to distinguish cancer cells and normal cells in the size of 5 microns, we need to make its imaging resolution break through the limitation of its wavelength, that is, break through the limitation of carrier diffraction. In near-field imaging technology, the non-propagating component of the carrier wave is coupled with the sub-wavelength scale object (hole or tip). At this time, the resolution of the imaging will not be limited by the carrier diffraction but determined by the scale of the sub-wavelength object. Some researchers used a 100-nanometer diameter tip to perform terahertz near-field imaging and obtained a spatial resolution of 150 nm [10]. So we also need near-field detection technology to be applied to terahertz to make more intensive characterization of cancer tissue. Thirdly, this study is limited to the paraffin tissue and has not yet detected fresh specimens in vivo. Some researchers have used terahertz technology to detect skin cancer, breast cancer, colon cancer, gastric cancer, and other fresh tissues [29, 30]. Their research shows that terahertz detection of cancer tissue in fresh tissue specimens is feasible. As a result, the future research direction of terahertz spectroscopy imaging is to try to apply the technology to the detection of prostate cancer in fresh specimens. fourthly, all the specimens studied are excised tissues without real-time human detection, but the development of terahertz endoscopy equipment provides a theoretical basis for real-time detection of deep tissue cancers such as prostate, esophagus, colon, bladder among others. Considering the strong absorption of water to terahertz, terahertz waves can not penetrate the human body directly to detect the information inside the body. It seems that at best terahertz can only detect some tissues in vitro or the skin on the surface of human body. However, the high sensitivity of terahertz to water also makes water a natural terahertz contrast agent, and the detection of terahertz wave for fresh cancer tissues is based on the theory of hydration of tissues [15]. Therefore, the presence of certain water can greatly enhance the absorption of terahertz by cancer tissues, If terahertz waves can enter human body with endoscopy equipment, the sensitivity of terahertz to water can be used to distinguish fresh cancer in vivo, testing will become convenient. Of course, too much water will inevitably make the echo signal too weak to affect our measurement. In this case, considering that the absorption of water to terahertz is not full-band, we can choose the frequency band with less water absorption in the terahertz band for high-intensity single-frequency detection, or a broadband terahertz source can be used to alleviate the problem by focusing only on the frequency bands that are less absorbed by water. In recent years, terahertz endoscopy equipment has made some progress in detecting colorectal cancer [31, 32]. It is believed that the application scope of THz endoscope will be further expanded. Therefore, another clear direction would be to consider the combination of endoscopy equipment and terahertz technology to do the real-time in vivo detection of prostate cancer tissues.
The novelty of this study is centered around the application of terahertz time-domain spectroscopy and imaging technology in the classification of the different types of tissues and the recognition of the edges in the paraffin-embedded prostate cancer tissues. Observed differences in the spectral characteristics as well as the imaging results between surface reflection terahertz signal and deep reflection terahertz signals were compared. Both the Principal Component Analysis (PCA) and Least Square Support Vector Machine (LS-SVM) were used to classify and recognize the absorption spectrum characteristics of each point of the sample, and the prediction accuracy was found to be 92.2%. Finally, the absorption spectral characteristics of deep reflection signals were selected for frequency domain slice imaging. The THz image showed good correlations with the histopathologic findings. Therefore, the use of terahertz spectral imaging technology combined with computer classification and recognition method to classify and identify paraffin-embedded prostate cancer tissues is a very attractive topic. The application of terahertz spectral imaging system has the great potential of becoming an effective imaging and detection method for prostate cancer. The technology can also be used as an auxiliary means of pathological detection. This method is simple and fast and has a wide range of application prospects in the medical field. However, this study is still in its infancy, and there are many shortcomings. Typically, the interaction between terahertz wave and cancer tissue especially fresh tissue still needs to be discussed in detail. Ideally, the application of deep learning techniques to the analysis of the terahertz images of the prostate cancer tissues would be an interesting area to be explored, and the present study will be improved from the above perspectives.