L. monocytogenes is a human pathogen that causes listeriosis, a severe illness. Internalin A (InlA) is considered to be the most important surface protein of L. monocytogenes, because it promotes listeria uptake into intestinal epithelial cells by targeting the N-terminal domain of human E-cadherin, the dominant adhesion molecule of adherens junctions [1, 2]. Based on this fact, L. monocytogenes may cause illness in an intestinal, utero-placental, hepatic, or neurological phase of infection. Since the L. monocytogenes bacteria always hide in host cells, which makes it difficult for an antibiotic to work, a better way to prevent listeriosis is to block InlA from adhesion and invasion. Thus many researchers have turned their attention to InlA.
Most anti-listeria antibodies available from research laboratories or commercial vendors are associated with the problems of low affinity [3], reaction to heterologous antigens [4, 5], or lack of reaction toward all serotypes of L. monocytogenes [6, 7]. Recently, a group of researchers announced a monoclonal antibody against InlA that reacts with both InlA and L. monocytogenes cells [8]. Known as Mab-2D12, it is reactive with all 13 serotypes of L. monocytogenes, but the affinity of this antibody to InlA has not been determined. To obtain information about the affinity of Mab-2D12, real-time measurements of the interaction between Mab-2D12 and InlA are desired. Further data analysis should provide the kinetic constants of the reaction.
A common way to obtain affinity information is by using a surface plasmon resonance (SPR) biosensor [9-12]. Recently an optical oblique-incidence reflectivity difference (OI-RD) method has also shown great potential in high-throughput proteomics research [13, 14]. The OI-RD method detects a biomolecular microarray by measuring thickness and mass density of target spots. A small change in thickness or mass density in a molecular layer leads to changes in reflectivity. OI-RD is compatible with all flat substrates, which makes surface modification in OI-RD more flexible [15].
In the present study, OI-RD was used for label-free, real-time monitoring of the binding reaction of Mab-2D12 antibody with surface-bound InlA targets. We will show how the kinetic parameters are obtained from the observed binding curves.
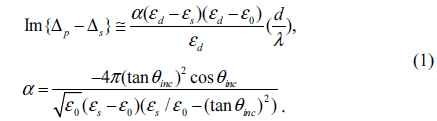
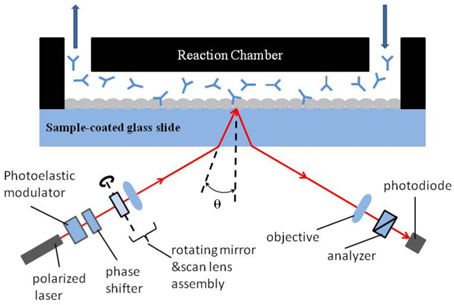
A typical setup for OI-RD from a microarray-covered solid surface is sketched in Fig. 1. The microscope uses a He-Ne laser (λ = 633 nm) for illumination. The complex differential reflectivity change Δp − Δs across the microarray-covered surface is measured [14]. Here we define the OI-RD signal as Im{Δp − Δs}, which can be obtained directly from experiments. Since the average thickness d of a biomolecular microarray is much less than the optical wavelength λ, Zhu and coworker [16] have shown that
Here θinc is the angle of incidence, and ε0, εd, and εs are respectively the optical dielectric constants of the surroundings, the molecular layer, and the substrate. When using OI-RD to monitor the immobilization of an antibody with surface-bound InlA targets, εd is the dielectric constant of the immobilized antibody, ε0 is the dielectric constant of glass, and εs is the dielectric constant of the solutions in the flow cell.
Monoclonal antibody against InlA was raised in mice. Briefly, six-week-old female mice were administered intra-peritoneally (i.p.) with approximately 1 × 10⁸ cells/ml of heat-killed L. monocytogenes serotype 4b. Two weeks later, a mixture of heat-killed L. monocytogenes and 50 μg of rInlA prepared with incomplete Freund’s adjuvant was administered i.p. every week for 8 weeks. The splenocytes were harvested from the mouse and fused with murine Sp2/O-Ag14 myeloma cells. Selected hybridoma clones were administered to pristine-primed mice to produce ascetic fluid for antibody production. Monoclonal antibody was purified by affinity chromatography using a protein A-Sepharose 4B column (GE Healthcare), and the class of the monoclonal antibody was determined by ELISA experiments [8].
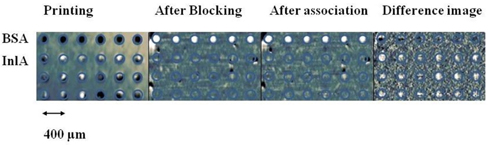
The experimental procedure consisted of several steps. First, the 80-kDa InlA target was printed on the epoxy-functionalized glass slide by a GMS 417 pin-and-ring contact-printing robot arrayer (Genetic Microsystems) at a concentration of 8.75 μM in a solution of 1 × PBS (phosphate buffered saline, pH = 7.4). Bovine serum albumin (BSA) was also printed as the control. InlA and BSA bind covalently to epoxy groups [17]. The arrangement of printed spots is shown in Fig. 2; the center-to-center separation between spots is 400 μm. For each row, six spots were printed as repeats, and the slide was washed with 1 × PBS solution to remove excess unbound and weakly bound proteins. Then the remaining epoxy groups on the surface were blocked with BSA (7.6 μM in 1 × PBS) for 10 minutes, to prevent probe molecules from nonspecific binding. At last, the slide was reacted with Mab-2D12 antibody in 1×PBS at room temperature. We first filled the flow cell with antibody quickly at a rate of 30 mL/min, then slowed down the flow rate to 0.05 mL/min during observation of the association reaction. To observe the dissolution, we quickly replaced the probe solution with 1×PBS at a flow rate of 30 mL/min, then slowed down the flow rate to 0.05 mL/min during the subsequent dissociation.
In Figure 2 we show an OI-RD image of the InlA microarray at each step of the process. It is a small 4×6 microarray. The circles indicate where the spots should be, as printed. At the blocking and association step, it is unclear whether the reaction has happened by simply looking at Fig. 2, but from the difference image-the image after the association minus the image before-, it is clear that there were reactions between Mab-2D12 antibody and surface-bound InlA, while no reactions happened on the BSA spots. Here we rewrite Eq. (1) in terms of the surface mass density of the monolayer targets, given by Гprobe = dprobeρprobe [18],
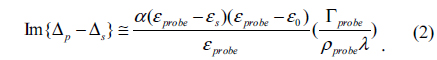
εprobe is the dielectric constant for the antibody, ρprobe is the volume mass density of the antibody, and dprobe is the average thickness of the immobilized antibody, which increases with time during association. Eq. (2) indicates that Гprobe is proportional to Im{Δp − Δs}, which means the real-time OI-RD signal is proportional to the mass (quantity) of antibody molecules that have reacted with surface-bound InlA. The difference image in Fig. 2 shows positive signals at InlA spots, which proves that the reaction did take place.
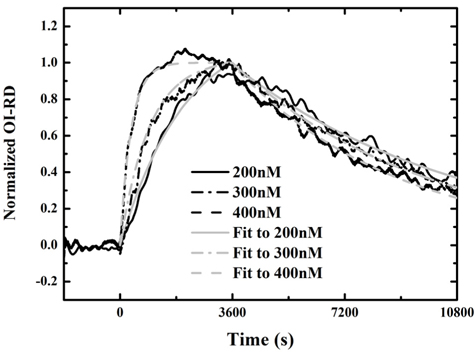
Figure 3 shows three real-time binding curves with antibody at concentrations of 200 nM, 300 nM, and 400 nM: association in the first hour, and dissociation in the following two hours. Each curve is normalized to the maximum value of the OI-RD signal during association with antibody at 400 nM, assuming that a monolayer of antibody was immobilized on the surface after the association process. It is shown in Fig. 3 that the rates to reach saturation for the three curves are different. Saturation only occurred when the antibody was at a concentration of 400 nM. We fit the association-dissociation curves using Langmuir-reaction kinetics [19, 20]. In this model, the association rate is assumed to be proportional to the antibody concentration as kon[c], while the dissociation rate koff is independent of the antibody concentration. The equilibrium dissociation constant of the reaction is given by Kd = koff/kon. We fit the binding curves to a one-site Langmuir-reaction kinetic model that assumes one surface-bound InlA molecule reacts with one Mab-2D12 antibody molecule at a specific site.
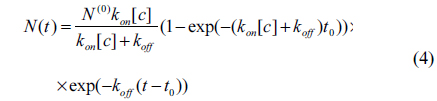
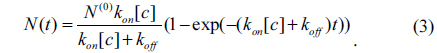
In the one-site model, let N and N(0) be respectively the reacted and initially available amounts of antibody. The total amount of reacted antibody during the association reaction is given by
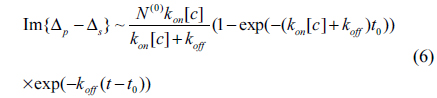
Here [c] is the concentration of antibody and t is time. After a time t0, the antibody solution is replaced with 1 × PBS. Subsequently, the total number of the reacted antibody decreases as
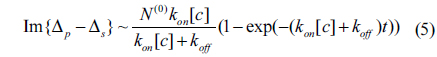
There is no doubt that the surface mass density Гprobe is proportional to the amount of reacted antibody N(t). From Eq. (2), the optical signals shown in Fig. 3 are expected to vary as
for 0 < t < t0, and
for t > t0. For the three association-dissociation curves in Fig. 3, we performed a global fitting using Eqs. (5) and (6) with the same kon and koff as global fitting parameters. The three gray lines in the figure are the fits to the model. The kinetic constants for Mab-2D12 antibody reactions with InlA are kon = 3.35×10⁻³/(¼μM⋅s), koff = 1.14×10⁻⁴/s, and Kd = 3.40×10⁻² μM = 3.40×10⁻⁸ M. The dissociation constant Kd obtained here falls within the range for biological molecules, from 1×10⁻⁴ to 1×10⁻¹¹ M [21]. The data indicate that the monoclonal antibody is specific to the InlA protein. This experiment proves that the Mab-2D12 antibody is capable of detecting InlA protein and also whole-cell L. monocytogenes.
In summary, we performed real-time, label-free monitoring of the reaction between Mab-2D12 antibody and surfacebound InlA. The appropriate dissociation constant Kd = 3.40 × 10⁻⁸ M indicates that Mab-2D12 antibody as a useful monoclonal antibody for the detection of L. monocytogenes. The results presented here also demonstrate the versatility of the combined OI-RD scanner and microarray platform for real-time monitoring of protein reaction kinetics, which confirms that OI-RD can be used to determine affinity of a protein with an antibody in a label-free manner.