Optical approaches can bring structural and functional information together in preclinical brain research. High-resolution and real-time imaging of cerebral neocortex has been accelerated with optical tools to monitor vascular function and microvascular structure of the brain in normal and pathophysiological conditions [1]. Currently several research groups have demonstrated functional brain imaging of the cerebral cortical network with high spatio-temporal resolution [2-4].
There are several optical methods for vascular imaging of the brain including white light imaging, fluorescence imaging, and laser speckle contrast imaging. White light imaging displays intrinsic reddish vasculature as hemoglobin molecules within red blood cells absorb a specific spectrum of illumination light. Fluorescence imaging provides high vascular contrast by blocking excitation light and passing only the emission light from functional vasculature using fluorescent vascular tracer that is intravenously injected into the circulation prior to imaging [5]. However, both white light and fluorescence imaging have limitations: the former being of limited use in discerning functional and non-functional blood vessels and the latter requiring exogenous fluorescent tracers.
To overcome these limitations, laser speckle contrast imaging can be used in the field of biomedical imaging. Unlike other techniques, laser speckle contrast imaging provides label free high contrast and real time functional imaging without the need of exogenous contrast agent, although it is sensitive to vibrations and requires stable fixation of the target region to minimize any perturbation caused by breathing and heartbeat. Therefore, laser speckle contrast imaging could be used for superficial vascular imaging on skin, retina or cerebral cortex [6].
Laser speckle is a random granular interference pattern due to the roughness - on the scale of an optical wavelength - of surface or to multiple scattering events within tissue through which the photons travel. When coherent light illuminates a sample area, backscattered light fields are superposed together resulting in constructive or destructive interference. The resultant fluctuations of intensity, or laser speckles, are imaged onto a camera as grainy patterns [7]. When the scattered particles are in motion in some instance such as particle suspensions or blood cells in circulation, the speckle pattern can change during the integrated camera exposure time. If the particles are moving fast, the speckle image at the corresponding region appears blurred because the changing speckle patterns are averaged out during the camera integration time. Hence, the intensity fluctuations of speckles in terms of normalized standard deviation either in space or in time can provide dynamic information of scatterers within the illuminated area. Moreover, qualitative blood flow can be measured by analyzing the blurring of speckles or speckle contrast [8-11]. The speckle contrast can be calculated in a cortical area to provide 2-dimensional cerebral blood flow map with relatively high spatiotemporal resolution [1]. Multiple modality imaging (i.e. intrinsic signal) of functional responses could provide a better picture of the hemodynamic responses to sensory stimulation both in spatial and temporal domains.
In this paper, we delineated optimal stimulation parameters to maximizing laser speckle contrast with a home-built laser speckle contrast (LSC) imaging setup, and applied it for measuring cerebral blood flow changes in response to electrical sensory stimulation with an experimental mouse model. The comparison with optical intrinsic signal (OIS) imaging demonstrates an exemplary correlation of blood flow and neural activity-dependent changes.
Animal experiments were performed according to the institutional guidelines of the Gwangju Institute of Science and Technology, which are compliant with the ARRIVE guidelines (https://www.nc3rs.org.uk/arrive-guidelines). C57BL/6 mice with cranial windows were used for experiments. Mice with 25-30 g body weight and ages of 8-10 weeks were anesthetized with Zoletil/Xylazine mixture in saline solution (60/10 mg/kg body weight). Body temperature was kept at 37℃ throughout the experiments. The cranial window with a customized angel ring was stably mounted on a stereotaxic animal holding and heating apparatus (Customized ring type in vivo heating system, Live Cell Instrument, Seoul, Korea).
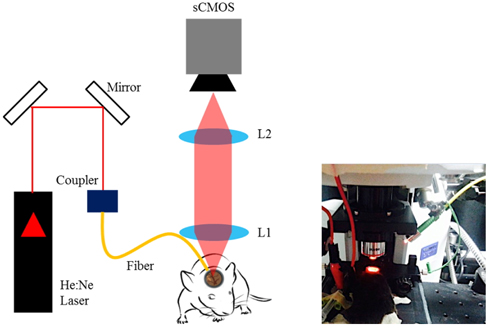
The laser speckle imaging instrumentation consists of a helium-neon laser (
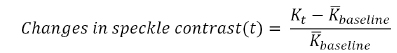
To analyze the speckle data, speckle contrast

where
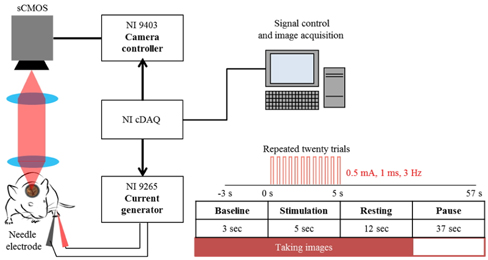
The schematic of electrical sensory stimulation apparatus synchronized with camera acquisition is illustrated in Fig. 2. To monitor functional activation of somatosensory cortex, a couple of needle electrodes made of stainless steel were inserted just underneath the skin of the hindlimb [6]. During electrical stimulation experiment, the animals were under gas anesthesia (isofluorane at 1.2-1.5%). A current output module (NI 9265, 20 mA, National Instruments, USA) was used to supply electrical pulses (0.5 mA, 1 msec duration at 3 Hz) of current. The current output was controlled with LabView program and was synchronized with camera acquisition using a bidirectional digital I/O module (NI 9403, National Instruments, USA). Twenty repeated trials were averaged in order to increase the signal to noise ratio (SNR) [15]. Each experimental trial lasted for 60 sec including 3 sec of baseline and 5 sec of stimulation (Fig. 2) during which the image acquisition took 20 sec at 5 Hz with 5 msec exposure time.
To represent the cerebral blood flow, the relative changes of speckle contrast can be computed as

where
In order to monitor the response of tissue perfusion that is related to the blood flow as well as activity-dependent oxygenation due to the functional activation, LSC imaging was combined with optical intrinsic signal (OIS) imaging as this reflects local blood volume and oxygen saturation signals through the back-reflection of light when the surface of the brain is illuminated with red LED (625 nm, M625L3, Thorlabs Inc.) [19]. Therefore, the OIS imaging can guide the activation region by analyzing oxygen consumption of hemoglobin [20].
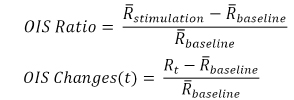
For OIS imaging, twenty trials are averaged to generate 200 sequential frames at 10 Hz for 20 sec. The frames for the initial 3 seconds of the sequence, taken before stimulation, are averaged together to give a single baseline image. The frames for 5 seconds taken during stimulation, are averaged together to give a single stimulation image. The ratio can be calculated to generate a functional map. Each frame in the temporal sequence was normalized to the mean baseline image, yielding percent changes in light reflectance [21, 22].

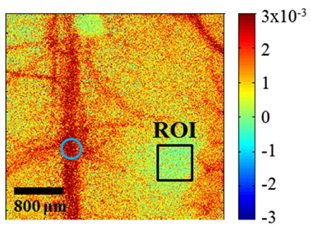
OIS is an appropriate tool to obtain information about the functional response to somatosensory stimulation although a single wavelength illumination allows only qualitative mapping and does not give separate information on oxygenation and blood volume. However, in our study, single wavelength OIS illumination was sufficient to provide a localized region of interest caused by changes in deoxyhemoglobin. The red wavelength we used for OIS imaging provides maps that are highly spatially correlated with neuronal activity as the absorption of oxyhemoglobin is much lower than that of deoxyhemoglobin in 600~630 nm range to produce high signal-to-noise ratio compared with near infrared wavelength [21]. By analyzing reflectance change between baseline and stimulation period using OIS imaging, the left hindlimb activation region was exposed to electrical sensory stimulation for 5 seconds. The spatial changes in reflected light intensity from LED illumination due to hindlimb stimulation is shown in Fig. 3. Based on the reflectance change, a rectangular region of interest (ROI, size of 0.5 mm × 0.5 mm) was chosen at the right side of the bregma.
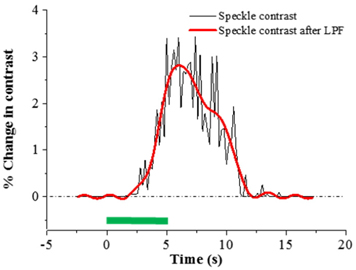
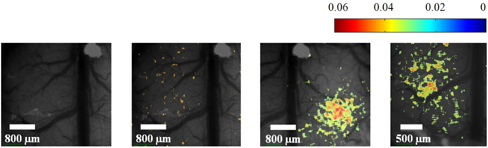
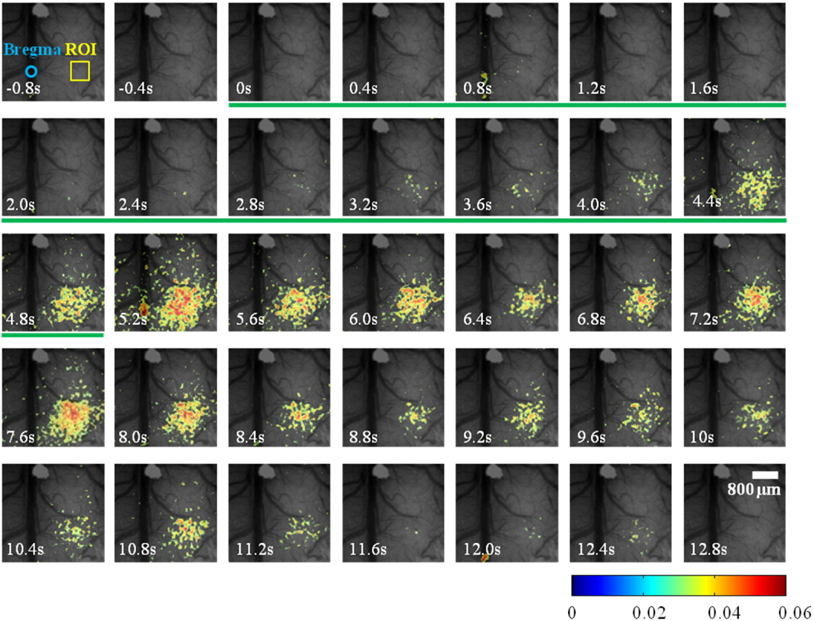
Because speckle contrast is related to the velocity of scatterers in blood flow, the changes of speckle contrast are considered as the changes in cerebral blood flow [23]. The images of the changes in speckle contrast including the 5 sec of hindlimb electrical sensory stimulation are shown in Fig. 4. The series of images are shown at 0.4 sec intervals. The changes in speckle contrast are displayed for all pixels and the localized region identified in the OIS imaging (Fig. 3.) was also activated in LSC imaging which is indicated by the yellow box in the Fig. 4. Especially, a peak of relative increase in speckle contrast due to cerebral blood flow was over 5%. The time course of the contrast changes averaged in the ROI that is centered over the activated area is shown in Fig. 5. The peak relative changes in speckle contrast (~3%) during the 5 sec stimulation occurs at 6.7 sec after the initiation of stimulation. After reaching the peak point, changes in cerebral blood flow or speckle contrast were steadily decreased and returned to the baseline level within 6 sec.
The use of 633 nm HeNe laser and not conventional near-infrared light sources for our LSCI was to better match with the intrinsic signal information. Not only does the longer coherence length have advantage for laser speckle, this wavelength can further emphasize the changes in optical properties during our hemodynamic measurement. The molar extinction coefficient of deoxyhemoglobin is about an order of magnitude larger than that of oxyhemoglobin and thus HeNe illumination provides sensitive detection of hemoglobin changes [9].
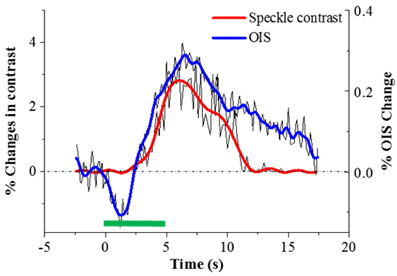
Time courses of percent changes in speckle contrast and intrinsic signal averaged in the left sensory region is illustrated in Fig. 6. The starting times of speckle contrast and intrinsic signals right after electrical stimulation are comparable. Subsequent to sensory stimulation, the cerebral blood flow (speckle contrast) starts to increase at approximately 1.4 sec, while the highest oxygen consumption or the early reflectance decay known as initial dip, occurred at a similar time. This phenomenon can be explained as correlation between oxygen consumption and blood flow. The initial dip is caused by deoxyhemoglobin increase and oxyhemoglobin decrease due to oxygen consumption in response to neural activity [6, 24, 25]. Upon functional activation, neurons require more oxygen than their resting state and subsequently the blood flow is increased via neurovascular coupling [2].
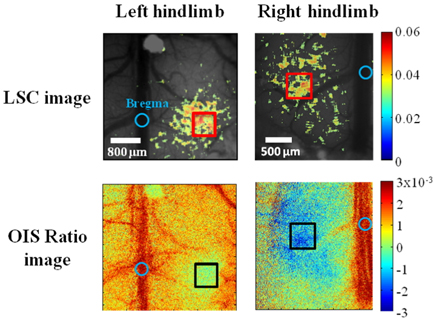
An equivalent experimental set was performed on the right hindlimb of the same animal to find sensory region of the opposite side using both OIS imaging reflectance and LSC imaging contrast as shown Fig. 7. We found that both sides of the hindlimb region were symmetrically located in 1.2-1.5 mm apart from the center of the bregma, in a manner consistent with a previous craniotomy study [26].
To eliminate the random noise of laser speckle due to the vibration or breathing, the threshold technique (3%) was used [27]. However, the weak signal of changes in blood flow at 0.3 mA was not easily noticeable as it was not distinguishable from random noise as in Fig. 8. It is important to find optimal amplitude of electrical current in order to minimize any detrimental and unexpected effect on the experimental animal such as motor reaction by stimulus or edema from invasive electrode. Each experimental block includes 40 repeated trials. Each trial consists of baseline (3 sec) and stimulation time (5 sec). To use electrical current of 0.3 mA, it was necessary to minimize the noise level. As the major noise sources were environmental vibrations, mainly generated by the cooling fan of the camera or neighboring equipment, further suppression of environmental or mechanical noise was required.
As spatial speckle analysis was used in our laser speckle contrast imaging, spatial resolution was sacrificed. To improve spatial resolution, a sliding window technique can be used [3]. However this requires N2 times longer time than simple spatial analysis (N=7 in our case) and the trade-off between the computational burden and finer spatial analysis should be taken into account [18].
LSC imaging provides relatively high spatio-temporal resolution of cerebral blood flow using simple optical instrumentation by analyzing the laser speckle pattern caused by the motion of scatterers that are mostly blood cells. This study demonstrates that the combined imaging of laser speckle contrast and intrinsic optical signal can provide correlative information with electrical sensory stimulation of a limb towards preclinical stroke research. To induce hemodynamic response by functional activation, an electrical sensory stimulation apparatus was built and synchronized with camera acquisition. The LSC imaging was combined with optical intrinsic signal (OIS) imaging in order to monitor response of blood flow and oxygenation by functional activation. The LSC and OIS imaging was alternatively performed to obtain combined data. We found that changes in speckle contrast and optical intrinsic signal have notable correlation: the temporal trajectories were similar while the latter shows initial dip at the beginning of stimulation. In addition, the hindlimb region in the cortex was symmetrically located in approximately 1.2-1.5 mm from the center of the bregma in mouse cortex.
As a future direction, a fully combined multi-modal simultaneous imaging system of both LSC and OIS would provide simultaneous hemodynamic information on the changes in blood flow and oxygenation in response to electrical sensory stimulation.