시스템 분석가 또는 정보시스템 설계자들의 역할은 경영자와 정보기술자 간의 간극을 메우는 것이다. 이들은 사물을 인식하여 개념화하고 추상화하여 정신모델을 형성한 다음, 다양한 그래픽 모델링 도구를 이용하여 표현함으로써 데이터모델이나 프로세스 모델과 같은 현행 모델(ASIS model)을 구축한다. 이들은 자신의 경험과 지식을 바탕으로 현행모델에서 문제점을 발견하고 개선안을 구상하여, 다시 그래픽 도구를 이용하여 미래모델(TOBE model)을 설계한다. 이와 같이 시스템분석 및 설계 전공자들에게 그래픽 모델링 능력은 매우 중요함에도 불구하고, 그래픽모델링 능력을 측정하기 위한 연구는 매우 미흡한 실정이다. 본 연구에서는 시스템분석가와 정보시스템 설계자들에게 가장 핵심적인 능력이라고 할 수 있는 그래픽모델링능력을 측정하기 위한 도구를 개발하였다. 언어학, 수학, 경영과학, 통계학 등 다양한 학문 분야에서 모델링 능력을 측정하기 위한 연구들을 참고하여 그래픽 모델링 능력 설문 문항을 개발하고, 이를 92명의 필리핀과 한국의 정보시스템 관련 전공 학생들에게 시험을 보게 하여 그 결과를 바탕으로 측정도구의 신뢰성과 타당성을 검증하였다. 학계에서는 학생들의 모델링 학습효과를 측정하는 도구로 활용할 수 있고, 기업에서는 시스템분석가와 정보시스템 개발자를 채용할 때 적성검사 도구로 이용할 수 있을 것으로 기대된다.
Information systems are no doubt a valuable resource of any organization for its smooth day-to-day operation and decision-making needs. This natural need of organizations to have efficient information systems require universities to produce students who will be qualified enough in working with the information systems development process effectively. This involves working effectively in the analysis, design, development and maintenance of information systems in organizations.
This study deals with the basic skill that will help the analysis, design and development and maintenance of information systems organized, structured and easier to do for people involve in it. This basic skill is modeling. What is involved in modeling? Why is modeling skill very important for people in systems analysis and design? What assessment tool should be designed to measure a person’s modeling skill? The assessment tool that will be formulated will be tested for its reliability and validity.
There are a lot of definitions written of the word, ‘model’. Some authors and researchers defined it with a general application.
Pidd [1] considers a model as an illustration of a part of reality that is seen by the people interested to use that model so that it could be understood, changed, managed, controlled. Stachowiak thinks that model is based on an original but reflects only parts of it and is intended for some purpose (as cited by [2]). Powell has almost same definition by saying that model is a simplification of a reality for a purpose. Holling also emphasized that any model is a caricature of reality (as cited by [3]). A very interesting definition of a model is what Mulvey [4] said that it is like a dance troupe that it cannot be evaluated in isolation or without seeing it in action.
As human beings, we have a natural ability to model [5]. We use models to investigate the possible consequences of our actions before we actually do it [1]. The science has been considered as a continuous process of developing, testing, refining and improving models to explain the material world [6]. Chemists have developed models to explain the concepts of molecules, atoms, sub-atomic particles and the relationships among them in order to investigate natural phenomena [7].
Powell had emphasized that modeling is very useful in communicating a decision to people in organization, thus it will increase their sense of commitment and improve employee’s performance [5]. Modeling in business processes had been considered as one of the 10 technology skills that are in demand and that all business majors should be studying [8]. Modeling in business process had been studied by so many researchers but focused more on the tools and techniques used [9]. MIS people have long accepted that modeling the business process is important in eliciting the needs of its users [10].
2.3. How to measure modeling ability?
While most of the papers written are on the tools, techniques and language used [11], with several experiments was able to identify the essential skills in understanding process models, which in turn contributes to the improvement of modeling skills. Diethelmand his co-authors [12] wrote a paper measuring the modeling abilities of students. But they have measured the modeling abilities of the students based on how they would answer a certain modeling problem. They focused on the result of the modeling process.
An assessment instrument to measure mathematical modeling skills was developed by Lingefjard [13]. Dan and Xie [14] found out that there is a strong positive correlation of mathematical modeling skills and the creative thinking levels of engineering students, Blomhøj and Jensen [15] identified the mathematical competencies and how it should be put into educational practice. Also an assessment of modeling skill of engineering students found out that a specific mathematical modeling course should be offered to answer the needs of the students [16].
They also acknowledged that the evaluation scheme that they have designed though lacks repeatability and simplicity it still reflects the individual’s abilities. The researcher’s goal of measuring the modeling skills of the students is focused more on finding out if they have what it takes to do modeling activities, specifically graphical/visual modeling.
3.1. Modeling Skill in Systems Analysis and Design
Ferratt, et al [17] reiterated that during a brainstorming session of the members of MIS Advisory board in April 2009 they were able to identify that the most important characteristics of the students that should be recruited in the MIS field is the skill of having business-technology problem solving. This skill bridges the gap between business people and technical people. This gap should be filled up with people gifted with the domain skill in both business and information technology and with the communication skills. Thus, the better way to communicate and eliminate misunderstanding between these two groups of people is coming up with a model.
Systems analysis and design phases are very critical activities in system development phases. This is why most of system failures can be attributed to problems encountered during these phases [18]. System analysis and design consists of planning and design tasks, which are easier to accomplish with diagrammatic illustrations than textual representations. All analysis and design methodology such as structured analysis, information engineering and object-oriented methodology are all anchored in diagrammatic or graphical presentations.
Based on the literature review and readings, the researcher have identified the following skills to be important in order to model business information and process in systems analysis and design:
Due to the unique characteristics of the MIS being the people filling the gap of communication between technical people and business people, the ability to communicate is very important. This is both in verbal and written communications. Diethelm, et al [12] highlighted that written or verbal natural language could be used to define a solution to a given modeling problem. Communication skill is very important that it is needed before, during and after the process of modeling systems. Frederiks and Weide [19] emphasized the use of natural language for efficient requirements analysis that would lead to information modeling. Satzinger, et al [20] also echoes the importance of the ability to communicate with the use of natural languages by saying that no matter how simple or complex a model is it could have different meanings to different people. The models that a modeler creates reflect how well he can communicate proficiently.
Since almost all modeling tasks are dealing with problems, the ability to solve these problems and analyze all the prevailing situations will lead him to make a model that would communicate the real situation[21]. The popular quote of John Dewey[1], which says, ‘a problem well put is half solved’ is very true in systems analysis and design. Analytical skill is considered the most important skill for systems analysts in order for him do his tasks [22].
A common definition of model being a ‘reflection of reality’ means that it can never be totally accurate or complete because every person has different perceptions of a reality [23]. In modeling, the ability to form a mental image when an individual hears a word related to a concept is the start of the process [24]. The ability to abstract the core business tasks and interrelate these ideas to form a graphical model that would mirror the business reality is the nature of modeling skills. Identifying the correct diagrams and notations to convey the idea is essential in creating a model.
3.2. Modeling Skills Assesment
Competencies are measurable capabilities required in performing a task [25]. Part of researches in education is to measure learning outcomes and skills of students for several purposes. In assessing high school chemistry students’ modeling sub-skills, Dori and Kaberman[26] have presented teachers and educators ways to analyze students’ responses both qualitatively and quantitatively. By using their assessment tools, they were able to identify specific difficulties of students in modeling. Huang [27] also was able to determine the difficulties of students and the extent of concepts that they have understood. Assessing the modeling skill of the students help to identify their progress in the skill acquisition process and guide instruction to take into account the intrinsic nature of the skill development [28]. Findings from measuring mathematical modeling of students in China provided a way to improve students’ innovation ability [14].
3.3. Organization of Graphical Modeling Assessment Tool
The assessment tool will be organized according to the previously identified sub-skills in visual modeling. The exam is divided into two (2) sets as shown in Table 1, first set is for the general skills, which are the communication skills and mathematical skills; second set is for graphical modeling skills. The assessment tool allocated 2 major problems for communication skills and 2 major problems for mathematical skills. For communication skills, first problem has 4 questions and the second problem has 3 questions. For mathematical skills, first problem has 3 questions and the second problem has 4 questions. The second set has 3 questions for general diagramming skills, 14 questions for domain-specific modeling skills which are all multiplechoice questions and 2 problems for modeling based on a situation provided. questions and the second problem has 4 questions.
[Table. 1] Breakdown of questions in the modeling assessment tool
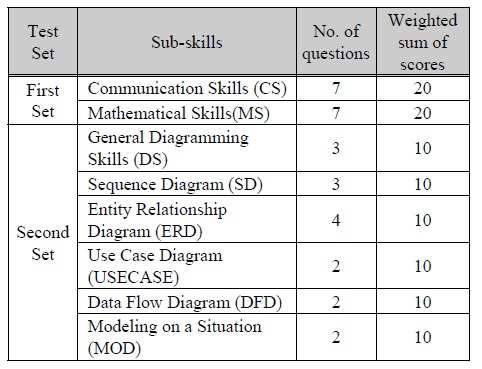
Breakdown of questions in the modeling assessment tool
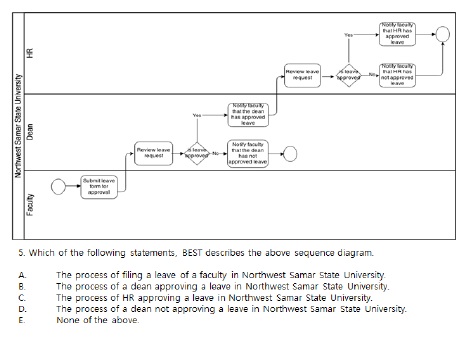
The models identified in Table 1 are the commonly used models in the industry, simple and easy to understand even for first time modelers. The diagrams used was based on Powell's [5] idea that to become effective modeler, it takes logical skills, ability to identify relationships, understanding a context and ability to recognize solutions. Notations for each of the diagram is given before the questions. General diagramming questions test whether a person understand logical processes as shown in a model. Sequence diagram items test the ability to visualize a sequence in which objects interact as shown in Figure 1.
Entity-relationship diagram questions check whether a person can analyze how data is stored and processed based on rules that have been set.. In order to know if the person can follow how a requirement is shown in a model, use-case diagram is used to test their ability. Understanding the context of a system is important in modeling, the data-flow diagram questions check this skill. The last 2 problems that require the students to model a situation using use-case diagram and data-flow diagram.
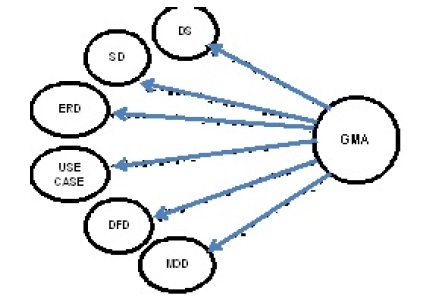
Based on our review of past researches, we conceptualize a research model as shown in Figure 2 that will lead us to answer the validity of the assessment tool made. This model suggests that specific questions on diagramming skills (DS), sequence diagram (SD), entity relationship diagram (ERD), use case diagram (USECASE), data flow diagram (DFD) and modeling on a given situation (MOD) would measure for the graphical modeling ability (GMA) of the students.
According to our research objectives, we seek the reliability and the different tests of validity of the assessment tool that we have designed.
Before using the assessment tools to the students, we have sent through email the assessment tool to ten (10) MIS experts for critics and comments and they responded accordingly.
We collected data from students from the Philippines and from South Korea. The students from the Philippines are all enrolled in Computer Science course and the students from South Korea are from different majors who enrolled in a special class on a special topic on MIS. The first part of the questionnaire is about demographic information about the students, their major, year level (freshman, sophomore, junior or senior), their age and gender. In order to judge the representativeness of our study population and to prove the validity of the questionnaire, this data was collected to describe a sample profile of the participants. The participants of the research were 72 students from the Philippines and 20 students from South Korea.
We tested validity and reliability of the assessment tool made by the researchers. Reliability makes sure that a measuring tool measures something consistently while validity is an indication that it measures what it is supposed to measure. This means that reliability and validity should always go together. This is because the validity of an assessment tool is constrained with its reliability. This simply means that an assessment tool should behave in the same way consistently before we can be sure that it really measures what it supposed to measure [29].
According to Baroudi, et al [30] the reliability of a measure means that it has the same results under different conditions. It should measure something consistently. The purpose of testing the reliability of a test is to reduce the amount of error and increase the reliability of the assessment tool.
While there are a lot of reliability tests that can be used, the researchers used internal consistency reliability, which will confirm that the items on a test measures one, and only one dimension. The Chronbach’s alpha is .610 for the items on the on diagramming skills (DS), sequence diagram (SD), entity relationship diagram (ERD), use case diagrams (USECASE), data flow diagram (DFD) and modeling on a given situation (MOD). Since the writers developed this assessment tool, we want to improve its reliability. As shown in Table 2, USECASE and DFD has the lowest corrected item-total correlation, which is .610. After dropping USECASE and DFD, from the scale, alpha becomes .712. These results show that the DS, SD, ERD, and MOD variables can measure the graphical modeling ability.
[Table. 2] Reliability Test of Items
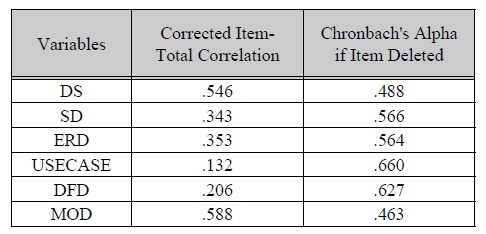
Reliability Test of Items
Content validity means that the test or assessment tool should prove to be as an adequate measure of what is supposed to be measured [31]. This could be done by asking the experts in the topic and consult them if the test is complete enough to measure what you want to measure. The 10 experts in system analysis and design responded positively after sending them through email the assessment tool. They said that the assessment tool’s questions are sufficient enough to measure the graphical modeling ability of students.
Construct validity reflects that a test or an assessment tool is based on some underlying construct [29]. It should validate the theory behind the test that is being measured [31]. Factor analysis was used to show that majority of the questions in the second set in the assessment tool are the measuring variables for the graphical modeling ability. As shown in Table 3, the four variables that was identified in the reliability analysis shows factor loadings are .600 and above with 54.26 explained variance.
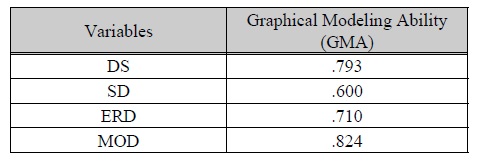
Factor Loadings
Criterion validity demonstrates that a test reveals a set of abilities. Although there are two ways to test criterion validity, that is, concurrent validity and predictive validity, in this study, because of time constraints, we choose to use the concurrent validity [29]. For criterion validity, the first set of questions of the assessment tool is used for this purpose. The graphical modeling skills (GMA) is found to be correlated with the first set of questions which, measures communication skills (CS) and mathematical skills (MS) which, based on the review of past researches, are contributory to developing modeling skills. The results for communication skills (CS) was correlated with the results of graphical modeling ability with R2 = .420 and has statistical significance at .001 level. This means that the graphical modeling ability explains 42% variance of the communication skills of the students. The correlation with mathematical skills (MS) was also statistically significant with the results of R2 = .340 at .001 level. This means that the graphical modeling ability explains 34% variance of the mathematical skills of the students.
While modeling has been very valuable in the development process of information systems, no instrument has been made to measure the graphical modeling ability for people involved in it. This study strives to develop an assessment tool to measure the graphical modeling ability of students working in system analysis and design. We admit that even though the tool has been proved to be statistically valid and reliable, this is just the beginning of the study.
The assessment tool will be very useful for students, professors, universities and even companies. The students can use the instrument to help them assess their skills and abilities in graphical modeling. The professors who are teaching graphical modeling-related classes can also use the assessment tool to assess the graphical modeling ability of the students at the start of the semester. The results of the assessment can be a guide of the professors on how they should go about the class. Companies may use the tool to hire the right people for the analysis, design, development and maintenance for their information systems. The assessment tool could still be significantly improved by doing the following:
Test-retest reliability should be established to strengthen its reliability. Predictive criterion validity should be proved to make the assessment more useful.
Using a separate standardized test on communication skills and mathematical skills could add to its criterion validity.