Experimental transgenesis in fish is useful in genomics research to utilize the recombinant animal model for acquiring the unique genotype and phenotype (Hackett and Alvarez, 2000; Dunham and Winn, 2014). In addition, the transgenic manipulation of aquaculture fish species using gene(s) related to quantitative traits has received attention due to its potential as a powerful tool in the molecular genetic breeding of farmed fishes for productivity enhancement (Nam et al., 2001, 2007). The microinjection of DNA into fertilized eggs has long been utilized to produce transgenic fish strains, although novel methodologies to induce homologous and/or targeted transgenesis have been challenged recently in some fish models (Rembold et al., 2006; Grabher and Wittbrodt, 2007; Casco-Robles et al., 2010). In microinjection-mediated gene delivery, it is widely accepted that the exogenously introduced DNA integrates into vertebrate genomes in an approximately random fashion. Multiple copies of the injected construct usually form a concatemer(s) in tandem arrays, in which the copy sequences are often incomplete at the ends, and DNA nibbling is sometimes observed between repeat units (Bishop, 1996; Baup et al., 2010). The repeat number of transgene copies is reported to be unregulated and varies widely between different microinjection experiments within a given host species injected with identical constructs (Würtele et al., 2003).
The context of transgene integration in the host genome provides the basis for the expression and functionality of transgenic individuals. Transgene expression has been found to be correlated with the integrant copy number in some cases, but studies in mammals have suggested it is related to heterochromatin-associated gene silencing (Koetsier et al., 1996; Kong et al., 2009). Mammalian transgenics have shown that high-copy number transgenes arranged in a large tandem concatemer(s) are prone to structural modification, with a repressive influence on transgene expression, and the resulting transgenic individuals have often displayed inconsistent expression (Dorer and Henikoff, 1997; Geurts et al., 2006). However, this inverse relationship between repetitive copy numbers and transgene expression has also been disputed (Pena et al., 2004).
In contrast to the relatively rich information available in mammals, the interrelationship between transgene insertion patterns and expression profiles has been less well studied in established transgenic fish germlines, with only a few previous studies reported (Wu et al., 2005; Uh et al., 2006). Unlike mammalian transgenics, high-copy number-related depressive regulation has not always been observed in transgenic fish strains. High-copy number transgenic fishes, carrying a long concatemer, have been reported to drive robust transgene expression, sometimes with markedly higher levels than those of single-copy or low-copy number transgenic fishes, particularly when measured absolutely (Nam et al., 2001; Cho et al., 2013a). For this reason, the copy number- and concatemer-dependent expression patterns that are common in mammalian transgenics might not apply to fish transgenics, and hence empirical data on the consequences of non-homologous, illegitimate recombination of transgenes are required in transgenic fish. The paucity of such information may be preventing the development of an effective method to establish stable and functional transgenic germlines.
Herein, we report the transgenic strain-specific patterns of either faithful or repressive expression, with the involvement of transgene concatemerization, as exemplified by marine medaka Oryzias dancena transgenics. Because the transgenically induced fluorescent phenotype could be easily profiled in a qualitative and quantitative fashion, we selected the best fit models from fluorescent transgenic marine medaka lines carrying a β-actin-driven red fluorescent protein (RFP) reporter construct, to scrutinize the potential concatemer-dependency of transgene expression patterns.
Various transgenic marine medaka founders were generated by the microinjection of a fluorescent reporter construct consisting of the RFP gene (DsRed2; Clontech Laboratories Inc., Mountain View, CA, USA) under the control of endogenous β-actin regulator (podβ-actRFP; Cho et al., 2011). Microinjection was performed on one-cell embryos using the ClaI-linearized podβ-actRFP construct suspended at a concentration of 50 μg/ml. The functional ability of the β-actin regulator to drive ubiquitous expression of the red fluorescent reporter in this fish species has been described previously (Cho et al., 2011). Details of the expression patterns of the endogenous β-actin gene, as well as the β-actin promoter-driven RFP expression in marine medaka, were provided in our previous work (Cho et al., 2011). The β-actin-driven fluorescent signal in transgenic marine medaka usually becomes clearly visible by the embryonic stage (onset often occurs at late gastrulation), with the RFP phenotype lasting persistently to adulthood. Using various adult founder fishes, a series of preliminary evaluations were performed to select the appropriate transgenic line models for further characterization. Transgenic strains with extraordinarily high transgene copy numbers (>100 copies per cell) were not considered for further evaluation, because a comprehensive explanation of the transgene integration pattern at the Southern blot hybridization level would not have been feasible. Transgenic lines including those suspected to possess extrachromosomally persistent transgene copies were disregarded. Transgenic lines showing any physiological abnormalities, such as depressed fecundity or viability, were also excluded. Based on preliminary examinations, four transgenic genotype groups were selected for further characterization regarding the interrelationship between transgene integration pattern and transgene expression level.
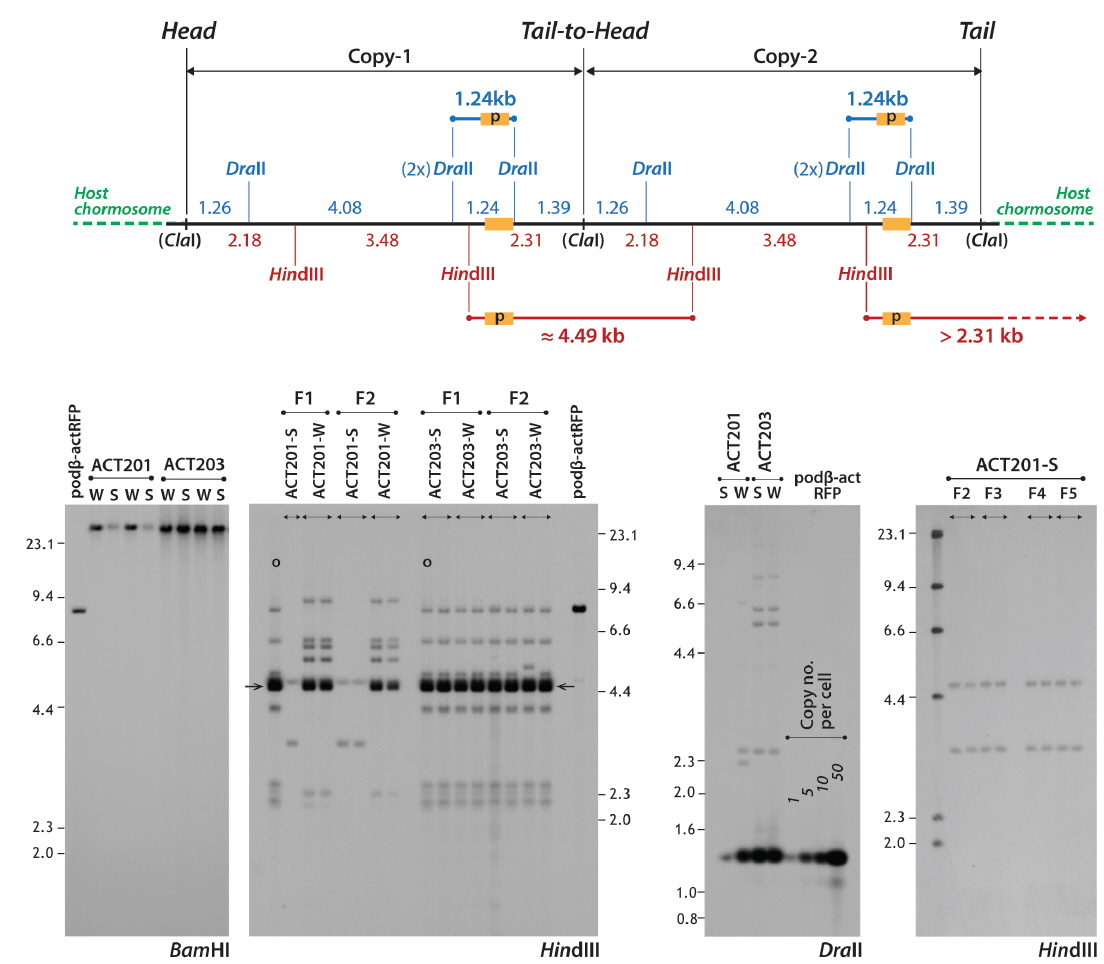
To examine the genomic integration and inheritance patterns of the transgene in the selected strains, a series of Southern blot hybridization analyses was performed. First, the absence of an extrachromosomally persistent transgene copy in the selected transgenic lines was confirmed by Southern blot hybridization using BamHI, a non-cutter of the podβ-actRFP transgene. Second, a hybridization blot using HindIII (two-cutter of the transgene) was conducted to visualize transgene concatemerization and the potential junction site(s) between the transgene and host chromosome. Third, an internal transgene fragment of known size expected to be spliced from the podβ-actRFP irrespective of concatemerization was visualized by blot hybridization using DraII (four-cutter). For all the Southern blot hybridization assays performed in this study, restriction enzyme-digested DNA was separated on 1% agarose gels, transferred to a positively charged nylon membrane (Roche Applied Science, Manheim, Germany), and hybridized using a 483-bp rfp fragment probe. Probe labeling with digoxygenin-11-UTP, hybridization, stringent washing, and signal detection were performed using a DIG DNA labeling and detection kit (Roche Applied Science) according to the manufacturer’s recommendations.
To assess the transgene copy numbers, qPCR was performed using 10 ng genomic DNA as a template. The thermal cycling reaction included 2 × iQ™ SYBR® Green Supermix (Bio-Rad, Hercules, CA, USA) and a PCR primer pair (qDsRed-1F: CACAACACCGTGAAGCTGAA and qDsRed-1R: GAAGGACAGCTTCTTGTAG). The amplicon was a 141-bp internal rfp fragment (Cho et al., 2013b). The amplification signal was detected using an iCycler® Real-Time Optical Module (Bio-Rad). Amplification was normalized to the endogenous β-actin gene actb (GenBank accession number HM347346) to ensure similar DNA input across samples (Cho et al., 2013b). Standard curves were prepared using 4-log dilutions (1 ‒ 1,000 copies) of positive podβ-actRFP plasmid, and a PCR efficiency greater than 90% was confirmed for each amplification reaction. Four F1 individuals from each transgenic group were examined using triplicate assays per DNA sample.
Transgene expression in the selected lines was characterized at the mRNA (qRT-PCR assay of rfp transcripts), protein (Western blot of RFP protein) and fluorescent phenotype (external appearance and fluorescence microscopy) levels. Total RNA extracted from whole-body juveniles was reverse transcribed into cDNA using the Omniscript Reverse Transcription kit (Qiagen, Hilden, Germany), including oligo (dT)20 primers and an O. dancena 18S rRNA reverse primer (Cho et al., 2013a). The prepared cDNA template was subjected to real-time thermal cycling to amplify either the 142-bp rfp fragment using a pair of oligonucleotides (qRT-RFP 1F: 5′-CACAACACCGTGAAGCTGAAG-3′ and qRT-RFP 1R: 5′-GGAAGGACAGCTTCTTGTAGT-3′) or the 188-bp 18S rRNA normalization control using qOD18S 1F (5′-AAGCTCGTAGTTGGATCTCG-3′) and qOD18S 1R (5′-CCTAGCTGCGGTATTCAGGC-3′) primers. The relative expression levels of rfp transcripts were based on normalization against 18S rRNA, as described previously (Cho et al., 2011). The average PCR efficiency ranged from 92 to 99%. Differences between the transgenic genotypes were assessed using an ANOVA, followed by Duncan’s multiple range test at P = 0.05, based on triplicate examinations.
For Western blot analysis, the amount of soluble protein in the homogenate supernatant prepared with whole body fry was measured using a BCA protein assay kit (Pierce Biotechnology, Woburn, MA, USA). Resolved proteins from sodium dodecyl sulfate-polyacrylamide gel electrophoresis (SDSPAGE) were electrotransferred onto a nitrocellulose membrane (Amersham Pharmacia Biotech, Piscataway, NJ, USA) using a Trans-Blot® SD semi-dry transfer cell (Bio-Rad) and probed with Living Colors® DsRed monoclonal antibody (Clontech) diluted 1:2,000, and then with alkaline-phosphatase conjugated anti-mouse IgG secondary antibody (Santa Cruz Biotechnology Inc., Santa Cruz, CA, USA) diluted 1:4,000. Positive signals were visualized using a colorimetric method with nitroblue tetrazolium salt (Sigma-Aldrich, St Louis, MO, USA) and 5-bromo-4-chloro-3-idolyl phosphate (Sigma-Aldrich) and then analyzed using Quantity-One image analysis software (Bio-Rad).
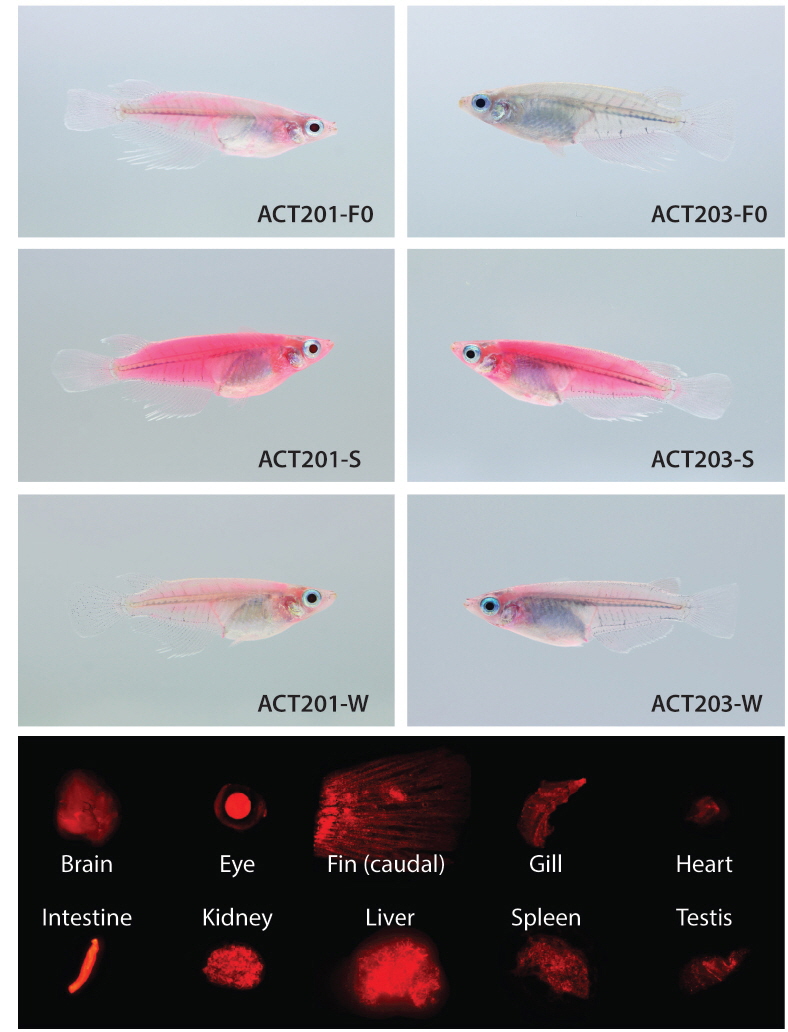
At the fluorescent phenotypic level, the RFP signals in transgenic models were analyzed using an AZ100 fluorescence microscope equipped with NIS-Elements BR image analysis software (ver. 3.1; Nikon Corporation Instruments Company, Tokyo, Japan) as described previously (Cho et al., 2011). The external appearance of RFP phenotypes in transgenic individuals were photographed using an EOD 5D Mark II digital camera (Canon, Tokyo, Japan) under either normal daylight or ultraviolet (UV) light (black light lamp; 352 nm; 15W; Sankyo Denki Co., Ltd., Tokyo, Japan). RFP signals in the internal organs (brain, eye lens, fin, gill, heart, intestine, kidney, liver, spleen, and gonads) were examined by fluorescence microscopy as described above.
Two germline positive founders (ACT201 and ACT203) passed on their fluorescent transgene to F1 progeny, with respective frequencies of 25 and 37% for RFP (+) F1 embryos, suggesting that the mosaic status in their germ cells was similar to those of most transgenic founders developed by microinjection (Iyengar et al., 1996; Kim et al., 2004). However, interestingly, the expression pattern achieved in F1 individuals from each of the two founders was not uniform. Strikingly different RFP levels were apparent among F1 individuals from a given founder, in which some F1 offspring displayed very strong RFP signals whereas others exhibited only faint RFP expression by external appearance. From the ACT201 founder, the proportion of F1 progeny with strong RFP expression (labeled ACT201-S) of the total RFP (+) F1 fish was approximately 20%, while the remaining 80% RFP (+) F1 displayed only weak expression (labeled ACT201-W). Conversely, the ACT203 founder resulted in similar incidences (1:1 ratio) of strong (ACT203-S) and weak (ACT203-W) expression. The transgenic F1 fish selected from ACT201-S, ACT201-W, ACT203-S, or ACT203-W lines were able to transmit their phenotypic characteristics to F2 fish, exhibiting Mendelian frequency. Differences in the external fluorescent appearance between strong and weak RFP types within a given lineage were clearly apparent (Fig. 1). The red fluorescent signals visualized over the whole body in transgenic individuals belonging to either the ACT201-S or ACT203-S lines were stunningly bright, and red fluorescence could be observed easily with the unaided eye under normal daylight conditions. Conversely, the ACT201-W and ACT203-W lines had only moderate or weak red fluorescence in their external appearance, although they could easily be distinguished from non-transgenic, wild-type individuals. Notably, several individuals belonging to the ACT203-W line lost the clear RFP signal in their eyes (data not shown). From microscopic examinations of the internal organs, transgenic individuals usually retained the ubiquitous distribution pattern over a wide array of tissues examined (Fig. 1), indicating that the transgenically introduced β-actin promoter could induce expression resembling the pattern of the endogenous β-actin gene (Cho et al., 2011; Lee et al., 2012). However, in several transgenic individuals belonging to the ACT203-W line, the presence of RFP (-) organs was determined under fluorescence microscopy conditions, although the organs lacking RFP signals (eye, heart, spleen, and/or testis depending on individuals; photograph not shown) were not uniform among these transgenic individuals.
Transgenic fish belonging to one of the four phenotypic groups (i.e., ACT201-S, ACT201-W, ACT203-S, and ACT203-W) were subjected to genomic Southern blot hybridization assays using different restriction strategies (Fig. 2). Southern blot hybridization using a non-cutter enzyme BamHI confirmed that none of the transgenic individuals (F1 fish) showed a notable sign of the presence of extrachromosomally persistent copies, as evidenced by the presence of a single hybridization signal in the high molecular weight range. Southern blot hybridization using HindIII suggested that the ACT201 founder experienced two different, independent genomic integration events during its embryonic development, consequently leading to the chimeric status in germ cell populations at adulthood. In the ACT201 lineage, the ACT201-S line showed two hybridization-positive bands at positions 3.0 and 4.7 kb (total copy number of the transgene = 2.41 based on a qPCR assay), while the ACT201-W line showed six bands in the range of 2.3 to 9.0 kb (total copy number of the transgene = 26.25 based on a qPCR assay). Considering the restriction sites recognized by HindIII, the relatively strong bands at 4.5 kb seen in ACT201-W F1 individuals could be a sign of tail-to-head concatemerization (i.e., joining of the 2.31-kb tail to the 2.18-kb head), suggesting that the transgenic insertion site contained a large number of tandem copies (Fig. 2). Because the F1 fishes transmitted the fluorescent transgene to the next generation following the Mendelian ratio of single gene inheritance, these multiples in the concatemer(s) might insert into a single chromosomal site, or into very close neighboring sites within a chromosome (Nam et al., 1999; Cho et al., 2013a). In contrast, the ACT201-S F1 individuals displayed two hybridization signals. One was visualized slightly above the 4.5-kb tail-to-head concatemer-associated band seen in the ACT201-W group. The other hybridization signal was visualized at 3.0 kb in the ACT201-S group. Taking into account the similar hybridization intensities between the two bands, the approximate copy number of integrants was close to 2, which was in agreement with the copy number estimated by qPCR (average of 2.41 copies per cell). These bands might reflect the junction regions between transgene and host chromosomes, although direct cloning is required to verify the detailed structure of the junction sites. Each of the ACT201 F1 types (i.e., -S and -W genotypes) was successfully transmitted from the F1 to F2 generations, without structural modifications seen at the Southern blot levels, suggesting that the potential hemizygous genotype for the transgene could be established in each phenotypic lineage.
Unlike the ACT201 lineages, only a single hybridization pattern was found in the HindIII blot for F1 transgenic individuals from the ACT203 founder, irrespective of the RFP phenotype. The HindIII digestion of the ACT203 F1 transgenic line produced at least eight recognized bands ranging from 2.2 to 8.0 kb without notable variability among F1 individuals (average copy number = 42.10 based on qPCR). Similarly to the pattern from the ACT201-W group, all the F1 transgenic individuals belonging to either the ACT203-S or ACT203-W groups showed a common, hybridization signal at 4.5 kb, which corresponded to the band resulting from tandem tail-to-head concatemerization of multiple copies. The intensity of the concatemer-originating band in the ACT203 lineage was stronger than that in the ACT201-W line, suggesting that the ACT203 transgenic individuals might possess a larger concatemer(s) compared with the ACT201-W group. The F1 fish belonging to the ACT203-S group were successful in transmitting their hybridization pattern to F2 fish without any changes, while some F1 individuals from the ACT203-W group showed a small modification of the hybridization pattern at 5.0 kb during transmission to the F2 generation
Another Southern blot assay using the DraII enzyme showed that the 1.24-kb internal fragments were spliced out successfully from most transgene copies for each transgenic strain. However, unlike ACT201-S, in the other three lines (ACT201-W, ACT203-S, and ACT203-W containing a long transgene concatemer), some transgene copies were resistant to digestion by DraII. In addition to the expected 1.24-kb band, the ACT201-W group showed a weak hybridization signal at 6.6 kb and two bands at 2.3 kb. Four unexpected hybridization bands at approximately 9.0, 6.0, 5.5, and 2.5 kb were visualized in both the ACT203-S and ACT203-W transgenic lines. DraII (but not HindIII) is a methylation-sensitive enzyme, inhibited at purine-G/GNC*C-pyrimidine by 5´-methylcytosine as indicated (*) (Schnetz and Rak, 1988). Hence, the resistance of such copies to DraII digestion, as detected in the concatemer-containing transgenic lines, might reflect methylation of the transgene, although the possibility of other undefined modification(s), including the destruction of DraII sites in certain transgene copies, cannot be discounted. Concatemer-mediated methylation of other transgenes has also been reported, and methylation-associated epigenetic modification is considered to be an important factor affecting the downregulation and silencing of transgene activities (Matzke et al., 2000). After examination up to the F2 generation, the ACT201-S line was selected and further propagated to verify consistent transmission of its transgenic genotype through numerous subsequent generations to confirm the stable establishment of the functional transgenic insertion site.
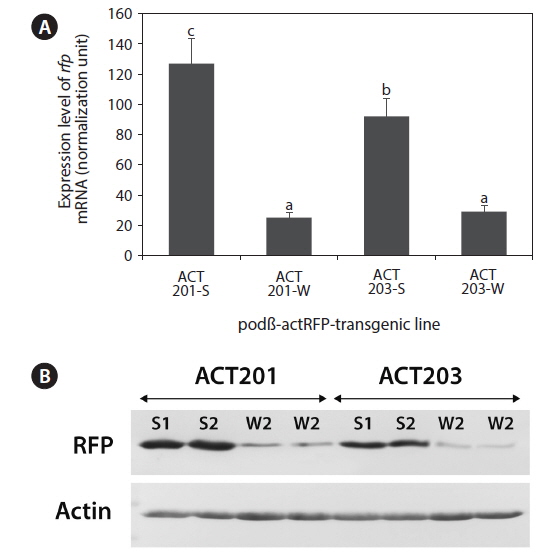
The transgenic lines ACT201-S/W and ATC203-S/W were subjected to expression analyses at the mRNA (qRT-PCR), protein (Western blot), and phenotype (fluorescent appearance) levels. qRT-PCR of rfp transcripts indicated the highest mRNA expression in the ACT201-S line, followed by ACT203-S (P <0.05). The ACT201-W and ACT203-W lines showed similarly weak expression of rfp transcripts (P >0.05) (Fig. 3A). The mRNA expression pattern was also well correlated with the protein expression pattern observed by Western blot; in terms of the significantly abundant expression of RFP in ACT201-S and ACT203-S compared with the low expression in ACT201-W and ACT203-W (Fig. 3B). Collectively, the expression data assessed at the mRNA and protein levels were congruent with the phenotypic fluorescent characteristics acquired in the transgenic individuals.
Taken together, the data presented here suggest strain-dependent patterns for the interrelationship between insertion structure and expression characteristics of the transgene expressed in marine medaka. As evidenced in the ACT201-S/W families, transgenic expression could be downregulated in transgenic fish strains by the formation of a long concatemer. Low-copy number transgenic fish without a long concatemer (ACT201-S) had a significantly higher level of transgene expression than that of their siblings with high transgene copy numbers in the tail-to-head concatemer (ACT201-W). Because these two unique transgenic genotypes originated from a single founder, the genetic background of the hosts does not need to be seriously contemplated as a potential factor affecting transgene expression. The main reason for the inverse relationship between transgene copy number and expression strength in the ACT201 lineages might be the long concatemer-associated epigenetic methylation at the transgene insertion sites (as supported by DraII digestion data), consequently leading to significantly depressed transgene activity in the transgenic fish carrying a long tandem array of transgene copies. However, this concatemer-mediated regulation pattern is not always displayed in all transgenic lines (Cho et al., 2011, 2013b). As evidenced by the ACT203 families in this study, the identical transgene genotype seen by Southern blot might not be indicative of similar expression characteristics among the transgenic siblings. Unfortunately, the specific mechanism behind the different expression patterns between the ACT203-S and ACT203-W lineages is not yet understood. It is possible that the differential degree of methylation, especially in the promoter region, between the two lineages, could not be visualized simply by the DraII-blot. The exclusive occurrence of RFP-negative organs in certain individuals of the ACT203-W line might be, at least in part, related to differences in methylation patterns among individuals of this line. A more quantitative approach to measure the degree of methylation, including bisulfite sequencing potentially, is needed to obtain a deeper insight into the transgene methylation status (Feng et al., 2011). In vivo treatment of methyltransferase inhibitor(s) could also be a rational approach to determine whether the expression profile of the transgene can be modified in certain transgenic lines by methylation-associated silencing of the transgene (Gibbs et al., 1994).