Mass spectrometry (MS) technology enables the analysis of proteins from cells and tissues with high sensitivity and reproducibility.1 Most of the proteome analyses using MS technology follow the bottom-up approach, which consists of sample preparation, separation, and analysis by tandem mass spectrometry. During the past decade, numerous studies have been performed to develop different kinds of multi-dimensional separation technologies and to improve the performance of mass spectrometry instruments.2 Advances in the sample preparation stage are relatively slower than the above developments.
To improve the protein digestion process in proteomic sample preparation, two major efforts focused on utilizing novel detergents to improve solubility and rapid digestion using heat, ultra-sonication, high pressure, infra-red energy, microwave energy, alternating electric field, and micro reactors (immobilized trypsin) assisted proteolysis.3-9 However, protein denaturation, which can play a dynamic role in sample preparation, did not receive much interest. Bottom-up proteomic sample preparation utilizes detergents (SDS) and denaturation agents (Urea) for complete or maximum solubility and denaturation of proteins.10 The major disadvantage of these detergents and denaturants is that they are not compatible with the mass spectrometric analysis, reduces trypsin functionality at higher concentrations, and need to be removed prior to analysis. The other approach utilizes heating the sample at 95℃ for 5 min, which can be reversible if the sample is not processed immediately.9,11 Organic solvents as denaturing agents have also been used, but they have been shown to precipitate protein; hence, the concentration has to be carefully examined. Protein denaturation to unfold secondary and tertiary structures and to ensure the complete tryptic digestion is one of the rate limiting steps in sample preparation. The more the protein is exposed to trypsin, the more tryptic peptides are obtained, which will result in increased sequence coverage. In some cases, trypsinization yields larger fragments due to incomplete digestion of hydrophobic peptides, which may be due to incomplete denaturation of protein or reversible refolding of the denatured protein.12 Complete unwinding of the alkylated and reduced protein can result in increased exposure of arginine and lysine residues for proteolytic activity, providing a higher number of peptides for analysis. Hence, the protein sample has to be completely unfolded to its primary structure in order to expose the hydrophobic and hydrophilic residues for trypsin action.
In this study, we utilized a heating device originally developed to replace protease inhibitors.13-15 The instrument has been developed by a group of Swedish scientist working with Uppsala University to analyze human tissue and prevent post mortem alterations to brain cells in particular, which are more vulnerable to proteolytic enzymes than other tissues. This device provides uniform heating of the sample at 95℃ that enables the effective denaturation of the protein. To demonstrate the effectiveness of the heat shock on multiple proteins, we selected 3 cell lines (a human lung cancer cell line (A549), a human embryonic kidney cell line (HEK293T), and a human colorectal cancer cell line (HCT-116)) and compared protein denaturation via LC-MS/MS analysis using label free quantification. The improvement obtained by heat shock process was demonstrated in terms of variations of peptide abundance and number of differentially expressed proteins. The sensitivity of the heat shock was studied by comparing the total number of peptides and proteins identified between normal and heated samples. The reproducibility of the label free quantification results was tested from the peptide peak area and the pattern of proteolysis was compared in HCT-116 cell lines.
The system for heat shock was from Denator AB (Stabilizer TM T1, Goteborg, Sweden), A549, 293T, and HCT-116 were purchased from the American Type Culture Collection (ATCC, Manassas, VA, USA). Tris (2-carboxyethyl) phosphine (TCEP) was obtained from Thermo Fisher Scientic (Rockford, IL, USA). Iodoacetamide (IAA), standard protein (Bovine serum albumin (BSA)), â-lacto globulin, concanavalin, transferrin, and histone), Bis Tris, 6-amino caproic acid and tricine were acquired from Sigma Aldrich (St. Louis, MO, USA). C-18 micro spin column was purchased from Harvard apparatus (Boston, MA, USA). Sequencing grade modied trypsin was obtained from Promega (Madison, WI, USA). Acetic acid, acetonitrile, and high-performance liquid chromatography (HPLC) grade water were from J.T. Baker (Phillipsburg, NJ, USA). Protease inhibitor cocktail (complete) and phosphatase inhibitor cocktail (phosstop) tablets were obtained from Roche (Pleasanton, CA, USA). NativePAGETM 3-12% Bis- Tris Gel was purchased from Novex® by Life technologies (Carlsbad, CA, USA).
A549 cells were cultured in 100 mm dish containing RPMI 1640 medium supplemented with 10% fetal bovine serum and 1% penicillin/streptomycin. Cells were cultured as monolayers in culture dishes in 80-95% humidity and 5% CO2 at 37℃. The cells were harvested by gentle scrapping, reconstituted in PBS, and centrifuged to get the pellet for sample preparation for LC-MS/MS analysis.
>
Protein digestion and desalting
A549 cells were processed in biological triplicates for each group and the harvested cells were immediately subjected to heat shock or protease inhibitor treatment. Cells were processed with protease inhibitor cocktail for the control group, while heat-treated cells were not processed with inhibitors. The cells were lysed by focus sonication using Covaris in the presence of 2 mL 8M urea in 0.1M Tris-HCl at pH 8.5 and protein was quantified by BCA assay (Thermo) with BSA as a standard.16 One hundred micrograms of protein were reduced with 5 mM TCEP for 30 min at 37℃ and the proteins were alkylated by blocking the cysteine residues using 15 mM iodoacetamide at 25℃ for 1 h in the dark. The pH was adjusted to 8 using 1M Tris (pH 8.5) and the urea concentration was reduced to below 2M using 10 mM Tris. The reduced and alkylated proteins were digested using sequence graded trypsin at a 1:50 ratio of protein to trypsin at 37℃ overnight. The activity of trypsin was stopped by adding formic acid and the pH was reduced to 2-3 before desalting. The digested peptides were desalted using C18 microspin columns and the peptides were eluted with 80% ACN in 0.1% TFA in water.
The digested peptides were dried using speedVac and suspended in 0.1% TFA for LC-MS/MS analysis. Peptides were separated using a nano pump connected to a high pressure liquid chromatography system in the presence of HPLC chip [large capacity chip, 150 mm × 0.075 mm id analytical and 160-nL trap columns packed with Agilent ZORBAX SB-C18, 5 μm, 300Å (G4240-62010)]. The peptides were loaded to the trapping column at a flow rate of 0.3 μL/min, with HPLC grade water in 0.1% formic acid as the mobile phase A and 90% ACN, 0.1% FA in HPLC grade water as the mobile phase B. The peptides were separated using a 120 min gradient with 90 min for peptide elution and 20 min for washing the column. Peptide separation was carried out using the gradient elution: 0-90, 95-55% A; 90, 10-100, 55-10% A; and return to the original conditions for the next 20 min. Before MS analysis, the machine was calibrated with reference mass values at least below 1 ppm. MS data acquisition parameters were set for precursor absolute threshold (500 counts) and relative threshold (0.01%).Precursor ion was selected following as exclude after 2 spectra and the precursor ion released after 0.5 min. The samples were run in triplicates with blanks in between samples to clean the column. Mass spectrometry analysis was performed using 6550 Accurate-Mass Quadrupole Time-of-Flight (Q-TOF) LC-MS/MS (Agilent Technologies, Wilmington, DE, USA) with HPLC-chip cube source.
>
Optimization of the heating time
A549 untreated cells were reconstituted in PBS, divided into four groups, and subjected to 15, 30, 60, and 120 s of rapid and reproducible heating at 90-95℃ to preserve the whole proteome.
The effect of heating on sample processing for MS/MS was analyzed using A549 untreated cells. A549 cells were divided in two groups. The first group was subjected to heat treatment for 30s, while the second group was processed without heating and protease inhibitors.
The total number of peptides and proteins was quantified using control and doxorubicin (2.5 μM; 48 h) treated A549 cells to determine the differential expression of proteins in control and treated cells.
The raw les generated by the Q-TOF were converted to mzXML file format by trapper (version 4.2.0) and processed with Sorcerer (version 3.5) using the Uniprot protein Fasta database (2012, October version, 143886 protein entries), including commonly observed contaminants.17 The following parameters were used: cysteine carbamidomethylation was selected as xed modication; methionine oxidation; protein N-terminal carbamylation; and enzyme specicity was set to trypsin. Up to two missing trypsin cleavages were allowed. Precursor ion mass tolerances were 20 ppm and fragment ion mass tolerance was 0.1 Da for MS/MS spectra. If the identied peptide sequences from one protein were equal to or contained within another protein’s peptide set, then the proteins were grouped together and reported as one protein group. PeptideProphet (Seattle Proteome Center, Institute for System Biology, Seattle, WA, USA) is a tool for generating statistical validation of MS/MS search engines’ spectra-to-peptide sequence assignments. ProteinProphet makes use of results from PeptideProphet, which produces validation results for peptide sequence identification. PeptideProphet probability not less than 0.9 was used to identify peptides and proteins.18
The IDEAL-Q software was utilized to process the LC-MS/MS data. The tool adopts a stringent validation step on Signal-to-noise ratio (2.5), charge state, and isotopic distribution (SCI validation) to ensure quantitation accuracy. It improves the elution time prediction algorithm by an EM algorithm and extends the alignment approach for SIL and label-free quantitation. The EIC was used to determine the peptide abundance in an LC-MS run.19 The differentially expressed protein were analyzed for protein networking using ingenuity software with a
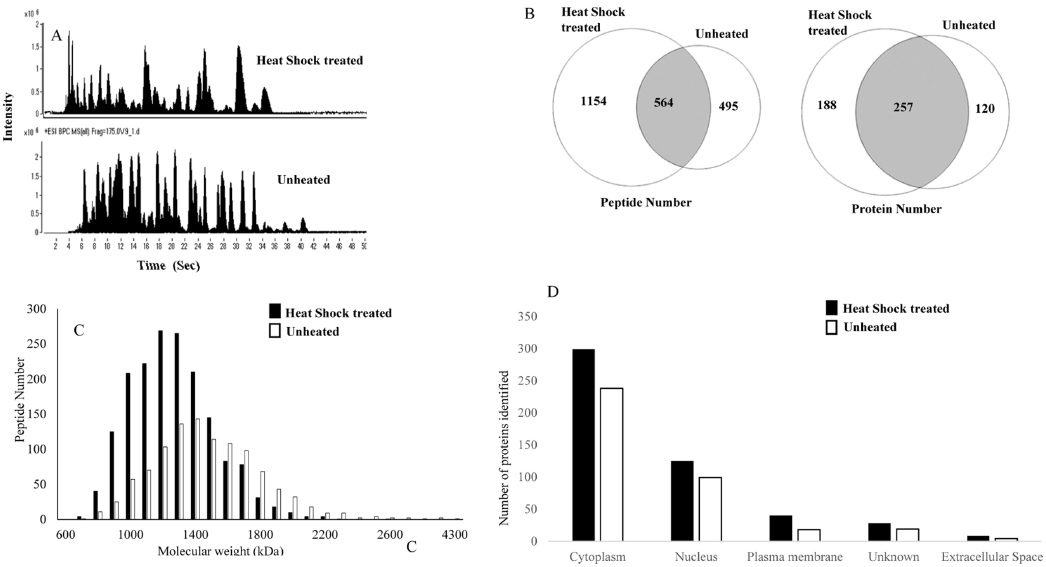
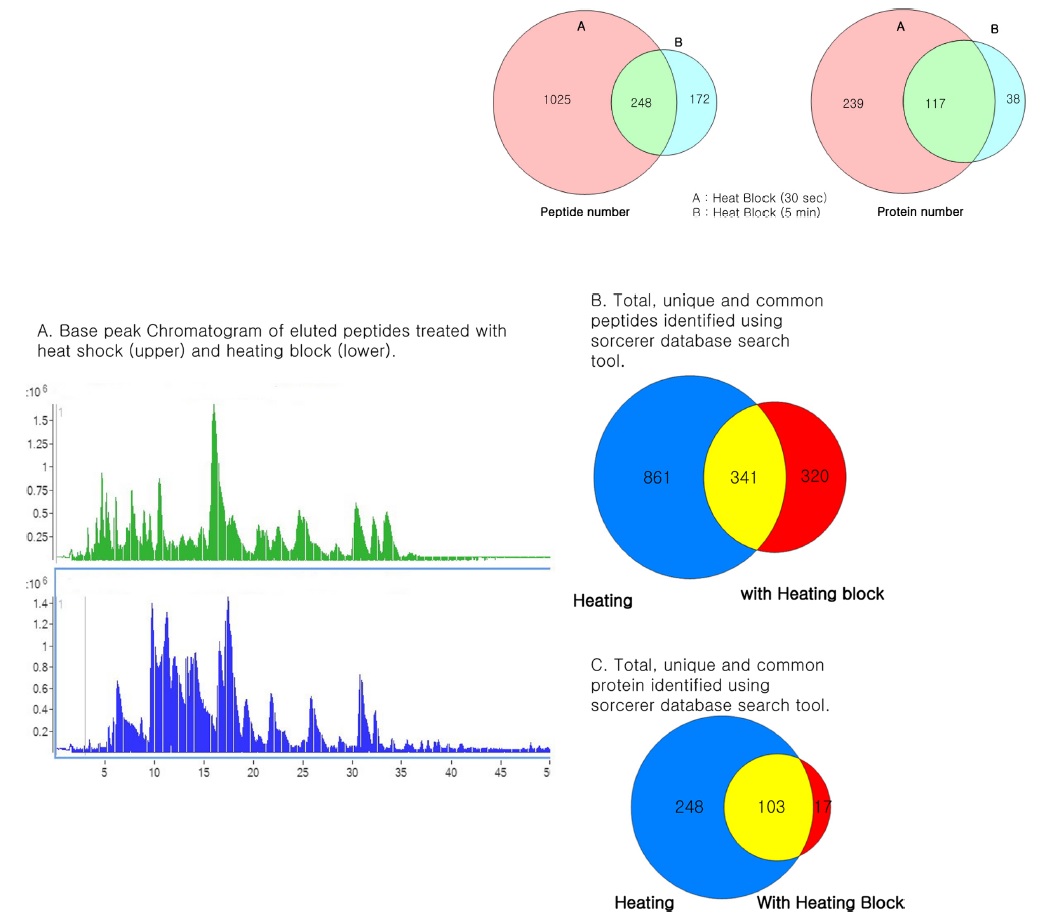
In this study, we attempted to refine the sample preparation step for proteomic analysis by introducing a heating step before trypsinization to efficiently denature proteins from cell lines in order to identify more peptides and proteins from biological samples. The efficiency of the heat shock treatment was evaluated by comparing LC-MS/MS results of samples prepared by using a conventional preparation method. For each sample, triplicate LC-MS/MS runs were carried out to increase peptide and protein identification. The proteome of A549 cell line was analyzed with and without heat shock treatment (Fig. 1). Figure 1A shows base peak chromatograms (BPC) of the samples. The elution patterns were quite different. Heat shock treated samples presented peptides that were eluted earlier. A total of 1718 peptides and 445 proteins were identified from heat shock treated samples. These results indicate that heated samples showed an increase of 60 and 18% in peptide and protein identification, respectively, when compared to protease treated samples. As shown in Figure 1B, the identified peptides and proteins were quite different between the heat shock and protease treated samples, although the same cell line was used. To determine the differences, we investigated the molecular weight distribution of the identified peptides (Fig. 1C). A much higher population of smaller peptides were generated from heat shock treated samples. Figure 1D illustrates the difference in intracellular protein localization in heat shock and protease treated A549 cells. A large number of cellular component proteins were identified in the heated samples. This result shows that heating the sample prior to trypsinization is more efficient for proteome wide LC-MS/MS analysis to identify more peptides and proteins in samples.
Our hypothesis is that the heat shock treatment increases the access to trypsin cleavage sites. In protease treated samples, almost 68% (257/377 proteins) of proteins identified were also identified in the heated samples, while 57% (257/445) of proteins identified in heated samples were also identified in unheated samples. Increased identification of peptides leads to higher sequence coverage of the protein.4,21
>
Optimization of heating time
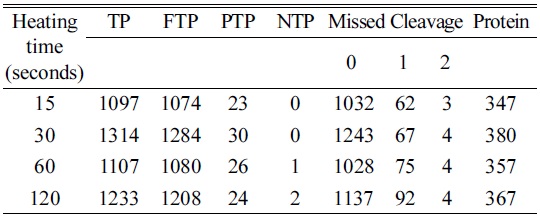
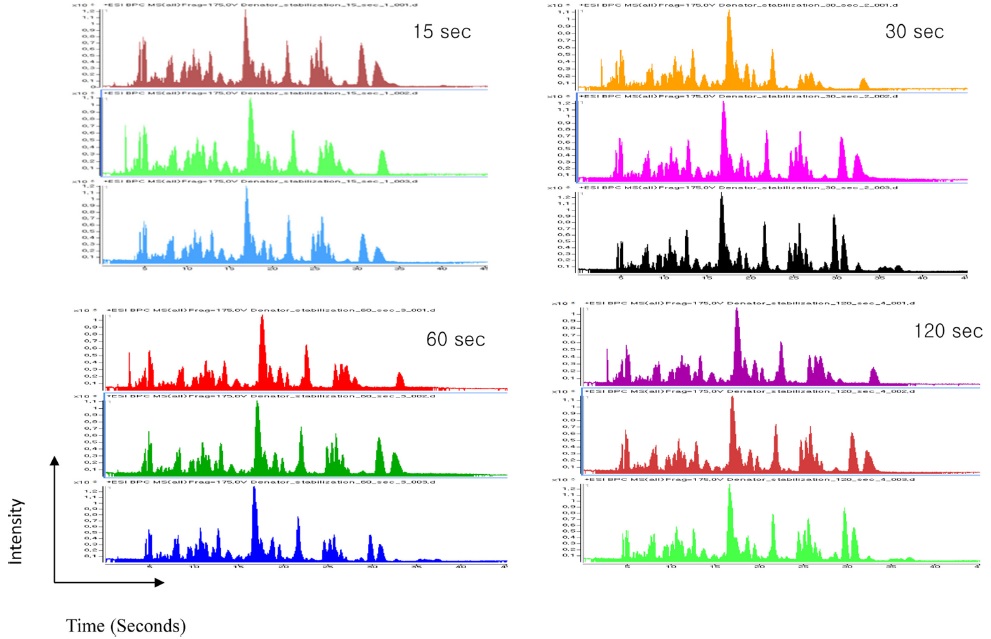
The heating time was optimized for cell lines using four different time points (15, 30, 60, and 120 s). Among the four time points used, we were able to identify a higher number of peptides and proteins using a 30 s heat shock traetment and the increase in time up to 120 s did not yield a significant increase in identified peptides and proteins (Table 1). Additionally, a 30 s heat treatment showed 98% and 94% of tryptic and zero missed cleavage sites, respectively. The elution profile showed a very similar pattern for all the selected time points as shown in Figure 3. Hence, the optimum heating time was selected to be 30s for further treatments.
[Table 1.] Optimization of heating time for heat shock

Optimization of heating time for heat shock
>
Effect of heating in label-free quantification
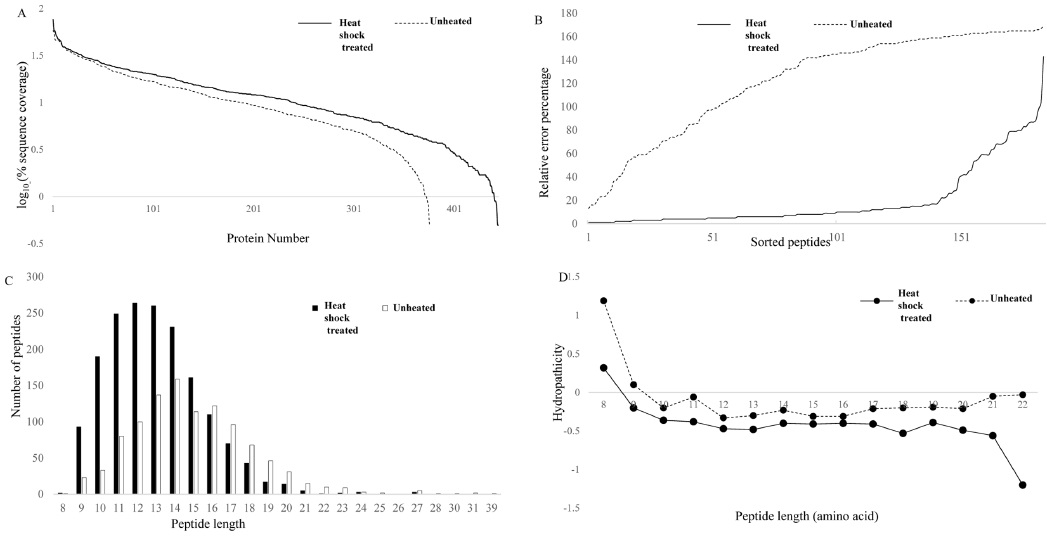
In current shotgun LC-MS/MS based quantitative proteomic approaches, proteins are quantified by measuring the relative peptide abundances. Therefore, reproducible and reliable peptide preparation is required to obtain accurate quantification values.22,23 In this study, we carried out label-free quantification for triplicate analysis and subsequent LC-MS/MS runs of the samples for the two methods. Shorter peptides (<6 AA) are generally not detected in shot gun proteomics, and the detection and identification of larger fragments by MS are often difficult.24 Heat shock treated samples yielded 773 quantifiable peptides, while protease treated samples yielded only 399 quantifiable peptides. This clearly shows a 51% increase in the peptide number, which helps in the protein identification gains. Figure 2A shows the rank abundance plot for heat shock and protease treated samples. Heated samples generated more peptides, which helped in the identification of proteins with a higher sequence coverage compared to that of the protease treated samples. Figure 2B shows the relative error percentage for the average peak height of common quantifiable peptides sorted from the lowest to the highest variation. Figure 2 clearly shows that the heat shock treated sample had a very low variation in error percentage, resulting in increased proteome coverage ability. This means that heat-treatment induced a more reproducible protein digestion. Figure 2C shows the distribution of peptides based on their amino acid length. Heated samples showed a higher number of smaller peptides with an average amino acid sequence of 13, while the average peptide length for unheated samples was 15, denoting a higher number of shorter peptides in the heat shock samples. Heated samples showed a large number of small molecular weight hydrophilic peptides, which may be due to the availability of increased cleavage sites as a result of efficient denaturation. Hence, trypsin cleaved the proteins using most of the cleavage sites, eventually leading to a higher number of peptides using the heat shock method, while the proteins obtained using the other method might have been in folded forms, making trypsin cleavage difficult.
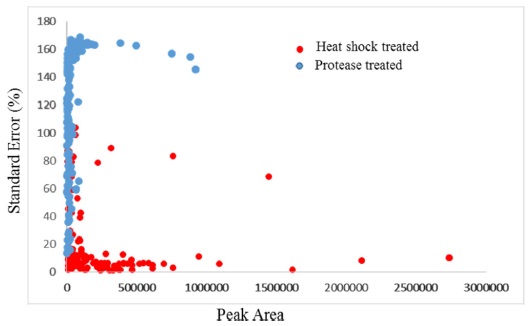
The hydropathicity scale of the peptides eluted from both groups were examined with ExPASy ProtParam tool based on Kyte-Doolittle scores.25 The Kyte-Doolittle scale is a widely applied scale for delineating hydropathicity of a protein or peptide, based on standard values for individual amino acids.26 The plot area corresponding to above zero represents hydrophobic peptides and those below zero are hydrophilic in character. Figure 2D shows the relative hydrophobicity of the peptides based on peptide length. The number of hydrophilic peptides increased in heat treated samples when compared to protease treated samples. Figure 4 shows the distribution of peak area against the standard eror percentages of the common peptides from heat shock and protease treated samples. Variations in the peptide abundances in high and low abundant peptides were low in heat shock treated samples compared to the protease treated samples. This shows the reproducility of the peptide identification wich can be achieved by heat shock treatment when executedcarefuly. The percentage of variation between triplicate analyses was very high in unheated samples, while heated samples showed very low variations between triplicate samples. Among the quantifiable peptides, 7% were below 20% SE in heated samples, while unheated samples showed only 2.1% of peptides below 20% SE. Heat denaturation led to the identification of more peptides compared to the unheated samples, which may be due to the complete unwinding of the protein.
>
Quantitative analysis of A549 cell line
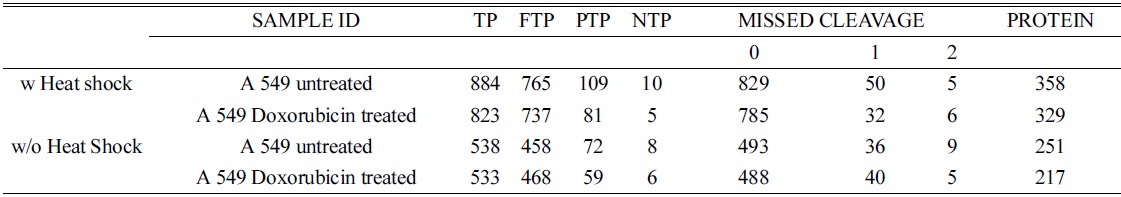
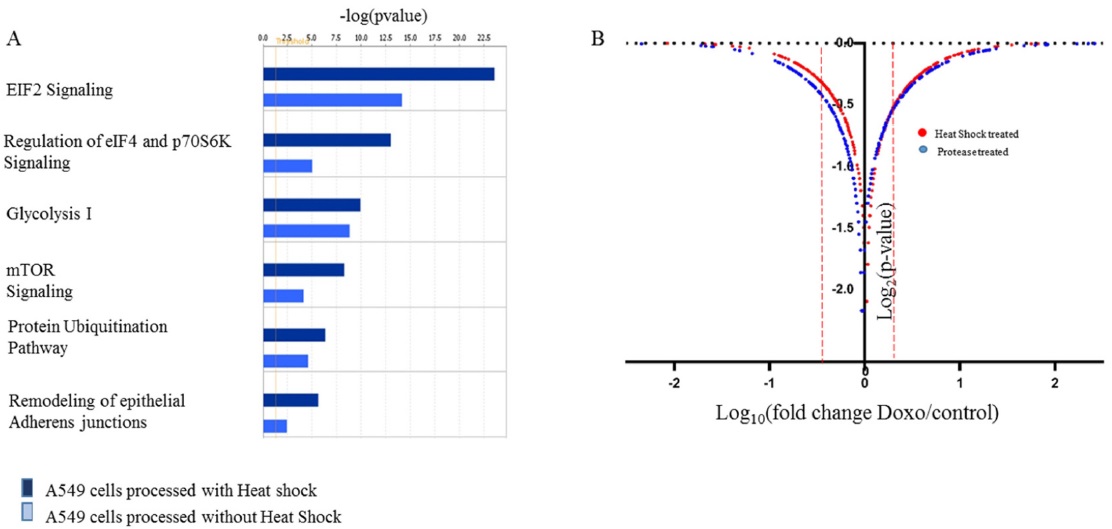
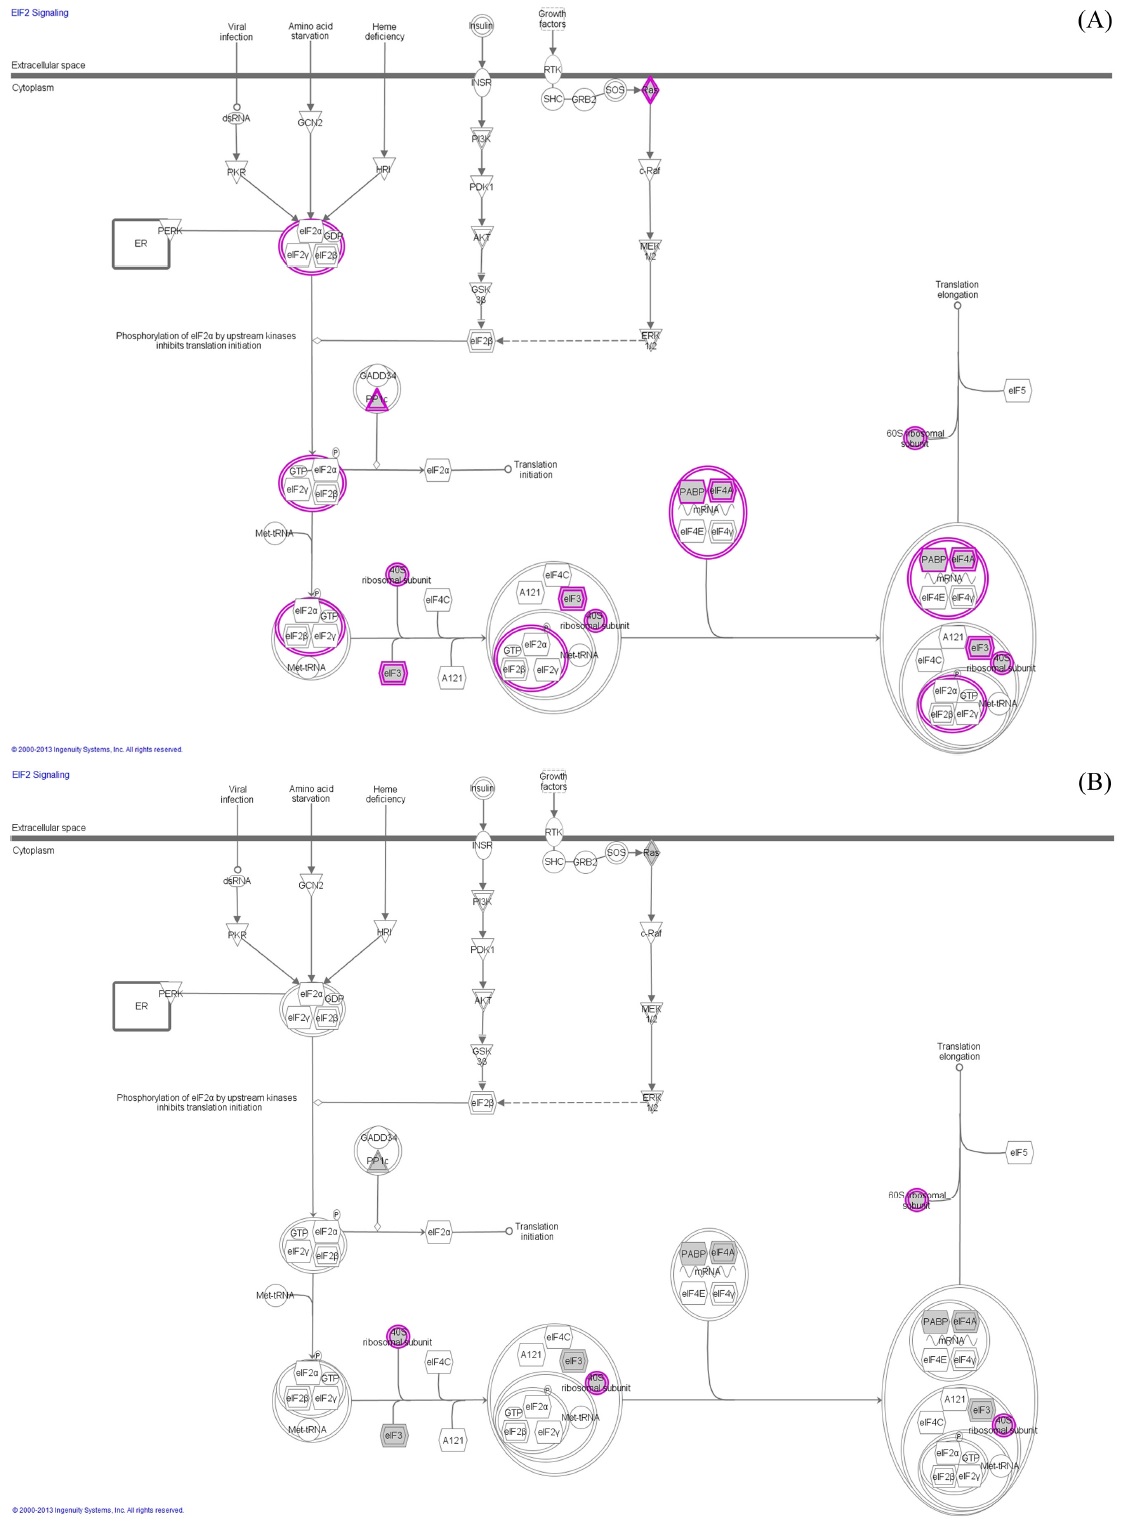
In order to confirm the applicability of heat shock treatment in label free quantitative analysis, we used untreated and doxorubicin (dox)-treated A549 cells. Table 2 lists the total number of peptides and proteins identified from untreated and dox-treated A549 cells processed with heat shock treatment and protease treatment. Heated untreated and dox-treated A549 cells showed 37% and 31% more peptides and proteins, respectively, compared to unheated A549 cells. Among the four groups, the tryptic peptide percentages were above 85%, confirming that heating increases the number of peptides and proteins identified. Table 3 lists proteins quantified from heated and unheated samples. A two fold increased in the identification of differentially expressed proteins was observed due to the generation of a higher number of peptides in heated samples. Differentially expressed proteins from both the heated and unheated samples were processed for pathway analysis using ingenuity. Figure 5 illustrates the mapping of identified proteins with the existing canonical pathways. Heated samples showed a higher number of proteins identified per pathway with a higher p-value for all pathways. Figure 5B depicts the log10(fold change dox/control)

Total number of peptides identified using sorcerer and the number of tryptic and missed cleavage sites for A549 control and doxorubicin treated
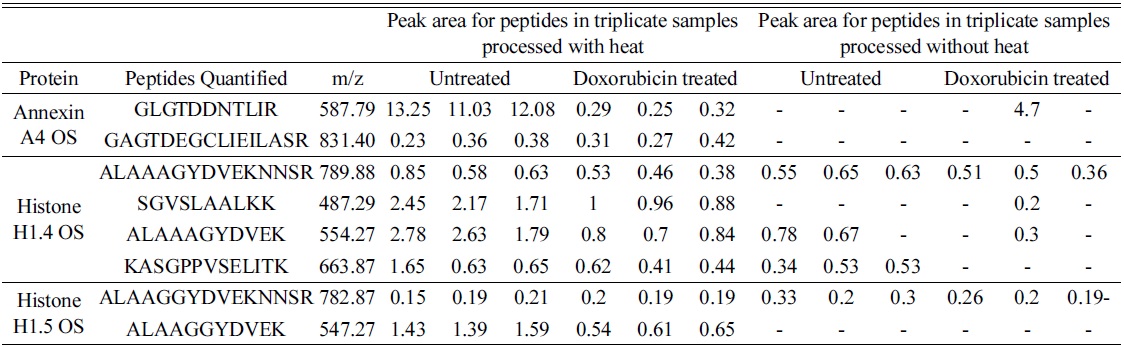
[Table 3.] Comparison of label free quantification with and without heat shock
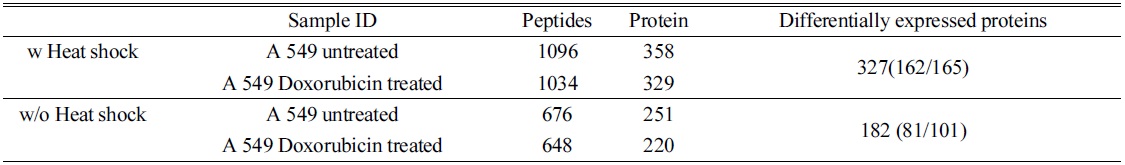
Comparison of label free quantification with and without heat shock
The elution profile of the peptides from both heated and unheated samples shows a similar BPC profile. Sixty eight percent of the proteins present in unheated samples were identified in heated samples by an increase in identification of about 25% unique peptides when compared to unheated samples. When the proteins were quantified using Ideal Q for differential expression, we found that 90% of the proteins identified from unheated samples were also detected in heated samples. Heated A549 cells showed a 20% increase in quantifiable peptides when compared to the unheated cells, and 97% of peptides from unheated samples were identified in heated samples. The differentially expressed proteins from untreated and doxorubicin-treated A549 cells with and without heating were compared for the levels of quantifiable peptides. Annexin A4 was 2 times downregulated in heated samples, while, unexpectedly, it was two times upregulated in protease treated samples. When we looked into the quantifiable peptides in the protein, heated samples showed two quantifiable peptides, whereas no quantifiable peptides were present in the other samples (Table 4).
[Table 4.] Quantifiable peptides in three selected proteins common in heated and non-heated samples.

Quantifiable peptides in three selected proteins common in heated and non-heated samples.
The heating efficiency of the thermal stabilization system allowed the efficient identification of a higher number of peptides and proteins compared to unheated samples, indicating that heating prior to proteolysis plays a major role in the identification of peptides and proteins through effective denaturation. Thus, we compared the sample preparation step with heating the samples at 95℃ for 30 s and 5 min using a heating block after addition of protease and phosphatase inhibitors to increase the denaturing capacity. The samples were processed in parallel and analyzed for eluted peptides using Agilent 6550 Q-TOF. The elution profile was similar to that of unheated samples. When examined for identified peptides and proteins, the number of identified peptides and proteins was more or less similar to that of unheated samples. A longer heating time did not show any significant increase in peptide and protein identification numbers as shown in Table 5. We observed a similar trend with the HCT-116 cell line (Figure 7). Heat treatment before trypsinization enhances the production of peptides. Hence, our data clearly demonstrate that heating prior to proteolysis efficiently denatures the proteins, which were intact in biological samples, and presents the whole proteome for efficient trypsinization by completely exposing the primary structure of the protein for efficient trypsinization. The heat shock inactivate proteins by virtue of heat to break the intermolecular hydrogen bonds, polar, and van der Waals interactions to make proteins lose their secondary and tertiary structure.27 This results in protein denaturation in a reproducible and irreversible manner, facilitates trypsin cleavage, and prevents protein degradation, thereby leading to increased identification of protein and peptide IDs in plasma, tissue, neutrophils, and yeasts.13,14,28 This is an interesting additional use of the instrument, which otherwise is mainly used to denature degradation enzymes irreversibly along with other proteins to preserve the proteome intact.
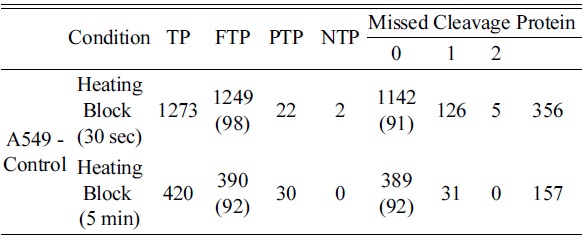
Comparison of heating time for identification of peptides and proteins from A549 cells using a heating block
Samples used in proteomics like tissue, plasma, cell lines, urine, saliva, yeast, and plants are highly complex with thousands of protein that can yield millions of peptides. Therefore, any deviation in the sample preparation steps can introduce artifacts, which can result in poor/undesired peptide identification, greatly affecting the peptide mapping at the end of the experiment after investing days of work. The present study shows that the heat shock treated sample in controlled conditions preserves the whole proteome by completely unwinding the secondary and tertiary structures, allowing proteins to be actively cleaved by trypsin to yield shorter fragments, which can be easily ionized. Effective thermal stabilization resulted in a higher number of peptides, probably due to the identification of low abundance proteins, and produces peptides that can be quantified. In order to obtain enhanced coverage of the proteome by means of high reproducibility, increased identification of low abundance proteins, and enhanced quantifiable peptides identification for biomarker candidates using clinical samples, the thermal stabilization system can be combined with various approaches. Moreover, the thermal stabilization system can significantly play a vital role in the quantitative identification of ideal biomarker candidates, using MRM analysis.