Due to development of information technology, the effectiveness of knowledge discovery from enormous document data is suggested in much of the literatures on this subject (Hearst. 1999). There are many web sites where customers can post their free comments about merchandise that they bought and used. On the internet, the number of customer reviews is increasing day by day. Therefore it has been easy to get a large amount of document data and analyze it for several purposes. Customer reviews consist of not only free comments but customer information and the degree of satisfaction about items as metadata. The analysis using the metadata is more helpful for knowledge discovery than using only text data. The techniques for text mining are developed for the purpose of getting information. Various methods have been proposed in this research field, for example, vector space model (Manning
In this paper, a vector space model is the focus for document analysis. To construct a vector space model for document analysis, the documents are separated into terms or words (morphemes) by using the morphological analysis (Nagata. 1994). After that, each document is represented by a vector whose elements express the information of word frequency of appearance. Because the vector space is built by the information of word frequency, the characteristics of a document vector model should be remarkable: high dimension and sparseness. Generally speaking, untold thousands of words or more should be treated to represent a document vector using effective words appearing in all documents.
As mentioned above, there are enormous words which are appeared in whole documents. In addition, term frequency of each word varies widely in length. Therefore, the performance of text analyzing depends on term frequency of words which is appeared each documents. That is, it depends on the length of documents. To avoid this, several weighting approach for each word has been proposed. For instance,
From above discussion, the purpose of this study is to propose a new weighting method for each word from the view point of supervised learning. We show the way of estimating an optimal word weighting by solving maximization problems. The effectiveness of this method is clarified by case experiments of applications to the customer review which are posted on web sites and newspaper articles which are used as a bench mark data.
In section 2, basic formulation of vector space model and weighting methods which have already proposed are explained. In section 3, the proposed method of weighting each word and the way of its estimation is explained. The illustration of simulation experiments in order to clarify the effectiveness of our proposal and the results acquired from the experiments are explained in section 4. Finally, the conclusion of this study is stated in section 5.
2. BASIC INFORMATION FOR ANALYSIS OF TEXT DOCUMENTS
In this paper, the vector space model is adopted to represent the document data. In this section, the premises and the notations of this research are defined and relative methods are explained.
2.1 Similarity among Documents
Let the set of documents be Δ={
All documents in Δ are separated into morphologies by the morphological analysis. Selecting valid words from the given morphologies by using frequencies, mutual information, or other methods, a word set is constructed to represent documents in the vector space. Let the word set from the all documents in Δ be Σ = {
Then each document can be expressed as a point in the vector space. Here,
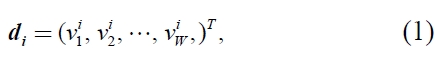
where,
By expressing document as a vector, a similarity or distance metrics between documents can be measured in the vector space. Here, the distance metric of document vectors
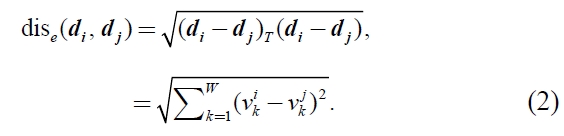
However, the Euclid distance sometimes cannot work effectively to treat the document data. For example, many elements in a document vector are almost 0 and this property is called “sparseness.” If there are only a few different words between two documents, these documents are judged as having high similarity.
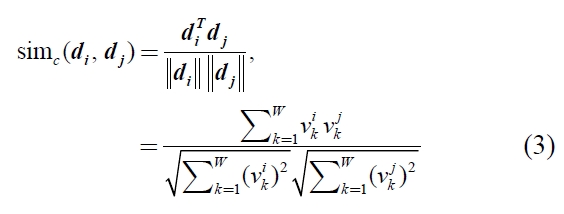
On the other hand, the cosine similarity measure between document vectors has asymptotically good performance in a sparse vector space (Goto
2.2 Weighting Method for Documents
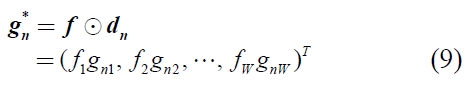
The way of weighting can be expressed the Hadamard product of document vector
Here,
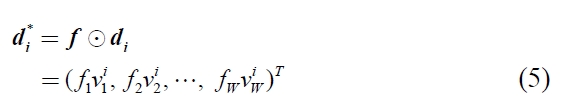
where, let
There are several weighting methods for text data analyzing. As mentioned above, the most famous method is is
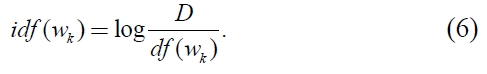
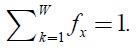
Here, let the weight function

3. THE METHOD OF SUPERVISED WEIGHTING FOR TEXT CLASSIFICATION
As mentioned above,
In this section, we propose the optimal weighting method and its estimation for text classification. And we derive the expression of optimal weight is given by the solution of maximization problem.
To formulate the learning algorithm to estimate the optimal weighting from training data set, the centroid of each category is defined as equation (8). The centroid can be calculated by using the training data with known category. Let the centroid vector of category
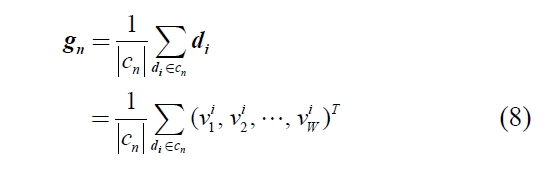
Here, the |
Normally, training data should be allocated by near the centroid of its category because a new document data is classified by the distance from the centroids. Due to that, the optimization of the weight should maximize the similarity between training data and its centroid.
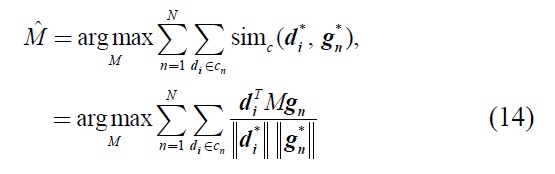
From the above discussion, the estimation of optimal weighting vector
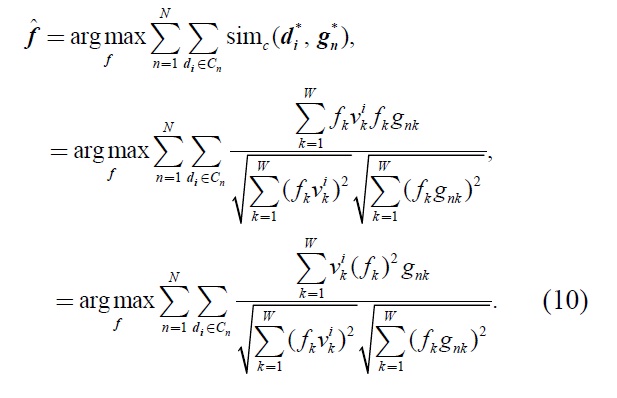
Here,
Equation (10) can be expressed by matrix operation by using the diagonal matrix which is constructed its elements by (
In order to solve the above problem, we introduce the diagonal metric matrix
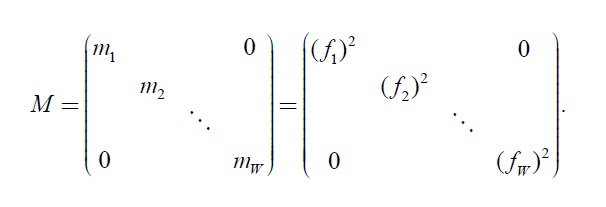
Here,
From above discussion, the equation (10) can be rewritten as follows:
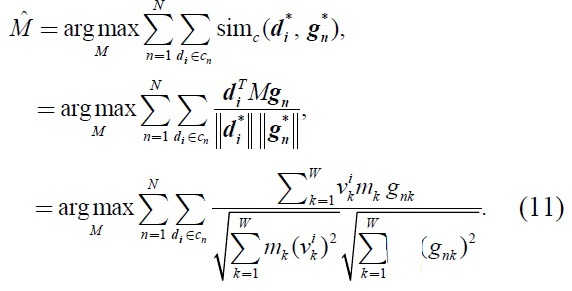
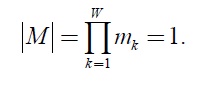
Supject to |M| = 1
From the above formulation, the following theorem is obtained.
Theorem 1: The metric matrix
which is satisfies the equation (11) is given by
(For the proof, see APPENDIX.)
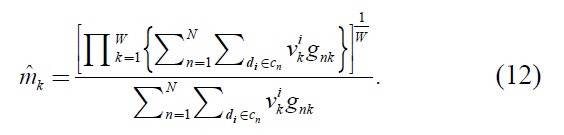
From above discussion, the similarity between document vector and centroid can be calculated by using the metric matrix

given by the equation (12) as follows:
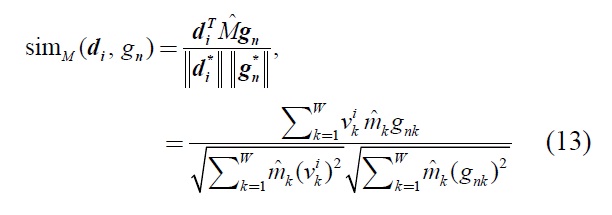
After calculating similarity among test data and all centroids by equation (13), test data is classified to the most similar category.
In this section, simulation experiments are conducted to verify the effectiveness of our method by using Japanese document data in practice. The experiments are performed for the two data sets, i.e, customer reviews which are posted on a web site and newspaper articles with pre-assigned categories. The suitable weight is estimated by learning through these data. And the effectiveness is confirmed by the performance of classification of test data into the correct categories.
The basic process of experiments is as follows.
Step1: Calculation of all centroids from training data.
Step2: From equation (12), learning metric matrix

from training data.
Step3: From equation (13), to calculate similarity among test data and all category’s centroid. And it classifies that with most similar category.
As mentioned above, two different types of data are used on this experiment. The first one is articles from the Mainichi newspaper in 2005 which are used as a benchmark data for document classification. The second one is customer review that is posted on a web site in order to recognize the performance of our method for real data. News articles in the Mainichi newspaper consist of several categories (economics, sports, politics and so on) and this time, three and five categories are extracted at random. Customer review consists of not only text data but degree of customer’s satisfaction as mentioned above. In this experiment, we use two categories of that which are highest degree of satisfaction and lowest one.
A condition of experiments is shown in Table 1.
[Table 1.] A Condition of Experiments.
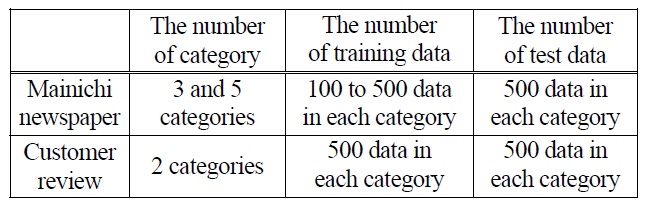
A Condition of Experiments.
For the sake of comparison, the experiment of the common cosine measure with only term frequency (
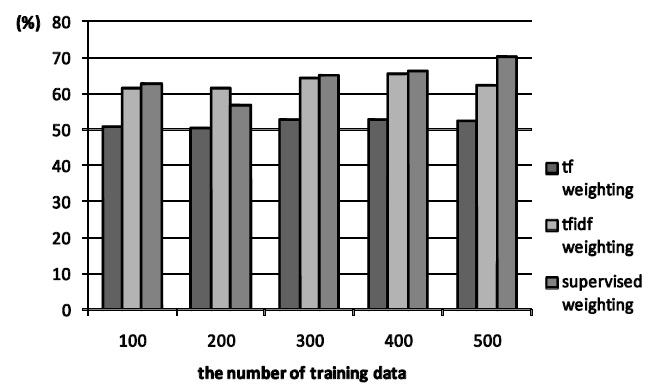
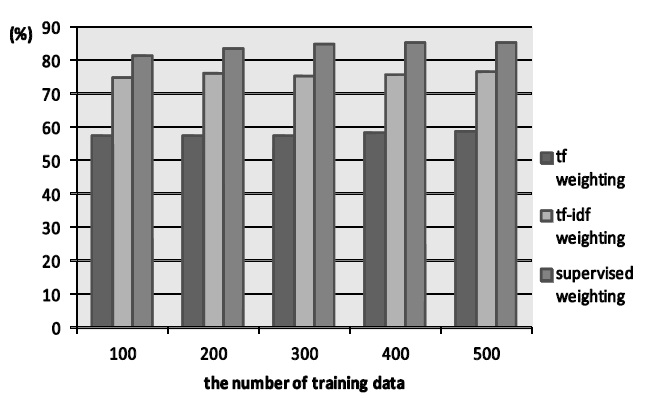
The results of experiments are shown in Figure 1, Figure 2 and Figure 3. Figure 1 and Figure 2 show the cases of the newspaper article. The former is the case of three categories and the latter is that of five.
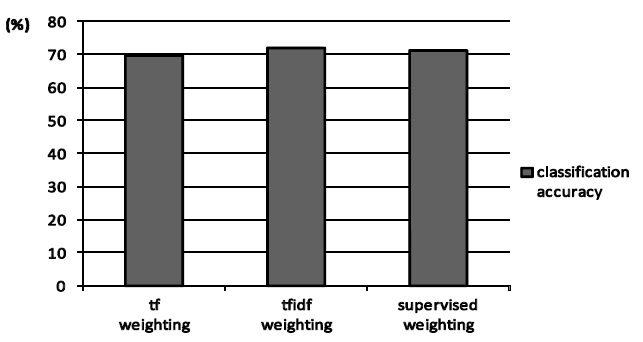
In addition, Figure 3 shows the case of customer review. It shows supervised weighting (proposed method),
From the Figure 1 and Figure 2, the proposed method is basically superior to
From the result, the proposed method is more suitable than conventional methods when newspaper article is used. In the proposed method, category information of training data as weighting parameter is taken into consideration. This property can work well for text classification. On the other hand,
However, the performance of the proposed method which can be solved regarded as the optimal solution is not improved drastically in the customer review classification. Because customer write their comment freely for merchandise which they bought and used. Due to the fact, it may appear many invalid words and the tendency of words is not different between each category. The customer reviews are too high of freedom of text data for the proposed method to estimate such complex statistical structure. By these reason, the proposed method doesn’t work effectively. It is necessary to improve the method as getting better performance for customer review (real data) as the future work.
In this paper, the suitable weighting method by estimating optimal weight from a training data set is proposed. Our proposal is based on supervised learning with optimal metric matrix
which can be calculated by a training data set.
From the simulation experiment, the proposed method is superior than conventional method when newspaper article is used.
A future work is to calculate the contribution ratio in each word which is weighted by the proposed method for the text classification in order to improve performance.
We show the proof of Theorem 1 as follows.
To solve for
In the following, to simplify the calculation, document
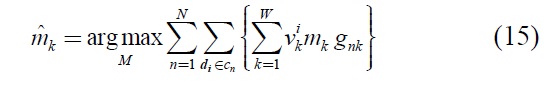
Here,
Therefore,
is derived.
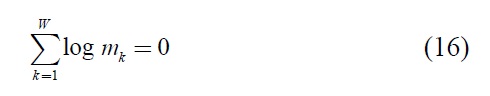
To maximize the equation (15) under the equation (16), Lagrange multipliers method is used. Here, let Lagrange multiplier be λ, and Lagrange function can be defined
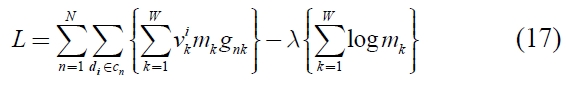
Here,
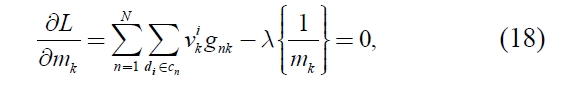
is derived. To solve the equation (18) for
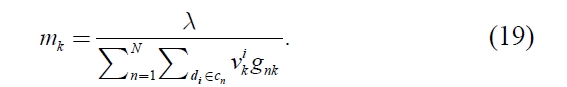
is derived.
Here, let

Then form the equation (19),

is
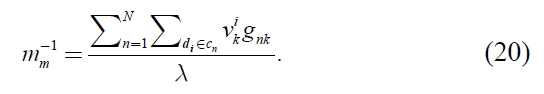
Here, let set
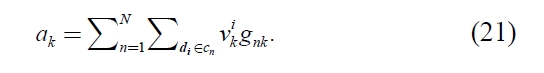
Then
Therefore,
is derived. From the equation (22),
is derived. Therefore, λ becomes
Accordingly, form equations (19) and (25),

becomes
Here, because
Consequently,
is derived.
Accordingly, from equations (26) and (28), each
becomes
The proof is complete. □
In case of ||d*i|| ≠ 1, ||g*n|| ≠ 1, it can be easy to extend.