검색 전체 메뉴
PDF
맨 위로
OA 학술지
Simultaneous Generation of Orthogonally Polarized Signals in an Optical Parametric Oscillator Based on Periodically Poled Lithium Niobate
  • 비영리 CC BY-NC
  • 비영리 CC BY-NC
ABSTRACT
Simultaneous Generation of Orthogonally Polarized Signals in an Optical Parametric Oscillator Based on Periodically Poled Lithium Niobate
KEYWORD
PPLN , OPO , Quasi-phase-matching
  • I. INTRODUCTION

    Optical parametric oscillators (OPO) are predominant sources of tunable coherent radiation and have been exploited in various applications. Ever since the first demonstration of OPO by Giordmaine et al. [1], there has been significant progress in the development of continuous wave (CW) as well as pulsed OPO’s supported by the development of proper nonlinear crystals and pump lasers [1, 2]. The use of quasi phase matched (QPM) nonlinear crystals further accelerated this progress [3]. Their ability to offer wide wavelength tunability, narrow linewidths and enhanced conversion efficiency by utilizing the largest nonlinear optical tensor element enabled us to venture frequency ranges which were unattainable with conventional lasers, and could be exploited in various applications. In particular, tunable near ~ mid-IR laser sources could be used for investigating fingerprint bands of molecules owing to their fundamental vibrational modes, and also for remote sensing, high resolution spectrum analysis, imaging and military applications [4-7] and atmospheric pollution monitoring [8]. These unique applications have motivated researchers to further develop efficient mid-IR laser sources.

    OPOs based on various QPM nonlinear crystals have also been implemented in various operation regimes. OPOs employing periodically poled (PP) congruent LiNbO3 (CLN) crystals have been demonstrated in continuous wave (CW) [9] and ns-pulse [3, 10] regimes. Periodically poled MgO-doped stoichiometric LiTaO3 (PPMgSLT) [11, 12] have also been implemented in CW [13], ns [14], and ultrashort pulses regimes [15, 16], which further widened the scope of the OPO applications. In particular, PPLN has been vastly used in the OPOs for high-conversion efficiency because of its large effective nonlinear coefficient and wide transparency in the visible and IR. Doped variants of this crystal further extended its performance. For example, congruent LiNbO3 crystals doped with 5 mol% of MgO are used in most PPLN OPOs because it has been shown that they withstand ~100 times higher optical intensities than the undoped congruent LiNbO3 [17, 18].

    Optical damage becomes critical in situations when there is a need to design an OPO which exploits the nonlinear optical tensor element d32 (=d31). Such an OPO would require a pumping intensity which approaches the damage threshold of the materials to overcome the cavity losses and hence would demand a material such as MgO-doped CLN(MgCLN) with an improved optical damage resistance.

    Most of the works done with the OPOs using PPMgLN are based on availing the d33 coefficient since it is the largest among the tensor elements of LN, and hence efficient frequency conversions could be obtained. However, not much has been reported so far for the OPOs using the d32 tensor element. To our knowledge, the report by Umemura et al. is the only experimental work [19]. They, however, gave only a brief explanation and did not deal with important characteristics of the type-1 OPO. Although it is known that d32 is about 6 times smaller than d33, there are some instances where this tensor element is important: i) Type-1 OPO plays a crucial role in establishing an accurate Sellmeier formula for the ordinary refractive index [19]. This estimation can help studying the harmful effects that take place in nonlinear optical microresonators made of anisotropic materials wherein crossover between the ordinary and extraordinary polarization modes occurs, limiting the performance of the resonator [20]. ii) Ideas have been proposed for implementing a type-1 OPO resonator for group-velocity-matched ultra-fast mid-infrared pulse generation [21], which has not yet been experimentally demonstrated.

    Here, we have designed an OPO which functions as a dual wavelength emitter by simultaneously oscillating orthogonally polarized signals under the type-0 and type-1 QPM conditions in PPMgCLN which utilize d33 and d32, respectively. This configuration was achieved by harnessing the natural dispersion of PPMgCLN. Although simultaneous QPM spontaneous parametric downconversions (SPDC) were demonstrated in a PPKTP crystal [22], experimental realization of simultaneous oscillations of the dual orthogonally polarized signals is the first report to our knowledge.

    II. EXPERIMENTS

    A schematic diagram of our experimental setup is shown in Fig. 1. We used a PPMgCLN crystal with three channels having different QPM periods, 30.49, 31.02, and 31.59 μm. Each channel had a dimension of 10 mm (x) × 1 mm (y) × 1 mm (z). These QPM periods were designed to generate signals in the wavelength range of 1.30~1.75 μm satisfying the following simultaneous nonlinear interactions; type-0 SPDC (e→e + e), and type-1 SPDC (e→o + o), both of which satisfying the 1st order QPM in the temperature range of 20~130°C, according to the Sellmeier formulas given by Gayer et al. [23]. It should be noted that the sign of the wavevector mismatch for the type-1 SPDC is opposite to that for the type-0 SPDC, while the magnitudes are nearly the same when pumped at 1.064 μm.

    For the type-1 interaction, however, the Sellmeier formula for the ordinary wave in [23] was found to be inaccurate in our previous study [24]. Therefore, in predicting the type-1 signal wavelength, a constant temperature up-shift of 65°C was taken into account in using the Sellmeier formula for the ordinary wave as in [24]. Although, the Sellmeier formula of Umemura et al. [19] was p roven to be more accurate, we could not use it because their formula was valid only up to 3.7 μm whilst the idler in our experiment reached 4.8 μm.

    The input and output facets of the crystal (x-planes) were anti-reflection coated for the signal wavelength range of 1.3~1.8 μm (reflectance <1%), whilst the transmitance for the pump (1064 nm) was 88.5%. The crystal was mounted in an oven whose temperature could be varied from 20 to 130°C with an accuracy of 0.1°C.

    The pump laser was a diode-pumped solid-state laser (Bright Solutions, Wedge HB) with a pulse width of 1.5 ns, a repetition rate of 1 KHz, and a maximum average output power of 1.5 W. The output wavelength was centered at 1.064 μm with a linewidth of ~1.2 nm, and the spatial mode was near-Gaussian. The pump beam was focused into the crystal and propagated along the crystalline x-axis with the polarization direction parallel to the z-axis. The 1/e2 beam radius at the center of the crystal was estimated to be 200 μm by scanning knife-edge method. The sample was placed between two identical concave mirrors making a linear cavity of 75 mm as shown in Fig. 1, each having a radius of curvature of 200 mm, dielectric-coated to transmit 95% of the pump and reflect 85 ± 0.2% in the signal range from 1.30~1.75 μm. The choice of beam radius of 200 μm and cavity length of 75 mm was chosen to enable the signal beam to have mode matching with the cavity mirrors which had a radius of curvature of 20 cm in a near-confocal configuration.

    Appropriate filters were used to block the pump before the OPO signal output was focused to an InGaAs CCD spectrometer (Avantes, AvaSpec-NIR-1750). Initially, the OPO was setup for the type-0 configuration because its high throughput facilitated cavity alignment. The extraordinary (z-polarized) OPO signal originating via d33 could be obtained by rotating the polarizer (P) parallel to the z-axis of the PPMgLN crystal. The cavity length was adjusted to maximize the OPO output signal. On the other hand, to obtain the type-1 OPO signal, the polarizer was aligned parallel to the y-axis. The ordinary (y-polarized) OPO signal originating via d32 was measured with the same spectrometer. Due to the limited resolution (~5 nm) of the spectrometer and its noisy outputs for fluctuating signals, the output spectrum should be used only for peak indication purpose. We verified the peak detection function by using a monochromator with a higher resolution (<1 nm).

    III. RESULTS AND DISCUSSION

       3.1. Type-0 OPO

    Figure 2 shows the spectra for the 1st order QPM type-0 signal at three different crystal temperatures for the QPM period of 30.49 μm channel pumped with 200 mW. The experimental signal wavelengths agreed with the calculated ones using the Sellmeier formula for the extraordinary wave [23]. It should be noted that the measured spectra appear to be much broader than the actual signal spectral width because the resolution of the spectrometer was limited (~6 nm). We measured the signal line width using a monochromator with a resolution of ~1 nm, verifying that the average signal bandwidth was about 2 nm. It is still much broader than that of an OPO pumped by a single-mode laser [25], which can be attributed to the multi-mode nature of the pump [26]. Although our spectrometer had a poor resolution, we kept on using it by reading the peak wavelength because it was much easier to track the signal peak movements. Further tuning properties were investigated using the three channels with different QPM periods at 85°C. Figure 3 shows the type-0 OPO signal spectra for the three channels, which also agreed with the predictions made by the Sellmeier formula for the extraordinary wave [23].

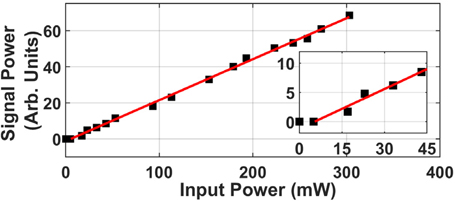
    The oscillation was confirmed by observing the output signal behavior as a function of pump power, for the QPM period of 30.49 mm at the crystal temperature of 85°C. Figure 4 shows the relative output signal power versus the pump power. The minimum detectable signal power was obtained at an input threshold power of 5 mW, which was about two times larger than the calculated value [27]. This could be due to various factors such as uncertainty ineffective nonlinear coefficient, pump reflection losses at the mirrors and crystal surfaces, etc. This indicated that the OPO was properly aligned and good mode matching was established. Beyond the pump power of 300 mW, the type-0 OPO began to saturate and the power ramping experiment was terminated at this point. The pump depletion at this point was ~10%. The pump depletion was estimated by measuring the residual pump intensity after filtering out the signal and idler using suitable filters. The pump depletion was checked at 500 mW pump power. This was done by comparing the two cases: Firstly, the residual pump intensity was measured for the optimized OPO cavity when the signal output was maximal. Then, after mis-aligning the OPO cavity so that the signal intensity dropped down drastically, the residual pump power was measured. As a result, a 10% increase in the pump intensity was observed in the latter case compared to that for the optimized cavity.

       3.2. Type-1 OPO

    For the QPM type-1 OPO, the crystal had to be pumped more strongly than the type-0 OPO because of the smaller nonlinear coefficient d32 than d33. For this purpose, the pump power was gradually increased to 350 mW before the type-1 signal was observed. From this power level onwards, type-0 and type-1 QPM OPO occured simultaneously for all the three QPM channels. Because the type-0 signal was so strong, it was impossible to separate the type-1 signal from it even with polarizers with very high extinction ratio (100,000:1) when the two spectra overlapped. Therefore, we adjusted the temperature such that the wavelengths slightly walked off from each other, and used an additional monochromator to fully separate them.

    A temperature tuning experiment was done for the QPM period of 30.49 μm channel, whose result is shown in Fig. 5. The experimental peaks were observed at 85°C, 95°C and 105°C, while the QPM peaks were expected at 20°C, 30°C and 40°C by the Sellmeier formula for the ordinary index in [23]. We note that there is a constant shift of 65°C in each case, which could be attributed to a significant difference between the actual ordinary refractive index of MgCLN and the predicted one [23], as we verified in [24]. It should be noted that temperature tuning makes both type-0 and type-1 signals move to a longer wavelength region with increasing temperature, although the amount of the shift is different between the two.

    For further verification of the type-1 OPO, we also took the signal spectra for the three channels with different QPM periods, whose result is shown in Fig. 6. It can be seen that with increasing grating period the peak moves towards lower wavelength, the opposite direction to that of the type-0 OPO, which agrees with the prediction by the Sellmeier formulas [23]. It should be noted that we have taken into account a constant shift of 65°C to fit the experimental data in Fig. 6 as in [24].

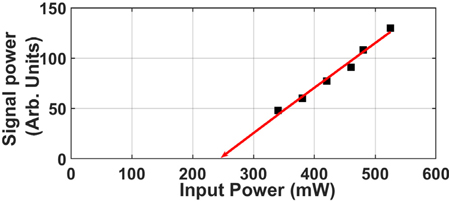
    Finally, we measured the type-1 OPO signal with increasing pump power for the channel with QPM period of 31.59 μm at T = 85°C. As seen in Fig. 7, the threshold for type-1 signal was 235 mW, which is about 40 times larger than the type-0 threshold. This value was slightly larger than the estimated ratio of (d33/d32)2 = 36 based on the reported values of the nonlinear coefficients tensor elements [28], which can be due to small differences in the reported values and the uncertainties in measuring the threshold pump powers (The reported d-values were measured at different wavelengths from those in our experiment). Nevertheless, our pump power ramping experiment for type-1 OPO exhibited good linearity and hence we were able to demonstrate dual OPO. Beyond 550 mW (corresponding to an intensity of 600 MW/cm2), we observed optical damages starting at the crystal end facet.

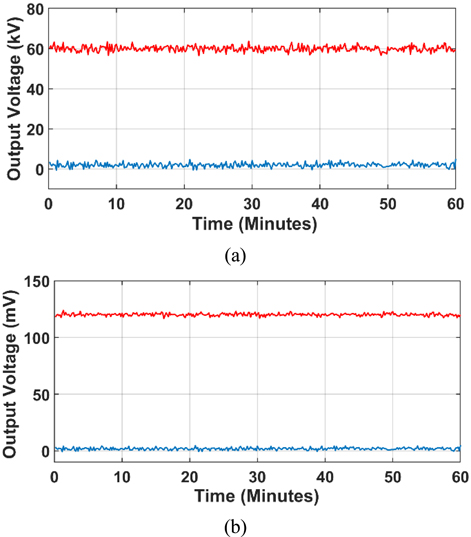
    Finally, we carried out stability tests of our OPO in terms of both power and wavelength. The power was measured with a Ge-photodiode for the type-0 and type-1 OPO signals at 1.55 μm and 1.38 μm, respectively, as shown in Fig. 8. The wavelength stability for both the OPO’s was checked on the spectrometer output. After the OPO continuously operated for an hour, there were not measurable changes in the peak wavelengths for both type-0 and type-1, making us believe that our OPO was stable in terms of wavelength as well as power.

    IV. CONCLUSION

    We successfully realized a stable OPO in a PPMgLN crystal that could oscillate at different frequencies whose polarizations were orthogonal to each other, harnessing the natural dispersion of the crystal. The type-0 signal could be tuned from 1.564 to 1.715 μm by using three different QPM periods (30.49, 31.02, and 31.59 μm), whilst the type-1 signal could be tuned from 1.377 to 1.44 μm by changing the PPLN temperature from 85°C to 105°C for a QPM period of 30.49 mm. We found that the Sellmeier formula for the ordinary index for MgCLN needs to be corrected [23], or extended [19]. Our experiments would also take us closer to the realization of the group-velocity matched type-1 ultrafast OPO [21].

참고문헌
  • 1. Giordmaine J. A., Miller R. C. 1965 Tunable coherent parametric oscillation in LiNbO3 at optical frequencies [Phys. Rev. Lett.] Vol.14 P.973-976 google cross ref
  • 2. Smith R. G., Geusic J. E., Levinstein H. J., Rubin J. J., Singh S., Uitert L. G. V. 1968 Continuous optical parametric oscillation in Ba2NaNb5O15 [Appl. Phys. Lett.] Vol.12 P.308-310 google cross ref
  • 3. Myers L. E., Eckardt R. C., Fejer M. M., Byer R. L., Bosenberg W. R., Pierce J. W. 1995 Quasi-phase-matched optical parametric oscillators in bulk periodically poled LiNbO3 [J. Opt. Soc. Am. B] Vol.12 P.2102-2116 google cross ref
  • 4. Walsh B. M., Lee H. R., Barnes N. P. 2016 Mid infrared lasers for remote sensing applications [J. Lumin.] Vol.169 P.400-405 google cross ref
  • 5. Bellisola G., Sorio C. 2012 Infrared spectroscopy and microscopy in cancer research and diagnosis [Am. J. Cancer Res.] Vol.2 P.1-21 google
  • 6. Amor R., Norris G., Dempster J., Amos W. B., McConnell G. 2012 A compact instrument for adjusting laser beams to be accurately coincident and coaxial and its use in biomedical imaging using wave-mixed laser sources [Rev. Sci. Instrum.] Vol.83 P.083705 google cross ref
  • 7. Johnson T. A., Diddams S. A. 2012 Mid-infrared upconversion spectroscopy based on a Yb:fiber femtosecond laser [Appl. Phys. B] Vol.107 P.31-39 google
  • 8. Liu J., Liu Q., Yan X., Chen H., Gong M. 2010 High repetition frequency PPMgOLN mid-infrared optical parametric oscillator [Laser. Phys. Lett.] Vol.7 P.630-633 google cross ref
  • 9. Lindsay I. D., Petridis C., Dunn M. H., Ebrahimzadeh M. 2001 Continuous-wave pump-enhanced singly resonant optical parametric oscillator pumped by an extended-cavity diode laser [Appl. Phys. Lett.] Vol.78 P.871-873 google cross ref
  • 10. Ishizuki H., Taira T. 2005 High-energy quasi-phase-matched optical parametric oscillation in a periodically poled MgO: LiNbO3 device with a 5 mm × 5 mm aperture [Opt. Lett.] Vol.30 P.2918-2920 google cross ref
  • 11. Hatano H., Watanabe M., Kitamura K., Naito M., Yamawaki H., Slater R. 2015 Mid IR pulsed light source for laser ultrasonic testing of carbon-fiber-reinforced plastic [J. Opt.] Vol.17 P.094011 google cross ref
  • 12. Hatano H., Slater R., Takekawa S., Kusano M., Watanabe M. 2017 Optimization of mid-IR generation from a periodically poled MgO doped stoichiometric lithium tantalate optical parametric oscillator with intracavity difference frequency mixing [J. Appl. Phys.] Vol.56 P.072701 google cross ref
  • 13. Henderson A., Stafford R. 2006 Low threshold, singly-resonant CW OPO pumped by an all-fiber pump source [Opt. Express] Vol.14 P.767-772 google cross ref
  • 14. Wu B., Kong J., Shen Y. 2010 High-efficiency semi-external-cavity-structured periodically poled MgLN-based optical parametric oscillator with output power exceeding 9.2 W at 3.82 μm [Opt. Lett.] Vol.35 P.1118-1120 google cross ref
  • 15. Kokabee O., Esteban-Martin A., Ebrahim-Zadeh M. 2010 Efficient, high-power, ytterbium-fiber-laser-pumped picosecond optical parametric oscillator [Opt. Lett.] Vol.35 P.3210-3212 google cross ref
  • 16. O’Connor M. V., Watson M. A., Shepherd D. P., Hanna D. C., Price J. H. V., Malinowski A., Nilsson J., Broderick N. G. R., Richardson D. J., Lefort L. 2002 Synchronously pumped optical parametric oscillator driven by a femtosecond mode-locked fiber laser [Opt. Lett.] Vol.27 P.1052-1054 google cross ref
  • 17. Georgiev D., Gapontsev V. P., Dronov A. G., Vyatkin M. Y., Rulkov A. B., Popov S. V., Taylor J. R. 2005 Watts-level frequency doubling of a narrow line linearly polarized Raman fiber laser to 589 nm [Opt. Express] Vol.13 P.6772-6776 google cross ref
  • 18. Choubey R. K., Sen P., Sen P. K., Bhatt R., Kar S., Shukla V., Bartwal K. S. 2006 Optical properties of MgO doped LiNbO3 single crystals [Opt. Mater.] Vol.28 P.467-472 google cross ref
  • 19. Umemura N., Matsuda D. 2016 Thermo-optic dispersion formula for the ordinary wave in 5 mol% MgO doped LiNbO3 and its application to temperature insensitive second-harmonic generation [Opt. Commun.] Vol.367 P.167-173 google cross ref
  • 20. Werner C. S., Sturman B., Podivilov E., Manjeshwar S. K., Buse K., Breunig I. 2018 Control of mode anticrossings in whispering gallery microresonators [Opt. Express] Vol.26 P.762-771 google cross ref
  • 21. Zhong H., Zhang L., Li Y., Fan D. 2015 Group velocity mismatch-absent nonlinear frequency conversions for mid-infrared femtosecond pulses generation [Sci. Rep.] Vol.5 P.10887 google cross ref
  • 22. Lee H. J., Kim H., Cha M., Moon H. S. 2012 Simultaneous type-0 and type-II spontaneous parametric down-conversions in a single periodically poled KTiOPO4 crystal [Appl. Phys. B] Vol.108 P.585-589 google cross ref
  • 23. Gayer O., Sacks Z., Galun E., Arie A. 2008 Temperature and wavelength dependent refractive index equations for MgO-doped congruent and stoichiometric LiNbO3 [Appl. Phys. B] Vol.91 P.343-348 google cross ref
  • 24. Pavan Kumar CH. S. S., Kim J., Kim B. J., Cha M. 2018 Estimation of the ratio of nonlinear optical tensor components by measuring second harmonic generation and parametric down conversion outputs in a single periodically poled LiNbO3 crystal [Curr. Opt. Photon.] Vol.2 P.606-611 google
  • 25. Bae I.-H., Moon H. S., Zaske S., Becher C., Kim S. K., Park S.-N., Lee D.-H. 2011 Low-threshold singly resonant continuous-wave optical parametric oscillator based on MgO-doped PPLN [Appl. Phys. B] Vol.103 P.311-319 google cross ref
  • 26. Smith A. V. 2005 Bandwidth and group-velocity effects in nanosecond optical parametric amplifiers and oscillators [J. Opt. Soc. Am. B] Vol.22 P.1953-1965 google cross ref
  • 27. Boyd R. W. 2008 Chapter 2 google
  • 28. Shoji I., Kondo T., Kitamoto A., Shirane M., Ito R. 1997 Absolute scale of second-order nonlinear-optical coefficients [J. Opt. Soc. Am. B] Vol.14 P.2268-2294 google cross ref
OAK XML 통계
이미지 / 테이블
  • [ FIG. 1. ]  Schematic diagram of experimental setup for OPO. L: Focusing lens, M1 and M2: Cavity mirrors, F: Filters, P: Polarizer.
    Schematic diagram of experimental setup for OPO. L: Focusing lens, M1 and M2: Cavity mirrors, F: Filters, P: Polarizer.
  • [ FIG. 2. ]  Signal spectra for type-0 OPO for QPM period of 30.49 μm at 85°C (filled circles), 95°C (open squares), and 105°C (filled triangles). Solid lines: QPM bands calculated with Sellmeier formula [23] at 85°C (blue), 95°C (red), 105°C (yellow).
    Signal spectra for type-0 OPO for QPM period of 30.49 μm at 85°C (filled circles), 95°C (open squares), and 105°C (filled triangles). Solid lines: QPM bands calculated with Sellmeier formula [23] at 85°C (blue), 95°C (red), 105°C (yellow).
  • [ FIG. 3. ]  Signal spectra for type-0 OPO at T = 85°C for QPM period of 30.49 μm (filled circles), 31.02 μm C (open squares), and 31.59 μm (filled triangles). Solid lines: QPM bands calculated with Sellmeier formula [23] for QPM period of 30.49 μm (blue), 31.02 μm (red), 31.59 μm (yellow) at T = 85°C.
    Signal spectra for type-0 OPO at T = 85°C for QPM period of 30.49 μm (filled circles), 31.02 μm C (open squares), and 31.59 μm (filled triangles). Solid lines: QPM bands calculated with Sellmeier formula [23] for QPM period of 30.49 μm (blue), 31.02 μm (red), 31.59 μm (yellow) at T = 85°C.
  • [ FIG. 4. ]  Signal power versus pump power for type-0 OPO. Filled squares: measured type-0 signal power. Solid line: linear fit. Inset: Expanded view for low pump powers.
    Signal power versus pump power for type-0 OPO. Filled squares: measured type-0 signal power. Solid line: linear fit. Inset: Expanded view for low pump powers.
  • [ FIG. 5. ]  Signal spectra for type-1 OPO for QPM period of 30.49 μm at 85°C (filled circles), 95°C (open squares), and 105°C (filled triangles). Solid lines: QPM bands calculated with Sellmeier formula [23] at 85°C (blue), 95°C (red), 105°C (yellow).
    Signal spectra for type-1 OPO for QPM period of 30.49 μm at 85°C (filled circles), 95°C (open squares), and 105°C (filled triangles). Solid lines: QPM bands calculated with Sellmeier formula [23] at 85°C (blue), 95°C (red), 105°C (yellow).
  • [ FIG. 6. ]  Signal spectra for type-1 OPO at T = 85°C for QPM period of 30.49 μm (filled circles), 31.02 μm C (open squares), and 31.59 μm (filled triangles). Solid lines: QPM bands calculated with Sellmeier formula [23] for QPM period of 30.49 μm (blue), 31.02 μm (red), 31.59 μm (yellow) at T = 85°C.
    Signal spectra for type-1 OPO at T = 85°C for QPM period of 30.49 μm (filled circles), 31.02 μm C (open squares), and 31.59 μm (filled triangles). Solid lines: QPM bands calculated with Sellmeier formula [23] for QPM period of 30.49 μm (blue), 31.02 μm (red), 31.59 μm (yellow) at T = 85°C.
  • [ FIG. 7. ]  Signal power versus pump power for type-1 OPO. Filled squares: measured type-0 signal power. Solid line: linear fit.
    Signal power versus pump power for type-1 OPO. Filled squares: measured type-0 signal power. Solid line: linear fit.
  • [ FIG. 8. ]  Power stability measurement of a) Type-0, and b) Type-1 OPO signals. Solid lines: Blue (background noise), Red (signal).
    Power stability measurement of a) Type-0, and b) Type-1 OPO signals. Solid lines: Blue (background noise), Red (signal).
(우)06579 서울시 서초구 반포대로 201(반포동)
Tel. 02-537-6389 | Fax. 02-590-0571 | 문의 : oak2014@korea.kr
Copyright(c) National Library of Korea. All rights reserved.